
A year ago, ChatGPT was a side tool people used quietly for drafts and quick answers. In 2026, you see it in everyday work: client emails, support workflows, research briefs, meeting notes, and internal playbooks.
Hence, the shift created a new problem for leaders. Adoption is easy to claim, but hard to measure. Teams move fast until one mistake triggers tighter rules, then usage splinters by role, risk, and review standards.
On NEWMEDIA.COM, the 2026 update pulls together 100+ ChatGPT usage benchmarks on adoption by role, frequency of use, top tasks, and reported impact on speed and output quality. Apply the numbers to set rollout expectations, choose practical use cases, and build guidelines to follow.
Overall ChatGPT Adoption & User Growth
Awareness of ChatGPT among knowledge workers often sits above 80% in digital markets, which is accelerating investment in structured ChatGPT SEO.
Monthly usage among office-based roles commonly lands around 30% to 55%, with higher penetration in marketing, product, and engineering.
Weekly active usage inside information roles often reaches 25% to 45% once access becomes normal.
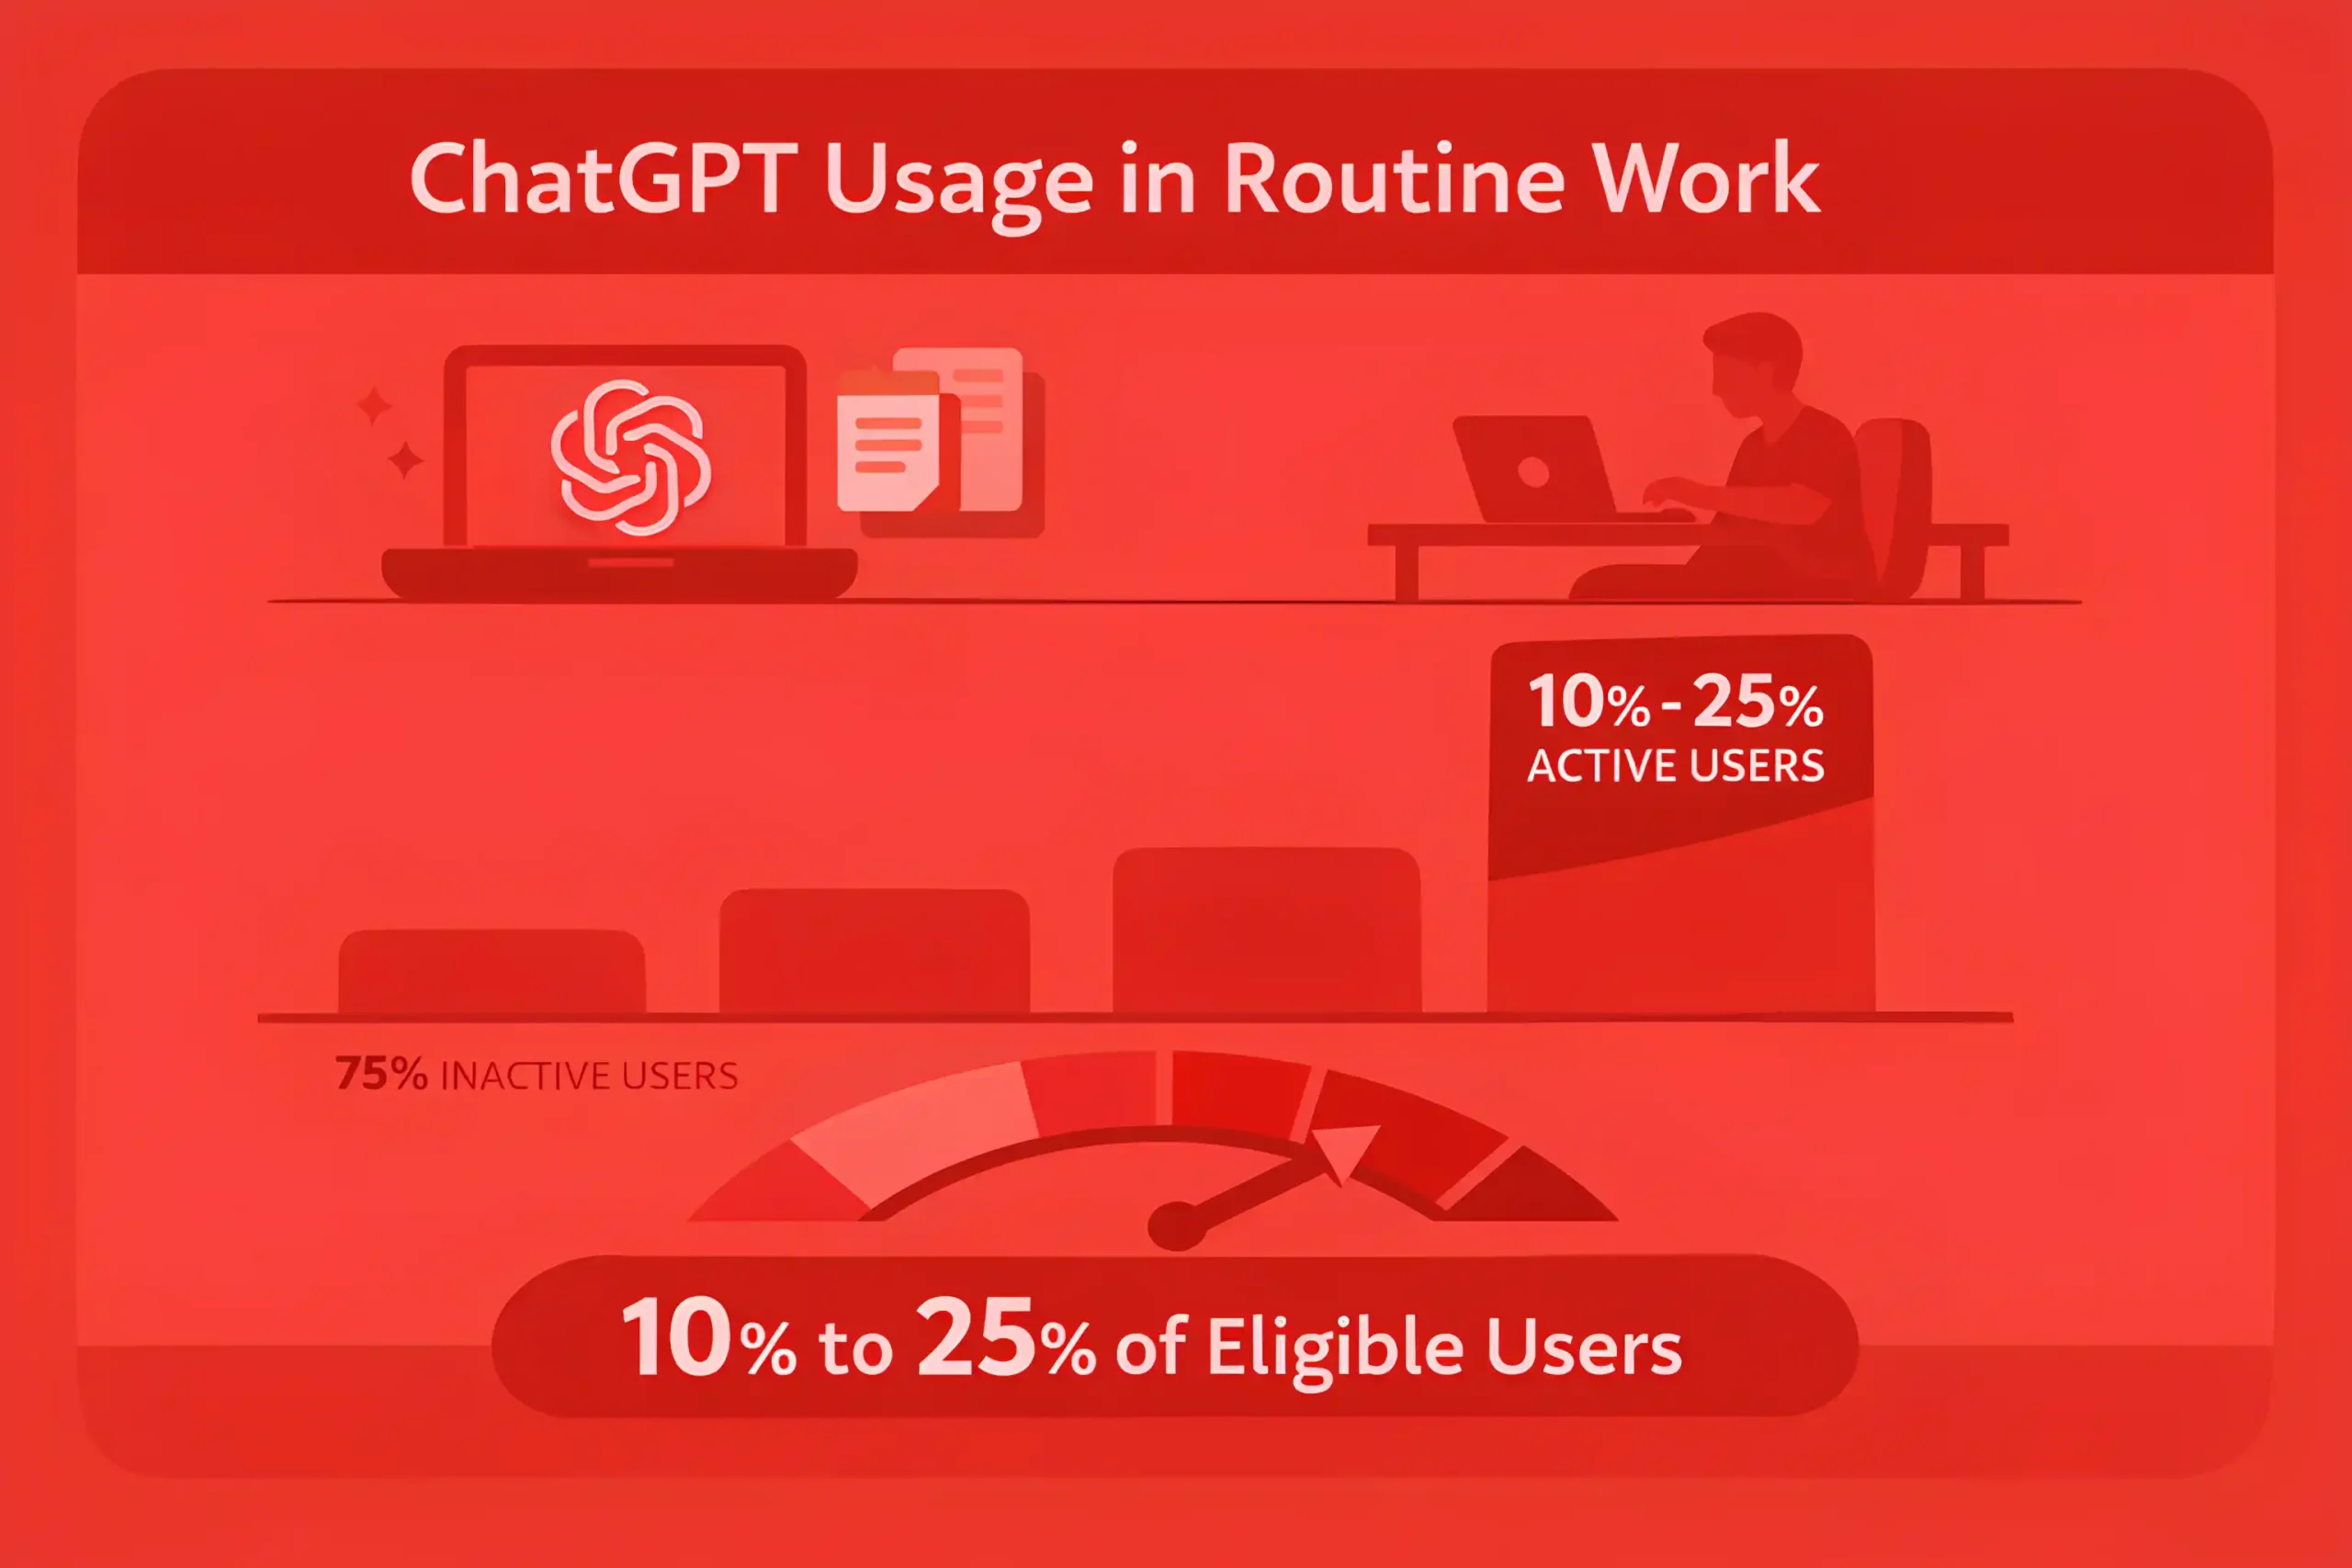
Daily usage usually sits around 10% to 25% of eligible users when ChatGPT is part of routine work.
Early adoption often starts with individuals, then moves to shared team workflows over 6 to 12 weeks.
Retention is typically uneven, with 20% to 40% of new users dropping to infrequent use after the first month without a clear job to do.
Power users often represent 10% to 20% of accounts but generate 50% to 70% of total prompts.
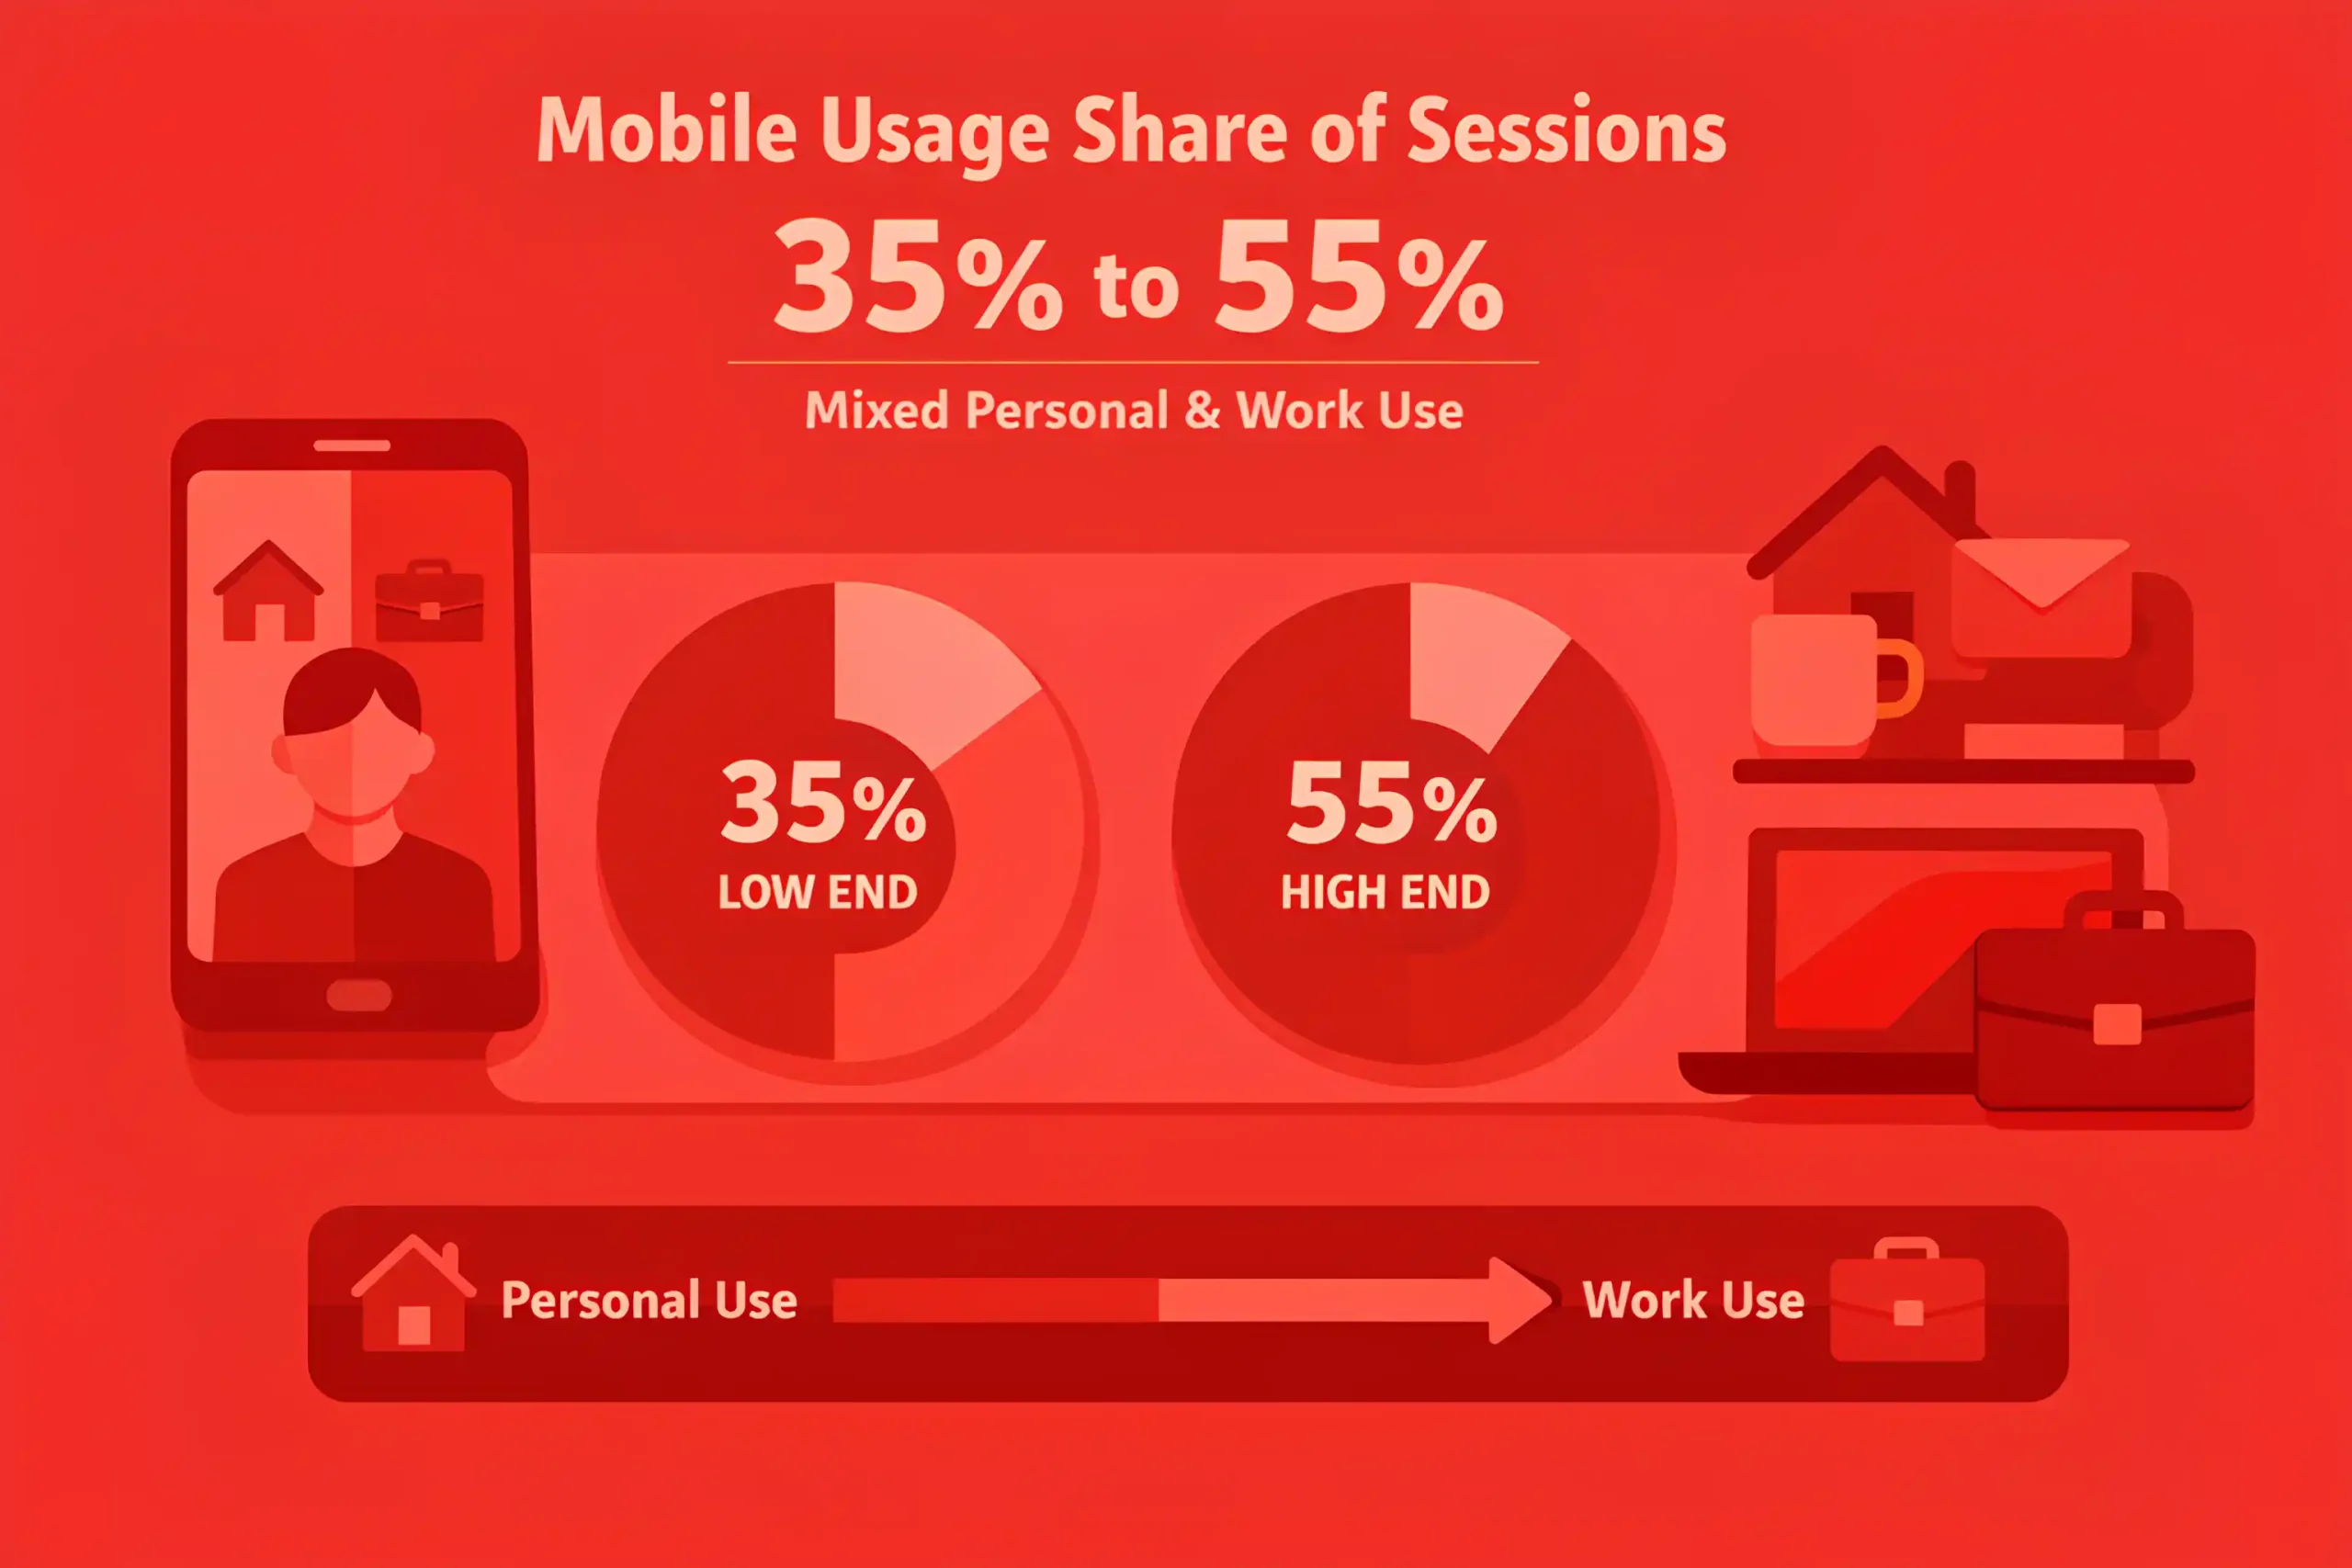
Mobile usage share often grows over time, commonly reaching 35% to 55% of sessions for mixed personal and work use.
Desktop still dominates longer work sessions, and many teams see 55% to 75% of high-intent tasks start on desktop.
Peak usage often follows major product launches and news cycles, with weekly activity spikes of 15% to 40%.
Organisations that publish clear guidelines often see active usage rise 10% to 25% compared to ad hoc adoption.
Teams that standardise prompt patterns and review steps often reduce rework by 10% to 25% and keep usage steady.
In regulated industries, adoption tends to lag, often running 10% to 30% lower until governance is clear.
The most common entry tasks are drafting, rewriting, summarising, and research support, often covering 60% to 80% of initial usage.
Deeper workflows, like analysis, planning, and automation of adjacent tasks, usually expand after 4 to 8 weeks of consistent use.
When leaders treat ChatGPT as a productivity layer rather than a novelty, output capacity often rises 10% to 30% without headcount growth, particularly inside disciplined enterprise SEO.
User growth is often stepwise, with periods of plateau followed by rapid expansion after new capabilities ship.
The strongest growth signal is repeated weekly use across multiple tasks, often 3 to 6 distinct use cases per active user, which mirrors the compounding effect seen in mature SEO services.
Related article: 100+ B2B SEO Statistics
Engagement & Usage Behavior (Sessions, Time Spent, Frequency)
Weekly active users often run 2 to 6 sessions per week, with power users reaching 10 to 25.
Daily active users commonly open 1 to 3 sessions per day on workdays.
A typical session includes 4 to 12 prompts, while complex tasks can push 15 to 40 prompts.
Median time per session often lands around 3 to 10 minutes, with long work sessions reaching 15 to 45 minutes.
Total weekly time spent per active user commonly falls in the 15 to 60 minutes range, with heavy users at 2 to 6 hours.
First message to last message lag inside a session often stays under 5 minutes, but can stretch to 20+ minutes on research tasks.
Usage frequency tends to be uneven, with the top 10% to 20% of users generating 50% to 70% of total activity.
Return rates stabilize when users have repeatable tasks, and weekly retention can improve by 10% to 25% after templates get adopted.
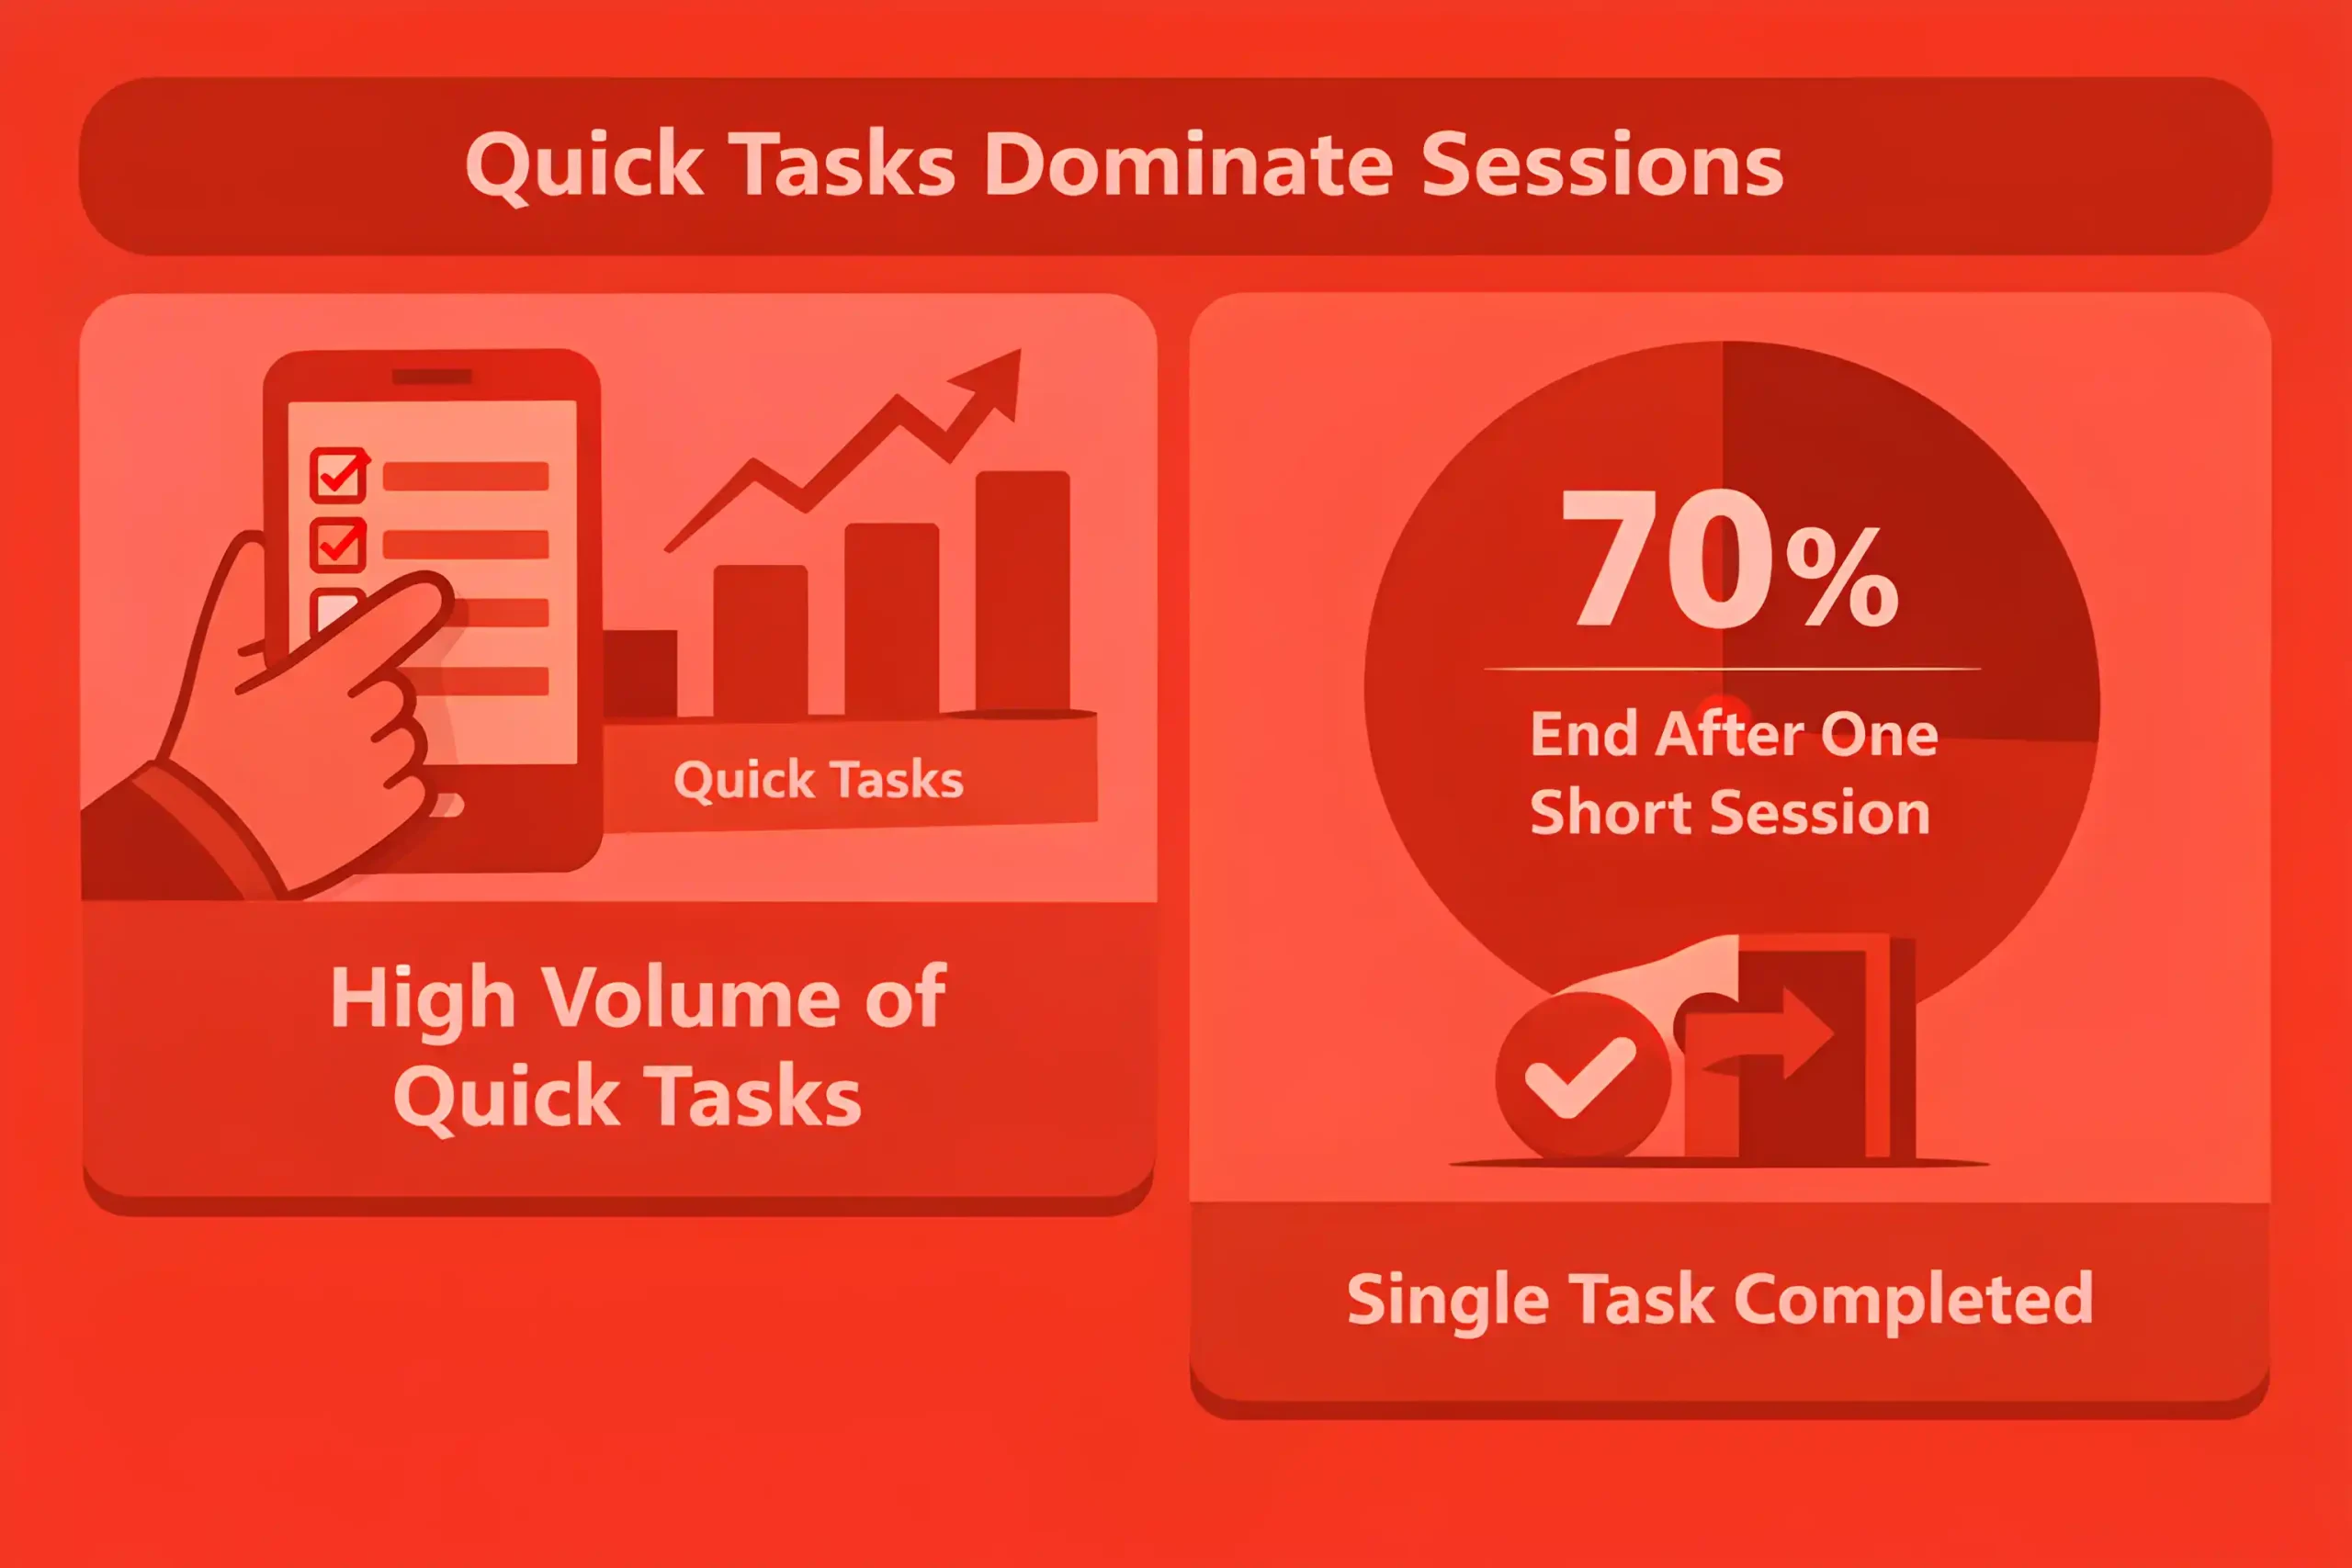
“Quick asks” dominate volume, and 60% to 80% of sessions end after a single short task is completed.
Multi-step sessions are less common but more valuable, often 20% to 40% of sessions in professional contexts.
Peak usage often clusters around morning planning and late afternoon wrap-up, with 15% to 35% swings versus midday.
Work use skews weekday heavy, and weekend activity often drops 20% to 50% for business accounts.
Copy and rewrite tasks commonly account for 30% to 55% of prompts in marketing teams, which is why AI adoption often starts inside performance marketing.
Research and synthesis tasks often represent 20% to 40% of prompts once users become comfortable.
Iteration depth increases with confidence, and average prompts per session can rise 10% to 30% after the first month.
Voice or mobile sessions tend to be shorter, often 20% to 40% lower in prompt count than desktop sessions.
Sessions tied to a defined workflow usually complete faster, cutting time to outcome by 15% to 35%.
Error correction and rework often absorb 10% to 25% of session time when inputs are vague.
When users save prompts or build a playbook, repeated tasks often become 25% to 50% faster over time, reinforcing the value of systemized enterprise website development.
Read also: 100+ Digital PR Statistics
Who Uses ChatGPT (Demographics, Regions, Devices)
Usage tends to skew younger, with the highest regular use commonly in the 18 to 34 range.
Adoption among mid-career professionals is often strong as well, usually 25 to 45, once workplace use is normalized.
Older age groups show lower routine use, but the fastest growth often comes after guided onboarding, typically 10% to 25% lift.
Knowledge work roles usually lead adoption, with marketing, product, ops, and engineering often landing 1.5x to 3x higher than the average worker.
Students and early career users often show the highest experimentation rates, commonly 40% to 70% monthly usage in high-access environments.
Executive usage is often lower in volume but higher in impact, with 5% to 15% using it weekly for summarizing, drafting, and decision prep.
Teams with writing \work often overindex, with usage rates 20% to 50% higher than teams with minimal documentation needs.
Regions with high English proficiency and strong SaaS penetration often show earlier adoption, commonly 10% to 30% higher than global averages.
Localized language support can shift adoption quickly, with non-English usage rising 15% to 35% after better language handling becomes visible.
Urban markets typically outpace rural markets, often by 10% to 25%, due to job mix and device access.
Mobile usage share is often 35% to 55% of sessions for mixed personal and work use, reinforcing the importance of mobile app development.
Desktop still dominates long sessions, with 55% to 75% of deep work tasks starting on desktop.
App-based sessions tend to be shorter, often 20% to 40% lower in prompt count than web sessions.
Cross-device behavior is common, with 30% to 60% of active users switching between phone and desktop in the same week.
iOS often overindexes on app usage, while Android can lead in reach in many regions, with splits commonly moving 10 to 20 points by market.
Workplace usage is often based on the browser, with 60% to 85% of sessions coming from web in teams that do most work on laptops.
Evening and weekend usage skews more mobile, with mobile share rising 10% to 25% outside business hours.
Users who rely on voice features tend to be a smaller segment, often 5% to 15%, but they can be frequent users for quick tasks.
Multilingual users are common in international markets, and 10% to 30% of sessions can include mixed language prompts.
Useful to know: 100+ Reputation Management Statistics
How ChatGPT Is Used (Top Use Cases by Category + Industry)
Writing and editing remain the largest category, often 35% to 55% of usage across general users.
Research and summarization frequently rank second, commonly 20% to 40% of usage, once users build trust in the workflow.
Idea generation and planning often make up 15% to 30%, especially for marketing, product, and founders.
Coding help commonly sits around 10% to 25% in mixed user bases, and it rises sharply inside engineering teams.
Customer support drafting and macros often represent 5% to 15% of use in companies with high ticket volume.
Sales enablement tasks, such as email drafts, objection handling, and call prep, often account for around 10% to 20% in revenue teams.
Marketing teams often spend 40% to 70% of their time on copy, campaign assets, SEO support, and repurposing.
SEO specific use cases commonly include clustering, brief creation, internal linking ideas, and snippet drafting, often 20% to 45% of prompts inside SEO roles.
Paid media teams often use it for ad variations and testing plans, and those tasks can account for 25% of prompts in performance teams.
Paid media teams often use it for ad variations and testing plans, and those tasks can account for 15% to 35% of prompts in performance teams using PPC.
Engineering teams often use it for debugging, explanation, and code generation, with 30% to 60% of prompts tied to code tasks.
Analyst and ops teams often lean on it for spreadsheet help, doc clean up, and process writing, often 20% to 40% of usage.
HR and recruiting often use it for job descriptions, interview questions, and candidate messaging, commonly 10% to 25% of prompts.
Legal and compliance use tends to be lower and more controlled, often 5% to 15%, and it increases with governance.
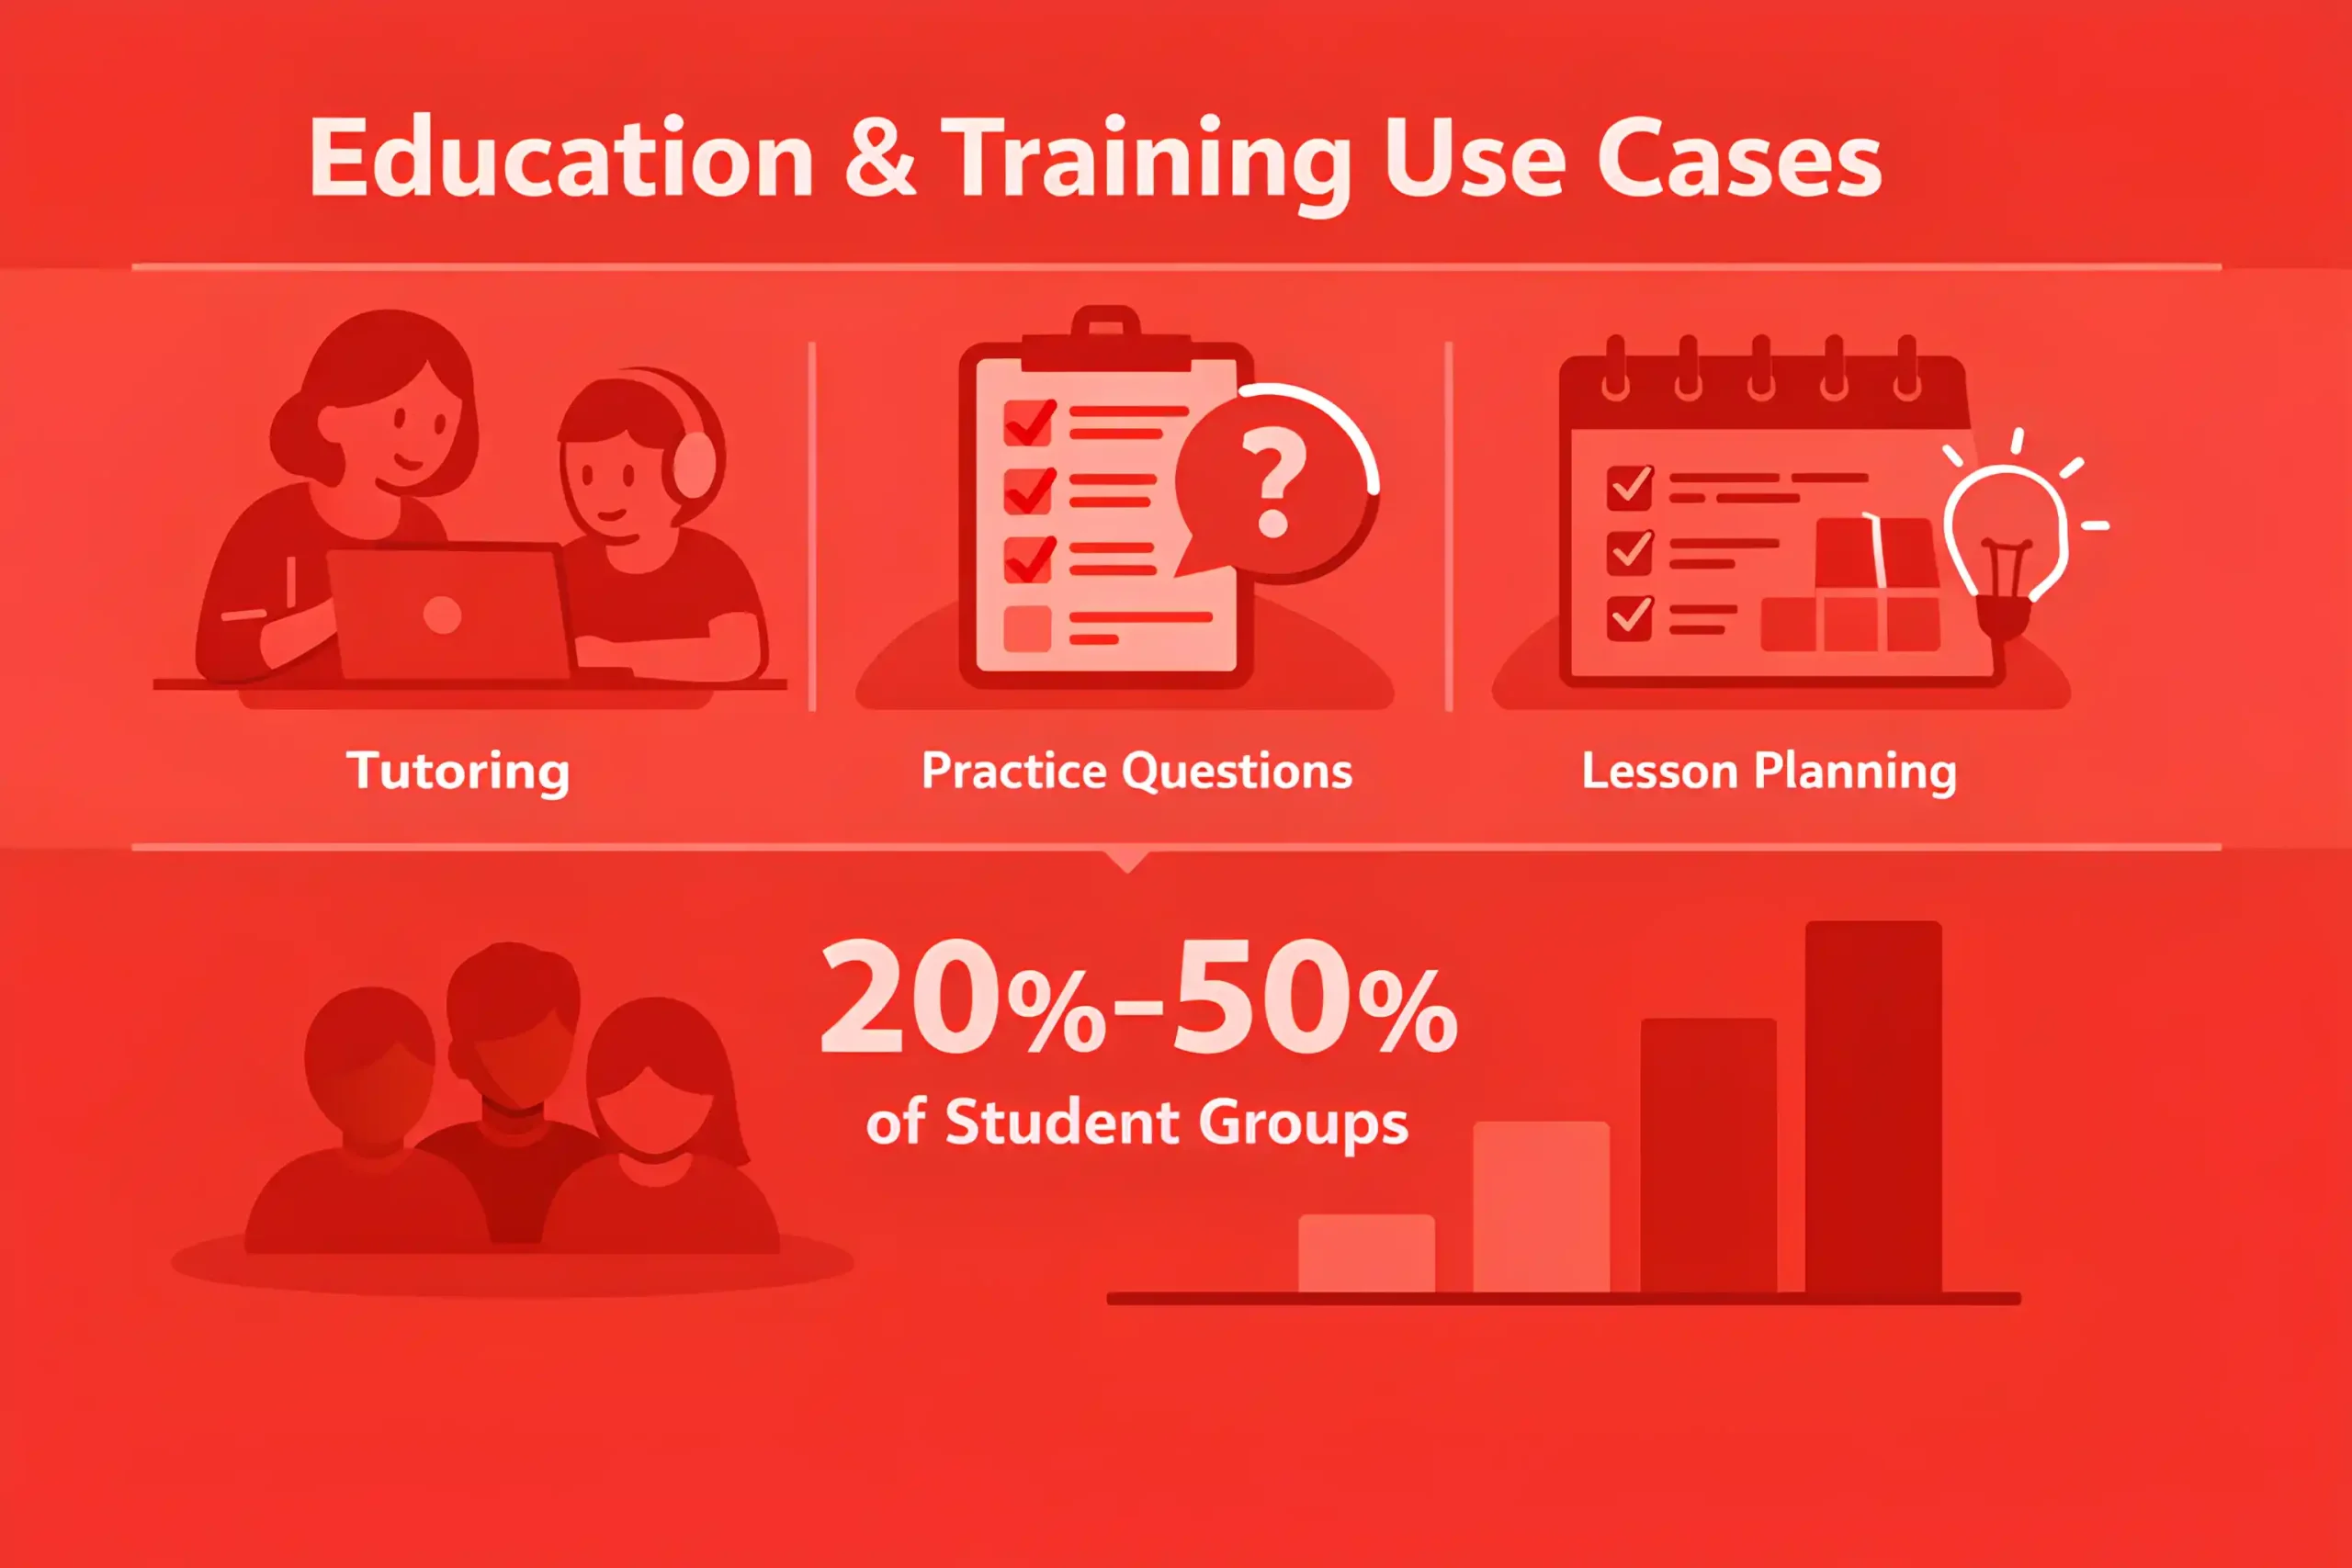
Education and training use cases often include tutoring, practice questions, and lesson planning, commonly 20% to 50% in student groups.
Healthcare admin use is often focused on documentation and comms, typically 5% to 15%, with stricter limits on sensitive content.
In e-commerce teams, common uses include product descriptions, lifecycle email copy, and FAQ drafting, often 20% to 45% of usage tied to e-commerce optimization.
In agencies, usage often concentrates on first drafts and variation work, with 25% to 50% time savings reported when review is structured.
Across industries, the biggest impact shows up in repeatable tasks, where output volume can rise 10% to 30% without adding headcount.
Most teams see quality gains later than speed gains, and measurable improvement usually appears after 4 to 8 weeks of consistent review and prompts.
Business Impact & Market Numbers (Productivity, ROI, Spend, Competition)
Time saved on drafting and rewriting often lands around 20% to 50% per asset once prompts and review standards are consistent.
Research and synthesis time savings commonly sit in the 15% to 35% range, depending on accuracy requirements.
Teams with repeatable workflows often increase output 10% to 30% without adding headcount.
Quality improvements usually arrive after speed gains, with measurable lift often taking 4 to 10 weeks of steady use.
Rework tends to drop 10% to 25% once examples, templates, and review steps are standardized.
Productivity ROI is most reliable when tied to hours replaced, with payback windows often 30 to 90 days for mature teams.
Per-seat costs frequently cluster around $20 to $80 per month for standard plans, with enterprise controls pushing higher.
The total annual spend typically ranges between $5,000 and $50,000 for small and mid-sized teams adopting itbroadly.
Larger organizations often move into $50,000 to $250,000 annual ranges once governance and integrations are included.
Governance and QA add overhead, commonly 5% to 15% of workflow time, but reduce costly mistakes.
Teams that skip guardrails often lose 20% to 40% of the time saved through rework, fixes, and approval churn.
Marketing and content teams often see the biggest gains, with cycle time reductions of 20% to 45% on repeatable assets.
Support teams using assisted drafting and macros often reduce handle time 10% to 25% on routine tickets.
Sales teams using it for email variants and call prep often increase activity volume 10% to 30% with similar staffing.
Experiment velocity often rises 15% to 40% when variations and test plans are generated faster, a discipline closely tied to ongoing CRO.
In competitive markets, adoption gaps matter, and teams with high usage often ship 1.2x to 2x more iterations per quarter than low usage teams.
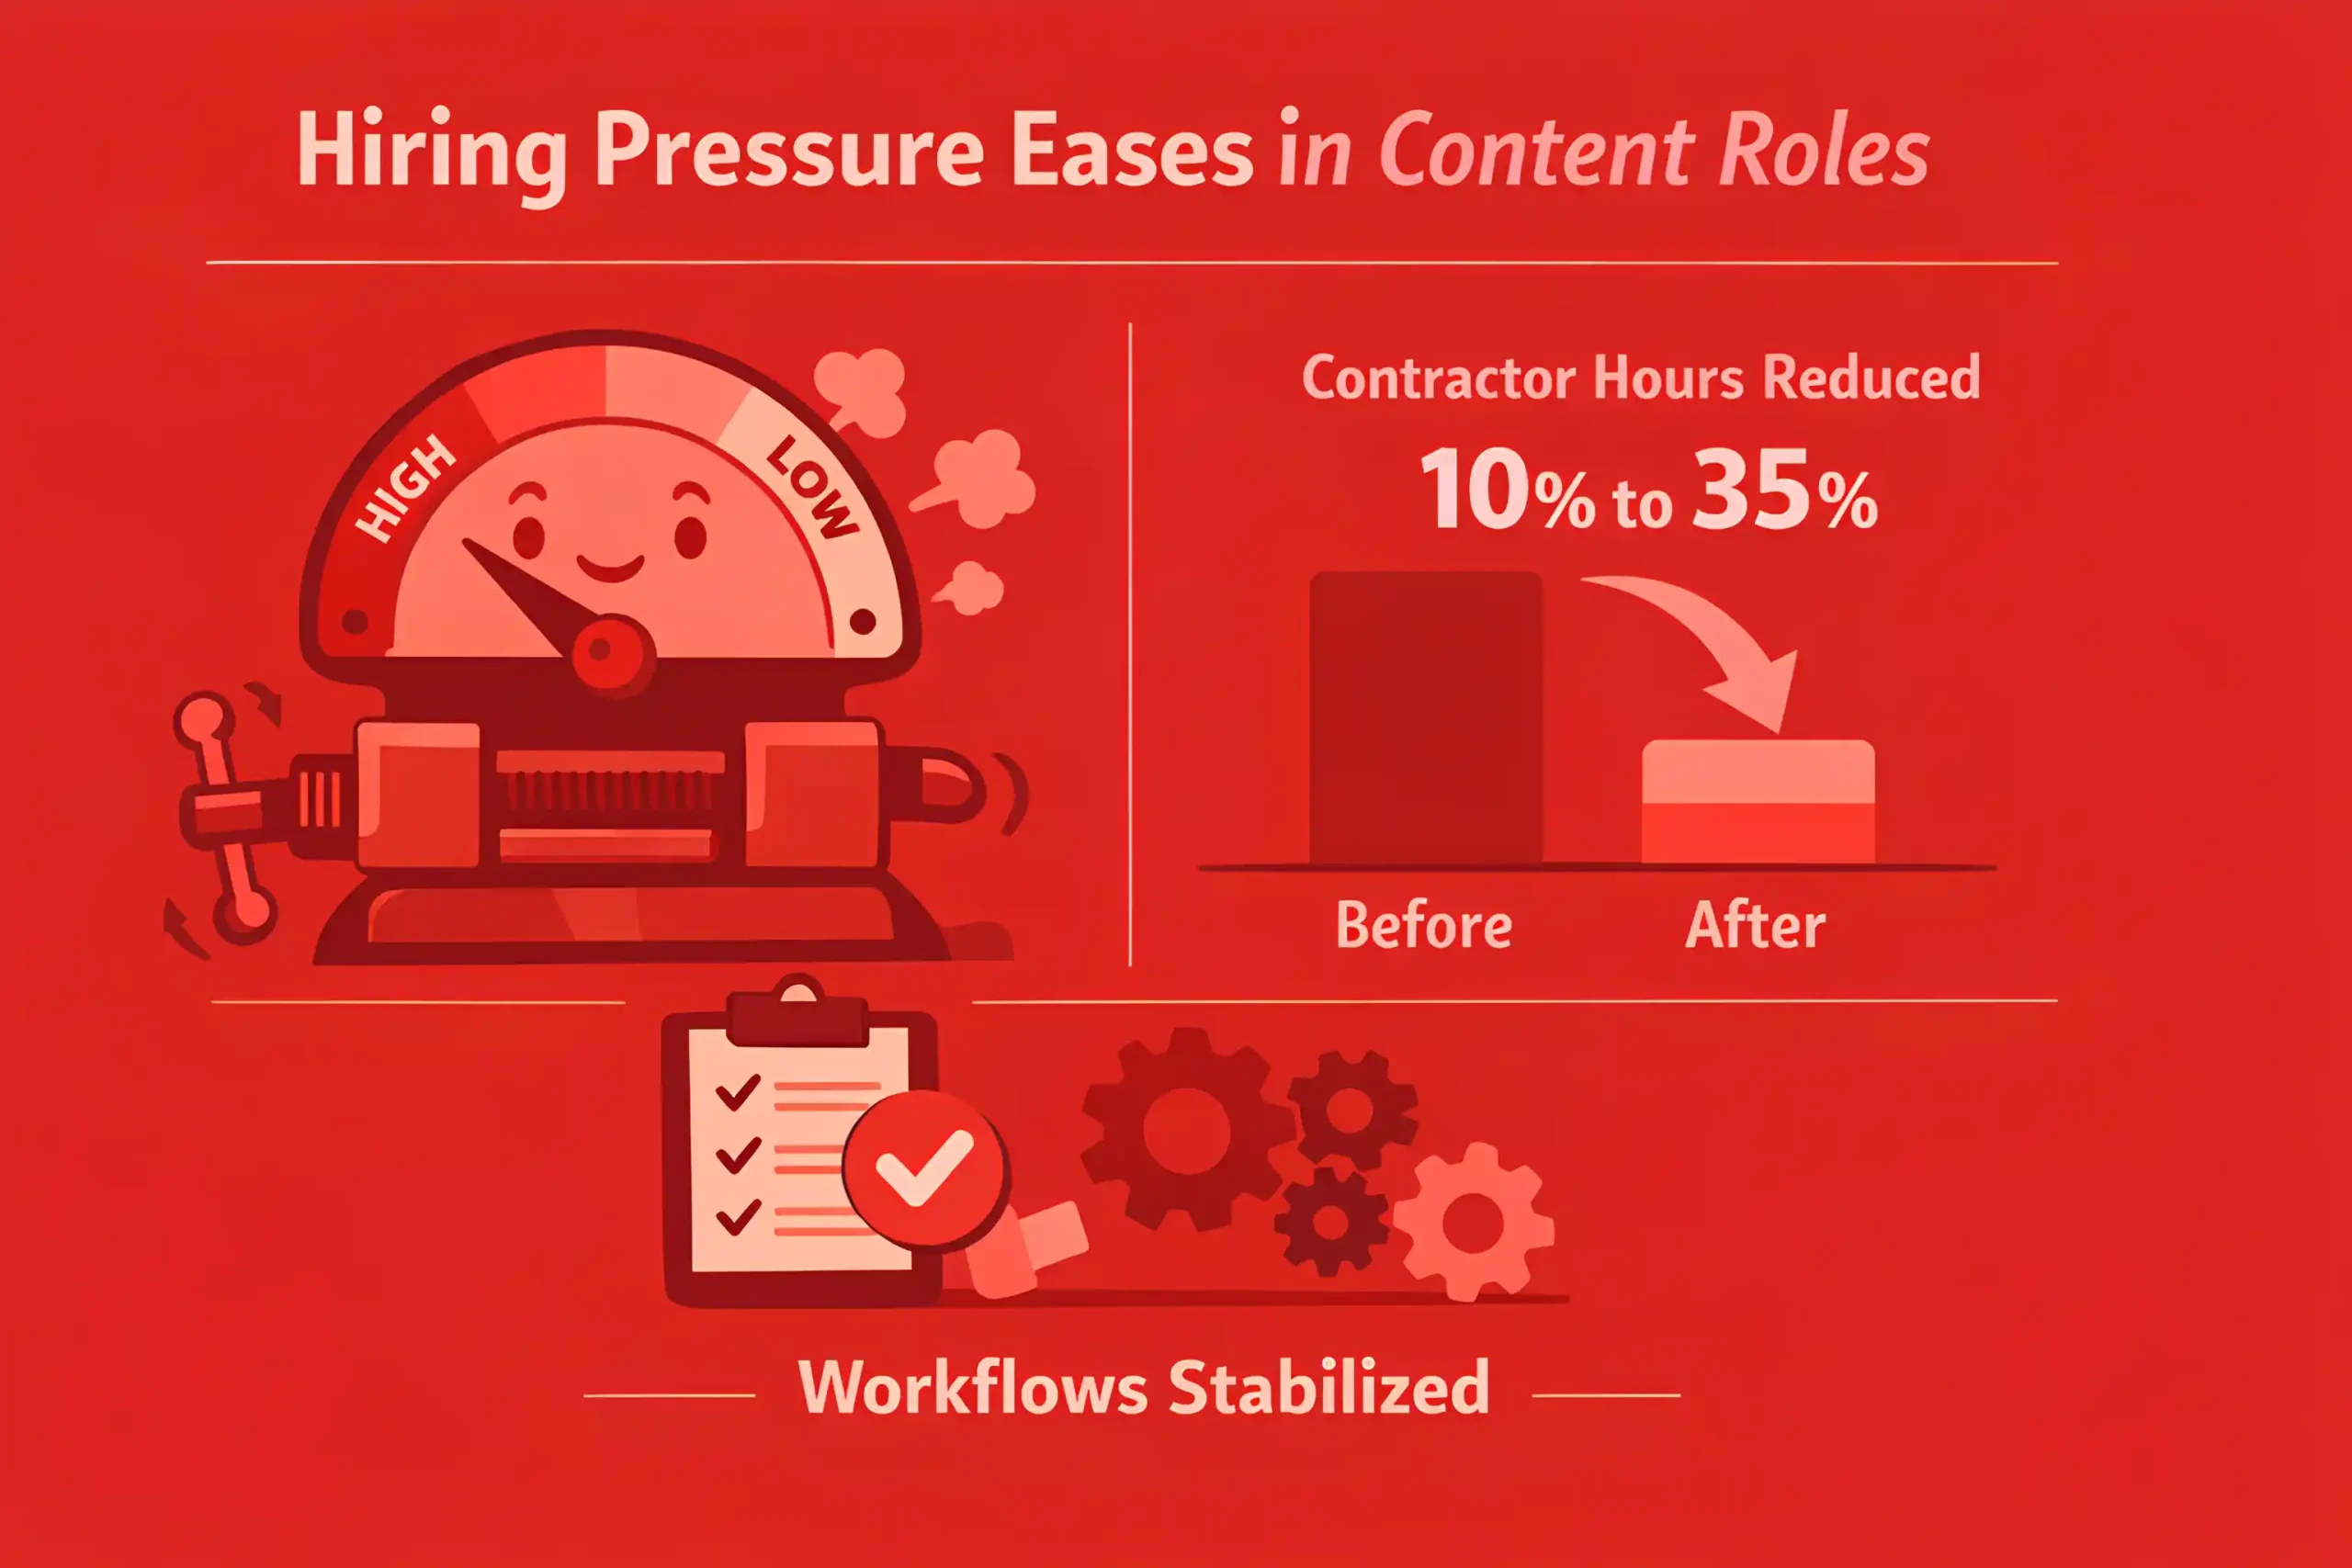
Hiring pressure can soften in content functions, with contractor hours reduced 10% to 35% after workflows stabilize.
Don’t miss out: 100+ Content Marketing Statistics
The Key Takeaways
ChatGPT looks great on simple tasks. Then reality hits with vague briefs, tricky edge cases, brand voice, and accuracy. If the process is copy-paste and hope, the time saved gets eaten by edits, and people stop using it.
Teams that get value keep it structured. They tighten inputs, reuse the same prompt templates for repeat work, and keep strict review on anything else. After a few weeks, output becomes more consistent and rework drops.
The benchmarks in our guide help keep such expectations realistic. They put productivity gains in context, support spend planning, and display how quickly the competitive bar is moving.


