Most eCommerce revenue leaks inside the search bar. A shopper types a product, gets poor matches or empty results, and leaves with intent still high. Site search is a direct window into buyer language, urgency, and objections, far cleaner than broad traffic metrics.
NEWMEDIA.COM put together more than 100 e-commerce site search benchmarks across query intent, zero result patterns, filter usage, merchandising impact, and conversion behavior.
Use the numbers to tighten taxonomy and synonyms, remove dead ends, improve results pages and filters, and set clearer KPIs for search, UX, and merchandising teams. When site search works, it shortens the path from curiosity to purchase.
Site Search Usage & Adoption (How Many Shoppers Use It)
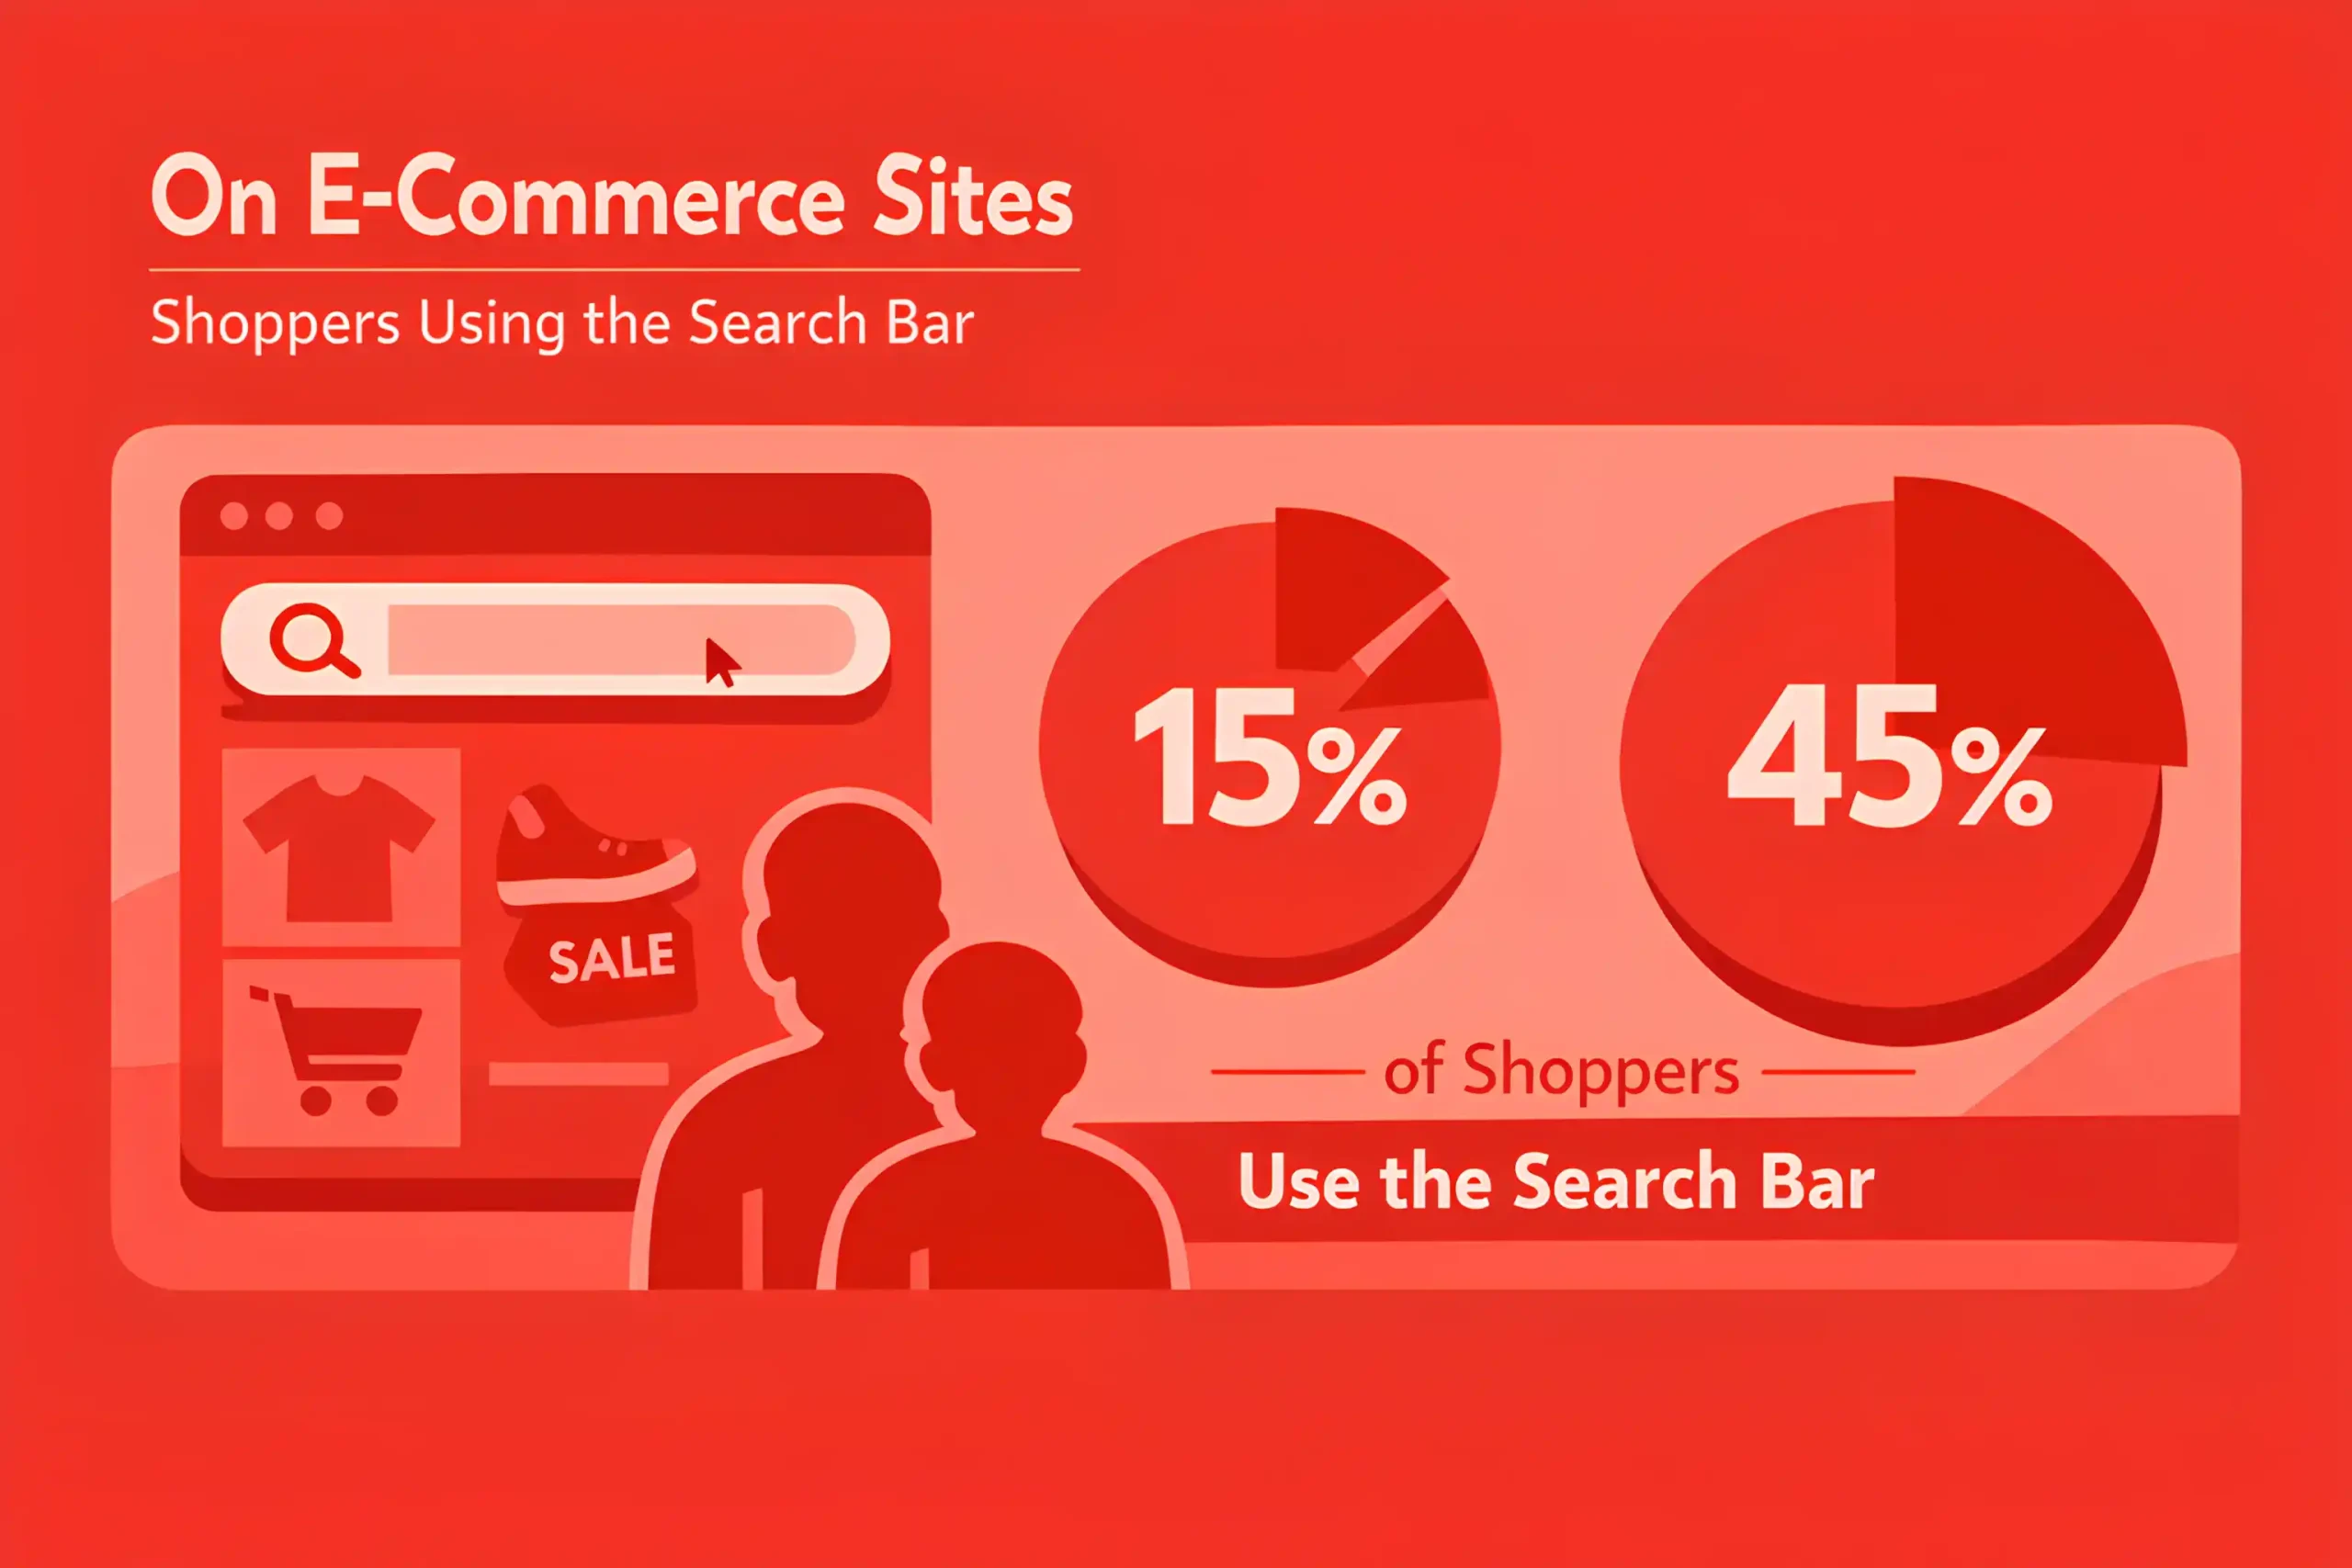
On e-commerce sites, 15% to 45% of shoppers use the search bar during a session, which makes CRO a direct lever for turning intent into revenue
On large catalogs, search usage often rises to 25% to 60% because navigation alone feels slow.
Mobile sessions tend to show lower search usage, often 10% to 30%, but higher reliance once shoppers know what they want, which is why responsive web design and mobile UX details matter more than most teams expect.
Repeat customers use search more often, with usage rates 10% to 25% higher than those of first-time visitors.
High intent visitors, from email or direct traffic, are more likely to search, often 1.2x to 2x higher than social traffic, which also changes how you prioritize landing pages inside e-commerce PPC.
During peak shopping periods, search usage often increases 5% to 15% as shoppers move faster.
Search users typically view fewer pages but act with more intent, often reducing browsing steps by 20% to 40%.
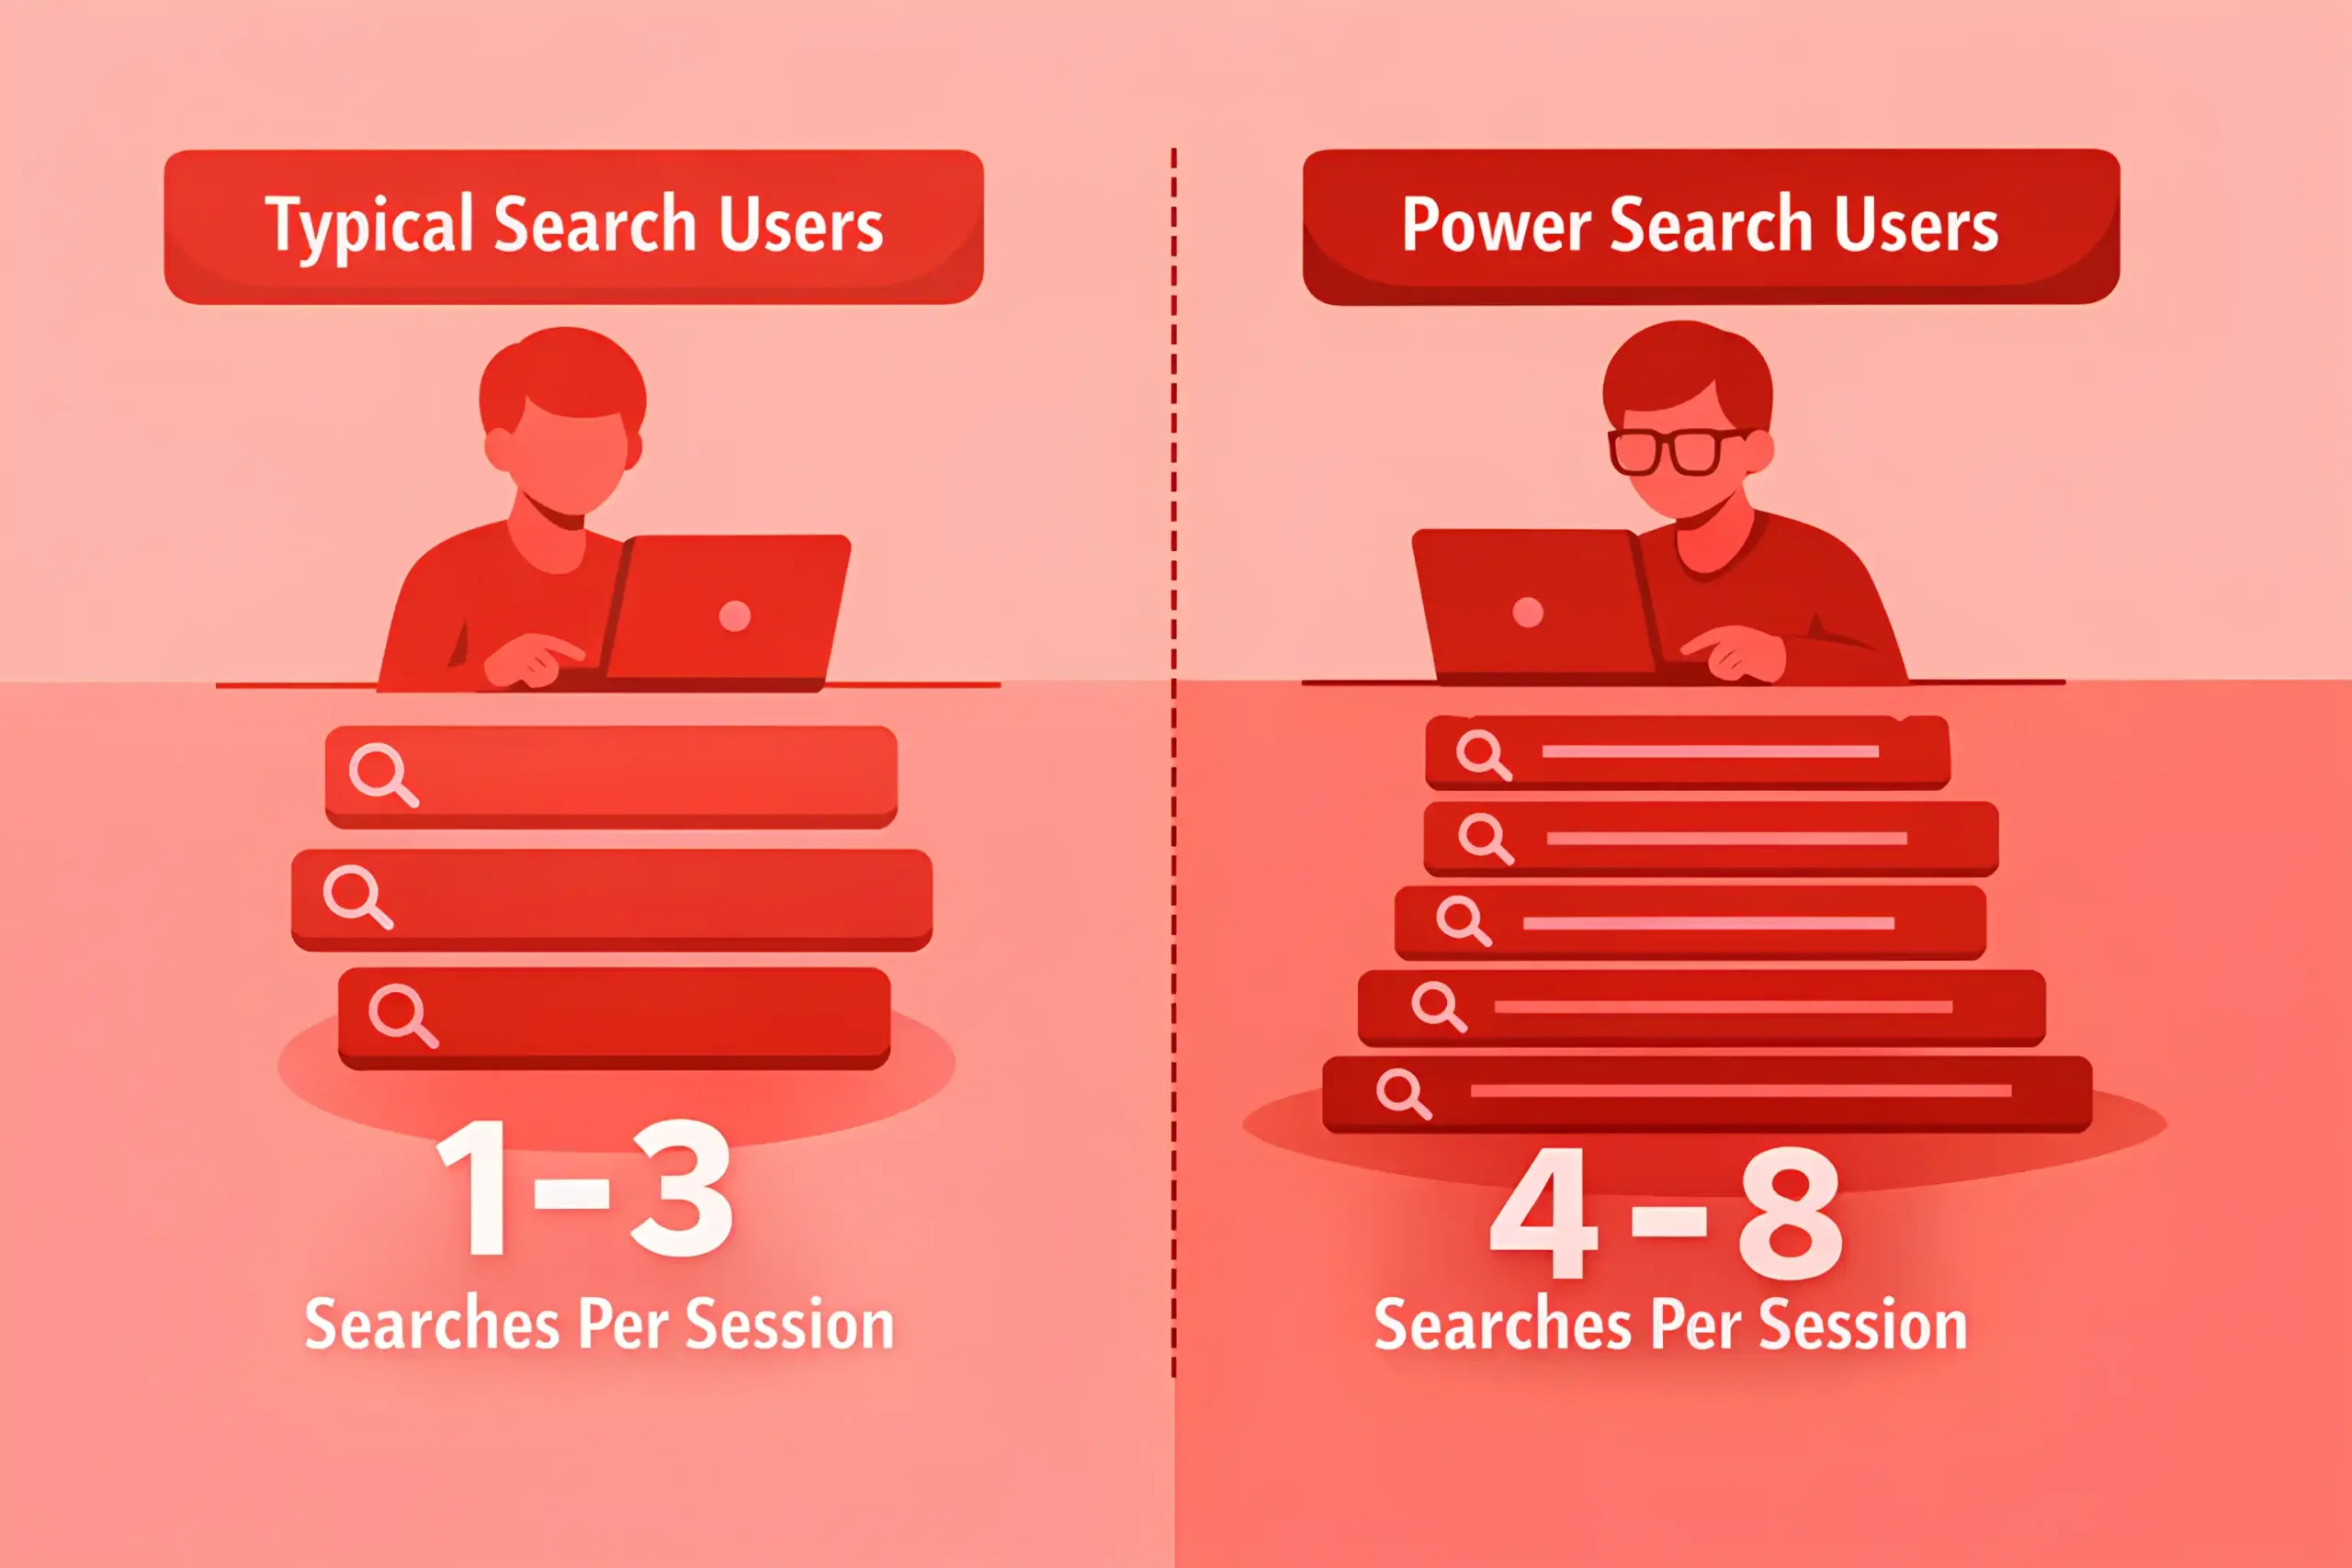
A typical search user runs 1 to 3 searches per session, while power users run 4 to 8.
Refinement behavior is common, and 20% to 45% of search sessions include a second query after a poor first result.
Autocomplete usage is widespread, and 40% to 70% of searchers interact with suggestions when available.
Filter usage after search is common, with 30% to 60% applying at least one filter on the results page.
Search adoption is often higher on sites with clear input placement, and moving search to a prominent position can lift usage by 5% to 15%.
Sites with weak category navigation often see higher search dependence, with search usage rising 10% to 25%.
When onsite search works well, return usage increases, and repeat searchers can grow 10% to 20% over a quarter.
In multilingual markets, search usage rises when synonym and language support improve, often by 5% to 15%.
Related article: 100+ Branding Statistics
Search Intent Signals
Product-specific queries often make up 40% to 70% of onsite searches on mature ecommerce sites.
Category queries commonly land around 20% to 45%, especially for shoppers still comparing options.
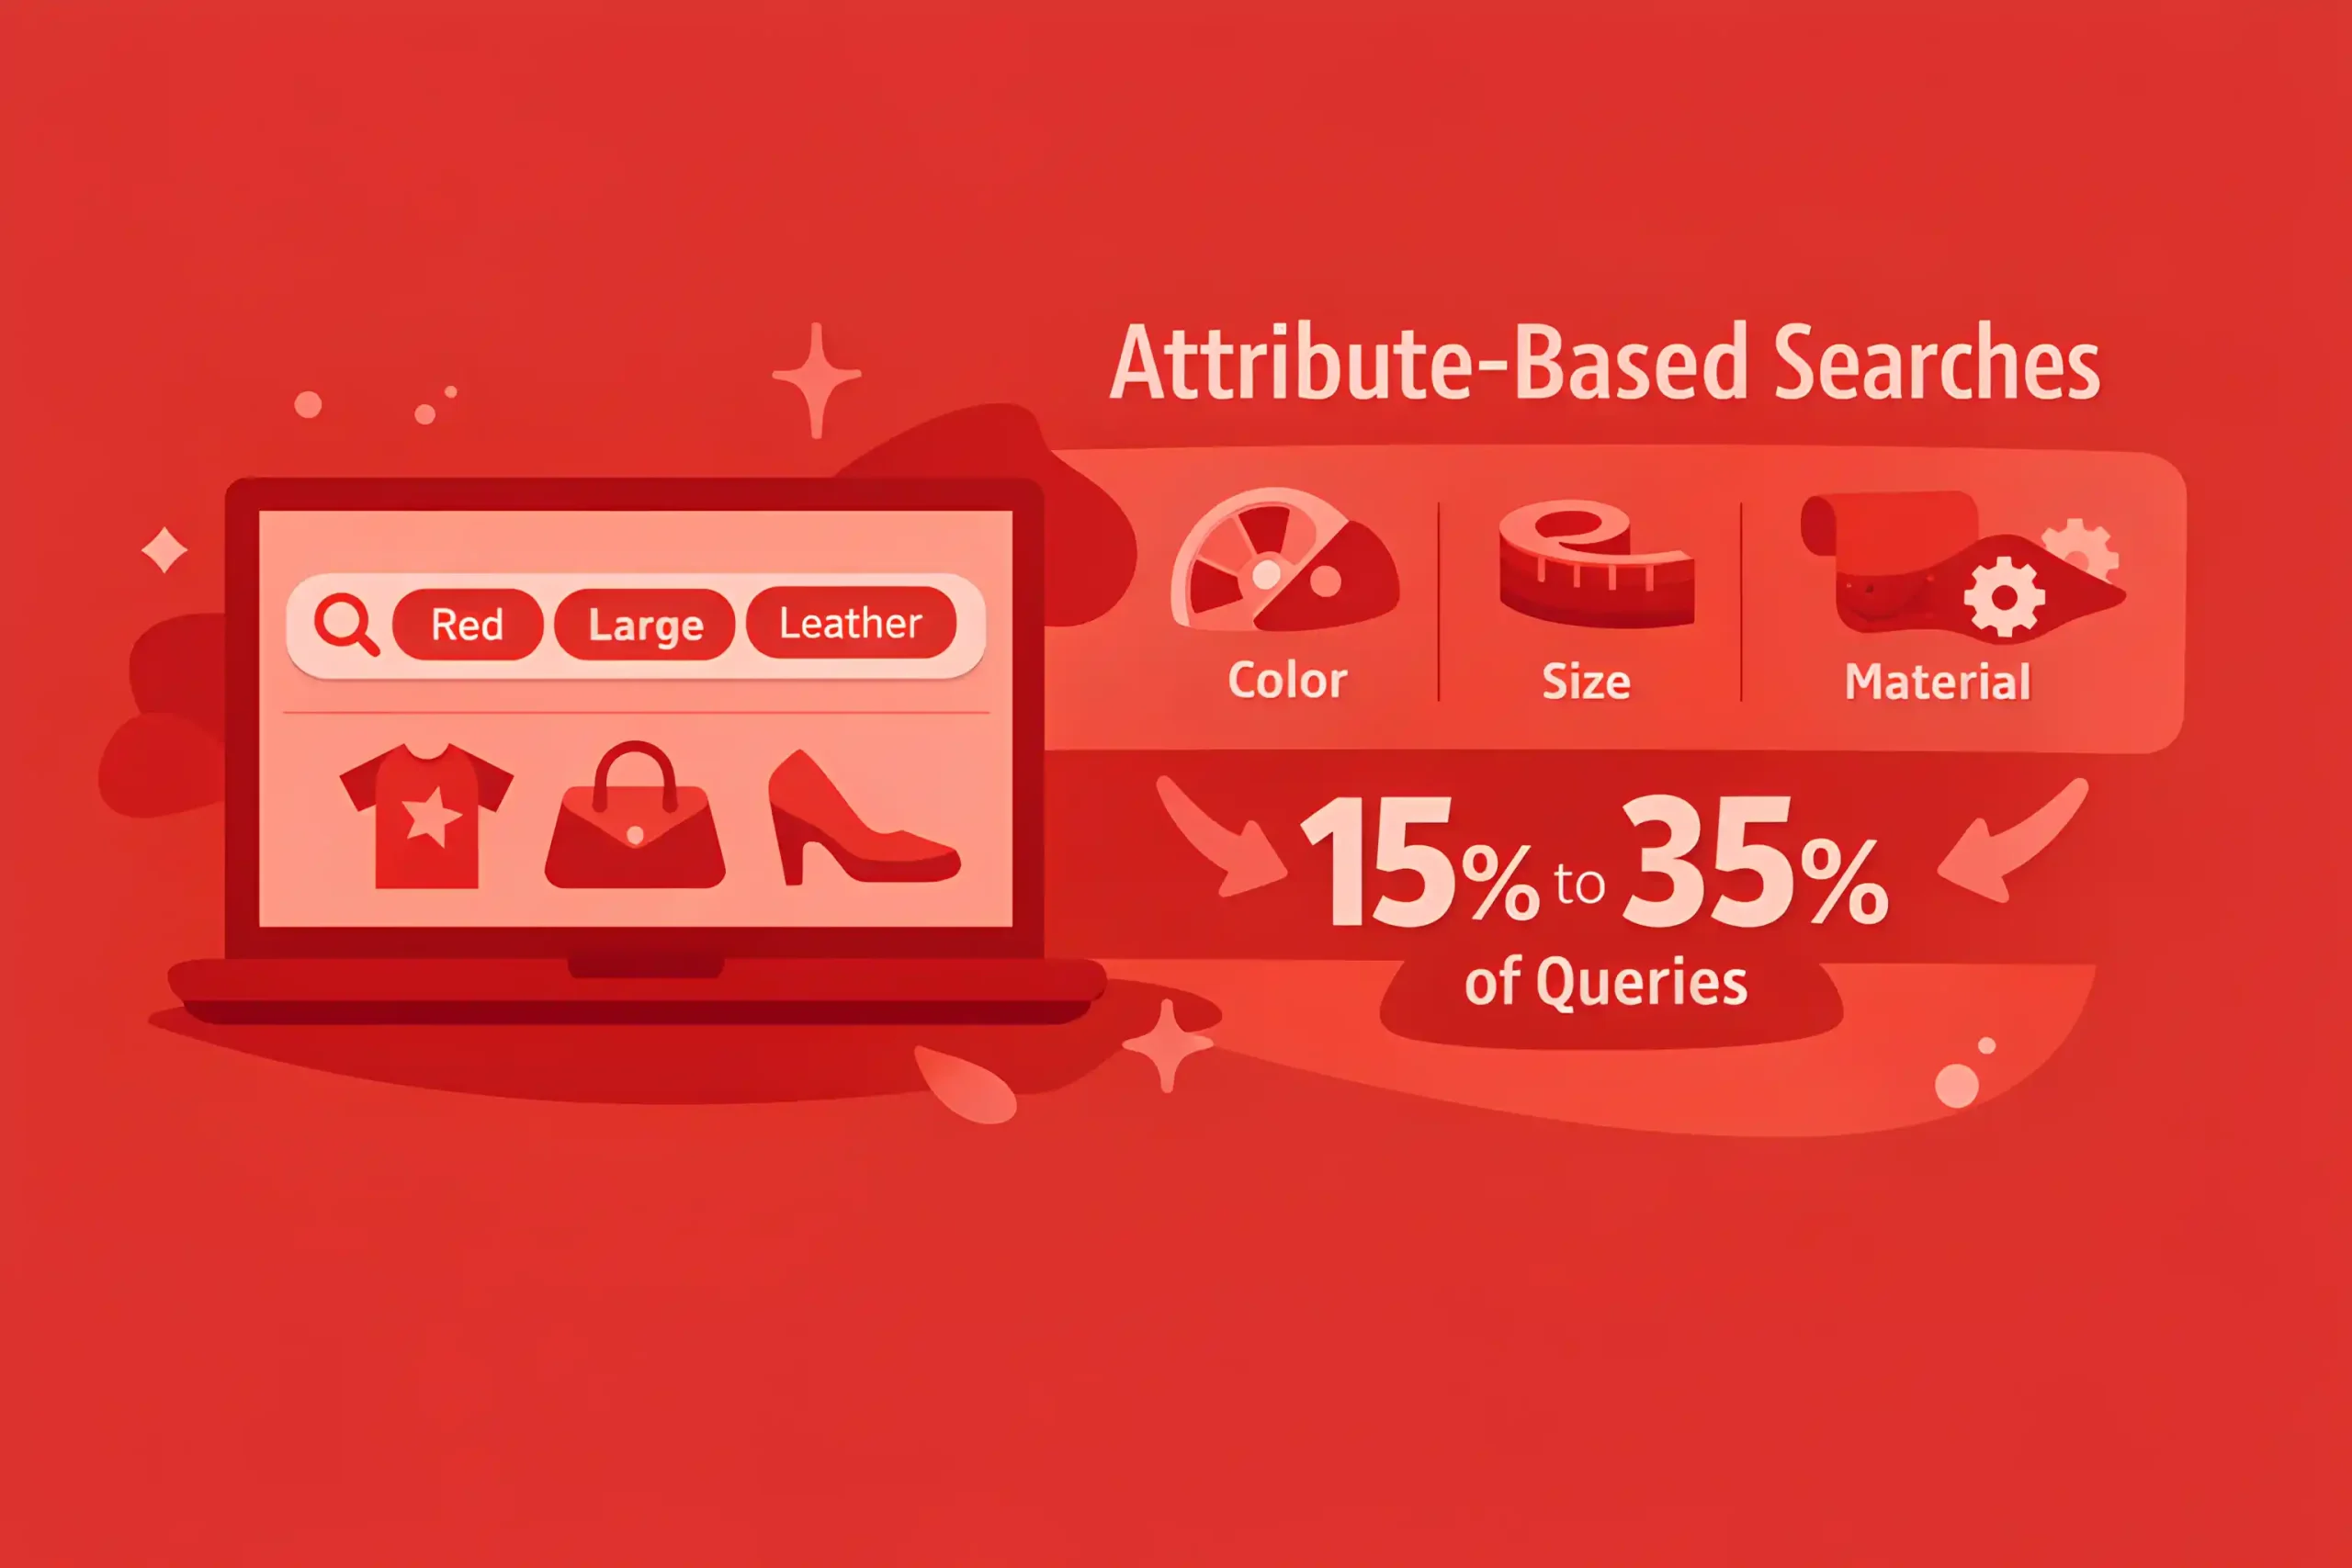
Attribute-based searches, like color, size, material, or use case, often account for 15% to 35% of queries, with well-implemented UX design.
Price-driven intent shows up frequently, and terms like “cheap,” “sale,” or “under” can represent 5% to 20% of searches in discount-sensitive categories.
Brand name queries often make up 10% to 30% of searches, depending on brand mix and loyalty.
Model number and SKU style queries are smaller in volume but high intent, commonly 2% to 10% of queries.
Longer queries correlate with stronger intent, and 3+ word searches often convert 1.2x to 2x higher than single-word searches, reinforcing the importance of structured content within SEO strategy.
Return visitors tend to search more precisely, with query length and specificity often 10% to 25% higher than those of new visitors.
Queries with urgency terms, like “today,” “next day,” or “fast,” often appear in 2% to 8% of searches but convert above average.
Searches including “gift” or occasion terms commonly show seasonal spikes of 2x to 6x during peak periods.
Plural vs singular handling matters, and weak normalization can increase refinement searches by 10% to 25%.
Misspellings are common, and 5% to 15% of queries contain a typo or variant spelling.
Synonym gaps create frustration, and missing synonyms can drive 10% to 30% of query reformulations in broad catalogs.
“Compatibility” terms, like “fits,” “works with,” or device names, often appear in 5% to 15% of queries for accessories and parts.
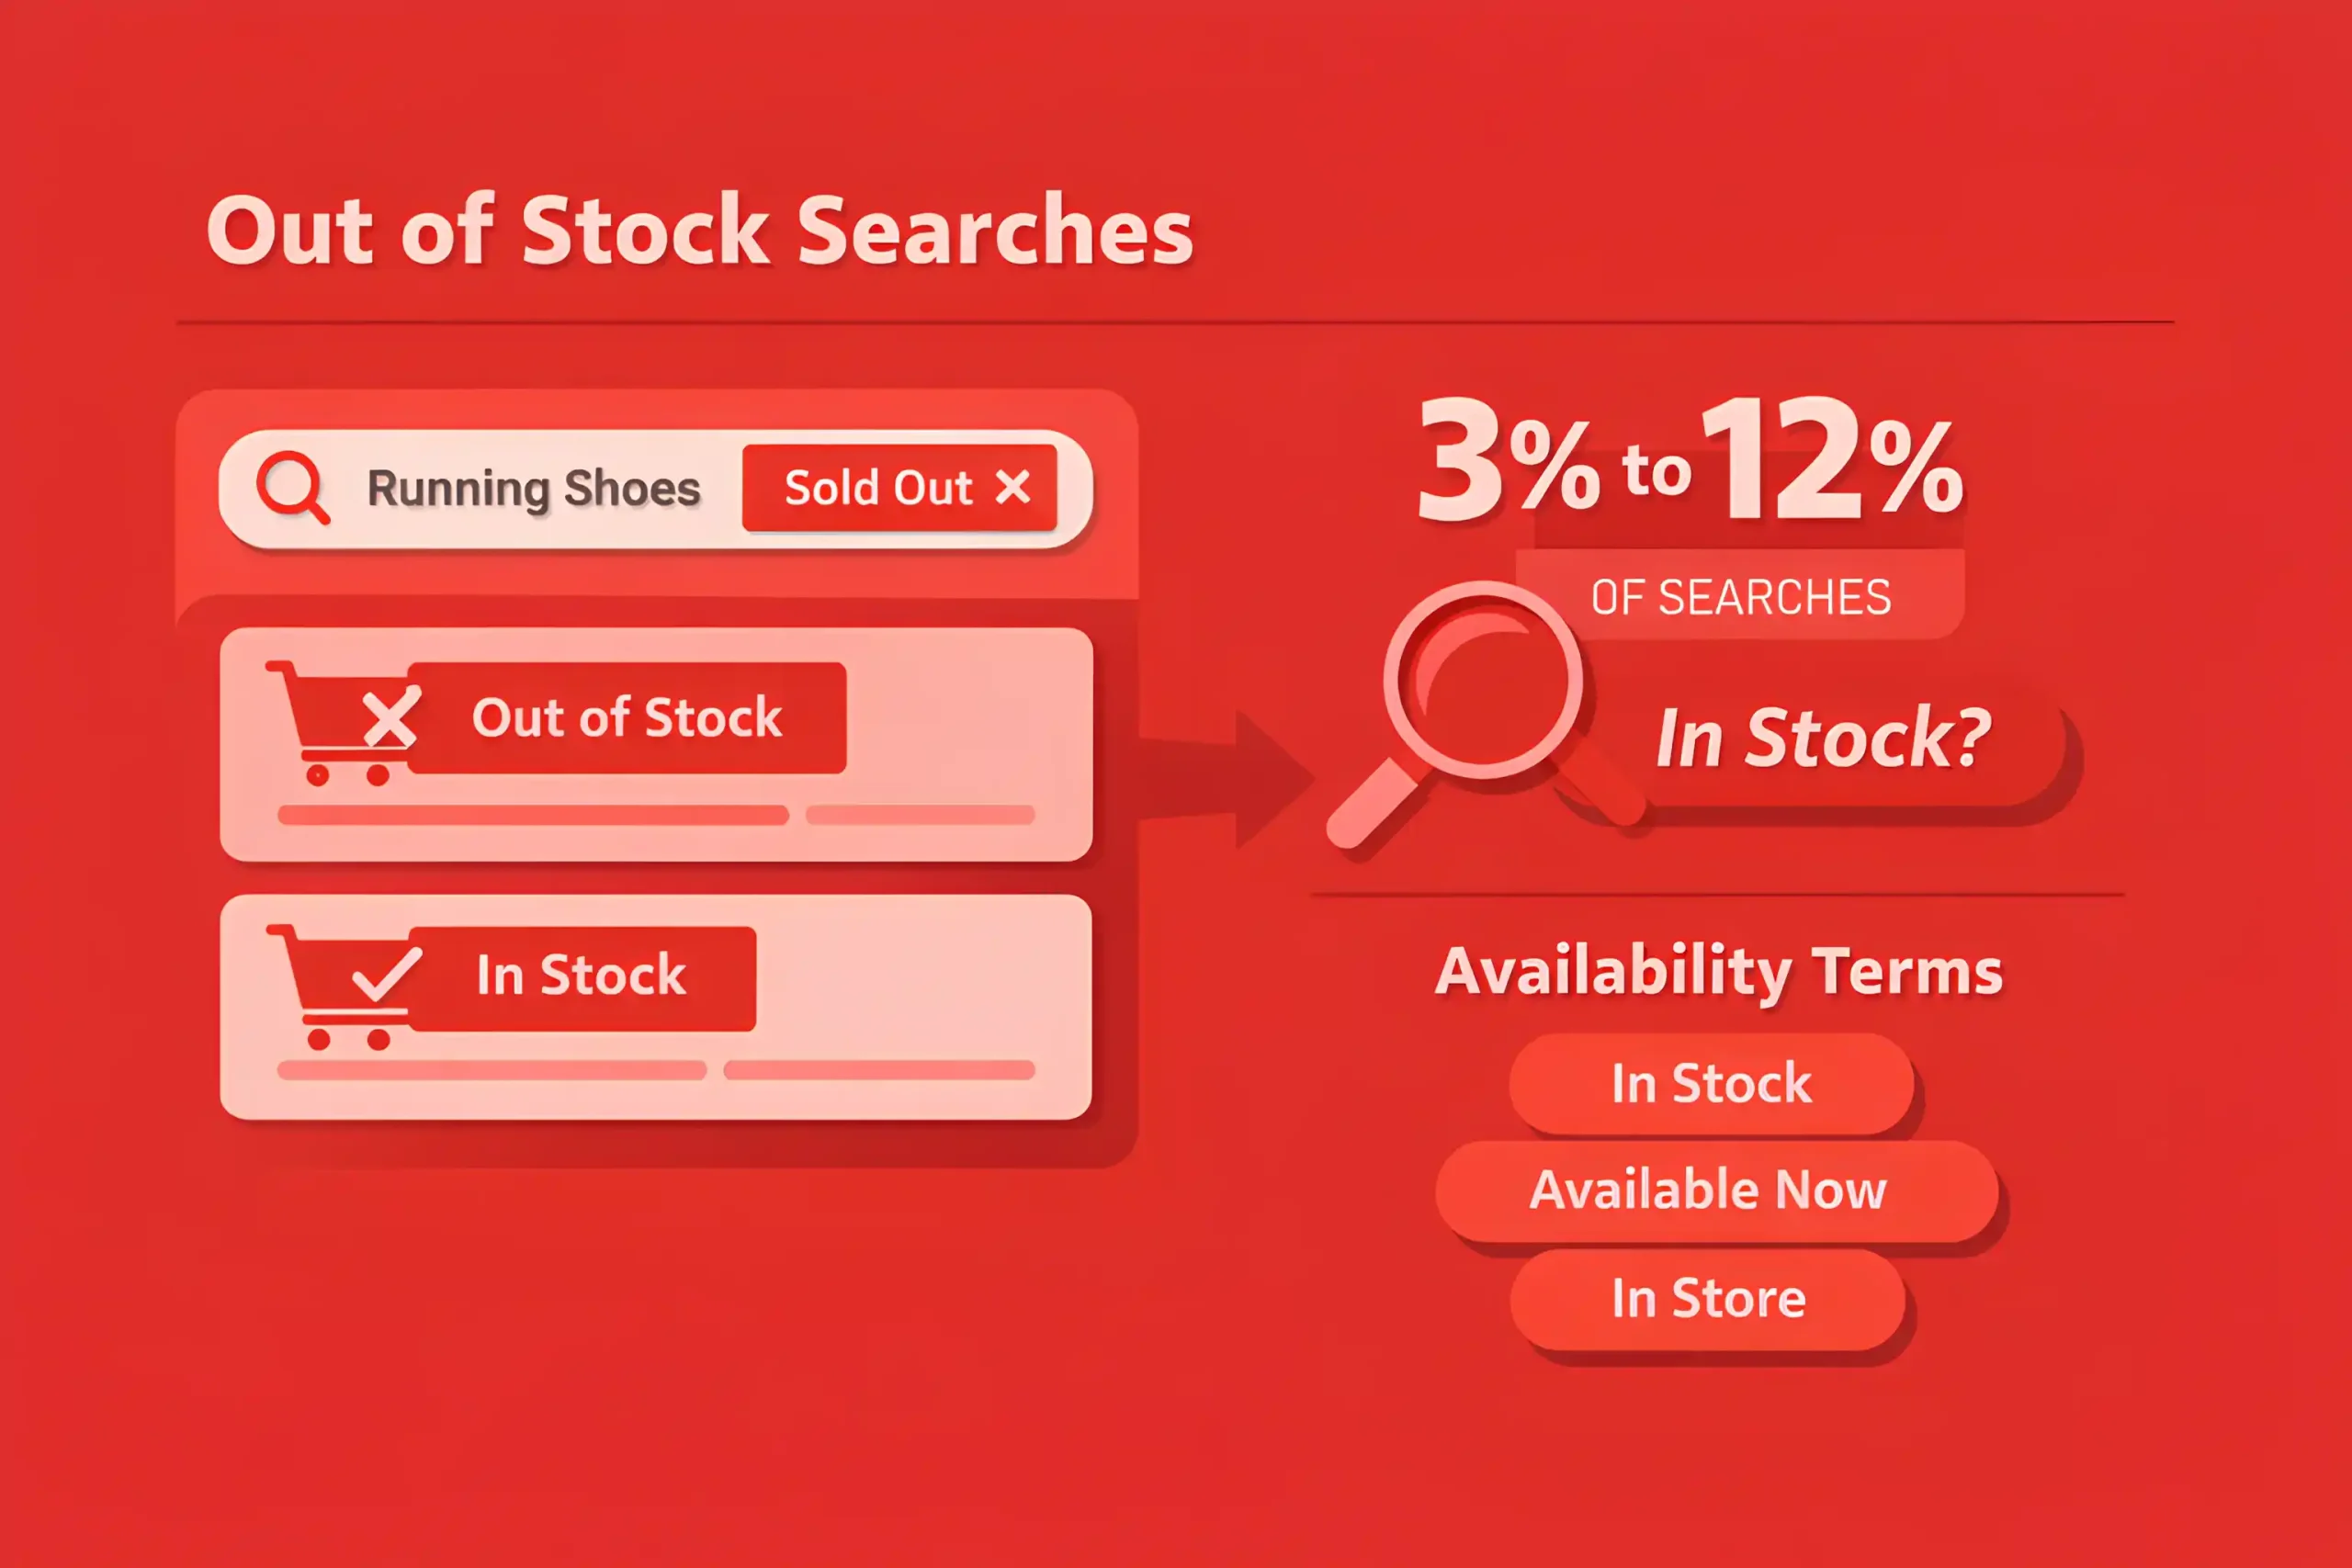
Out of stock intent shows up in searches, and 3% to 12% of queries can include “in stock” or availability phrasing.
Read also: 100+ Digital PR Statistics
Buyer Behavior After Search (Clicks, Add-to-Cart, Conversion, AOV)
Searchers usually click faster, and the time to first product click after a query often lands around 5 to 15 seconds when results are relevant.
Poor relevance slows action, and time to first click can rise to 20 to 45 seconds when shoppers scan and hesitate.
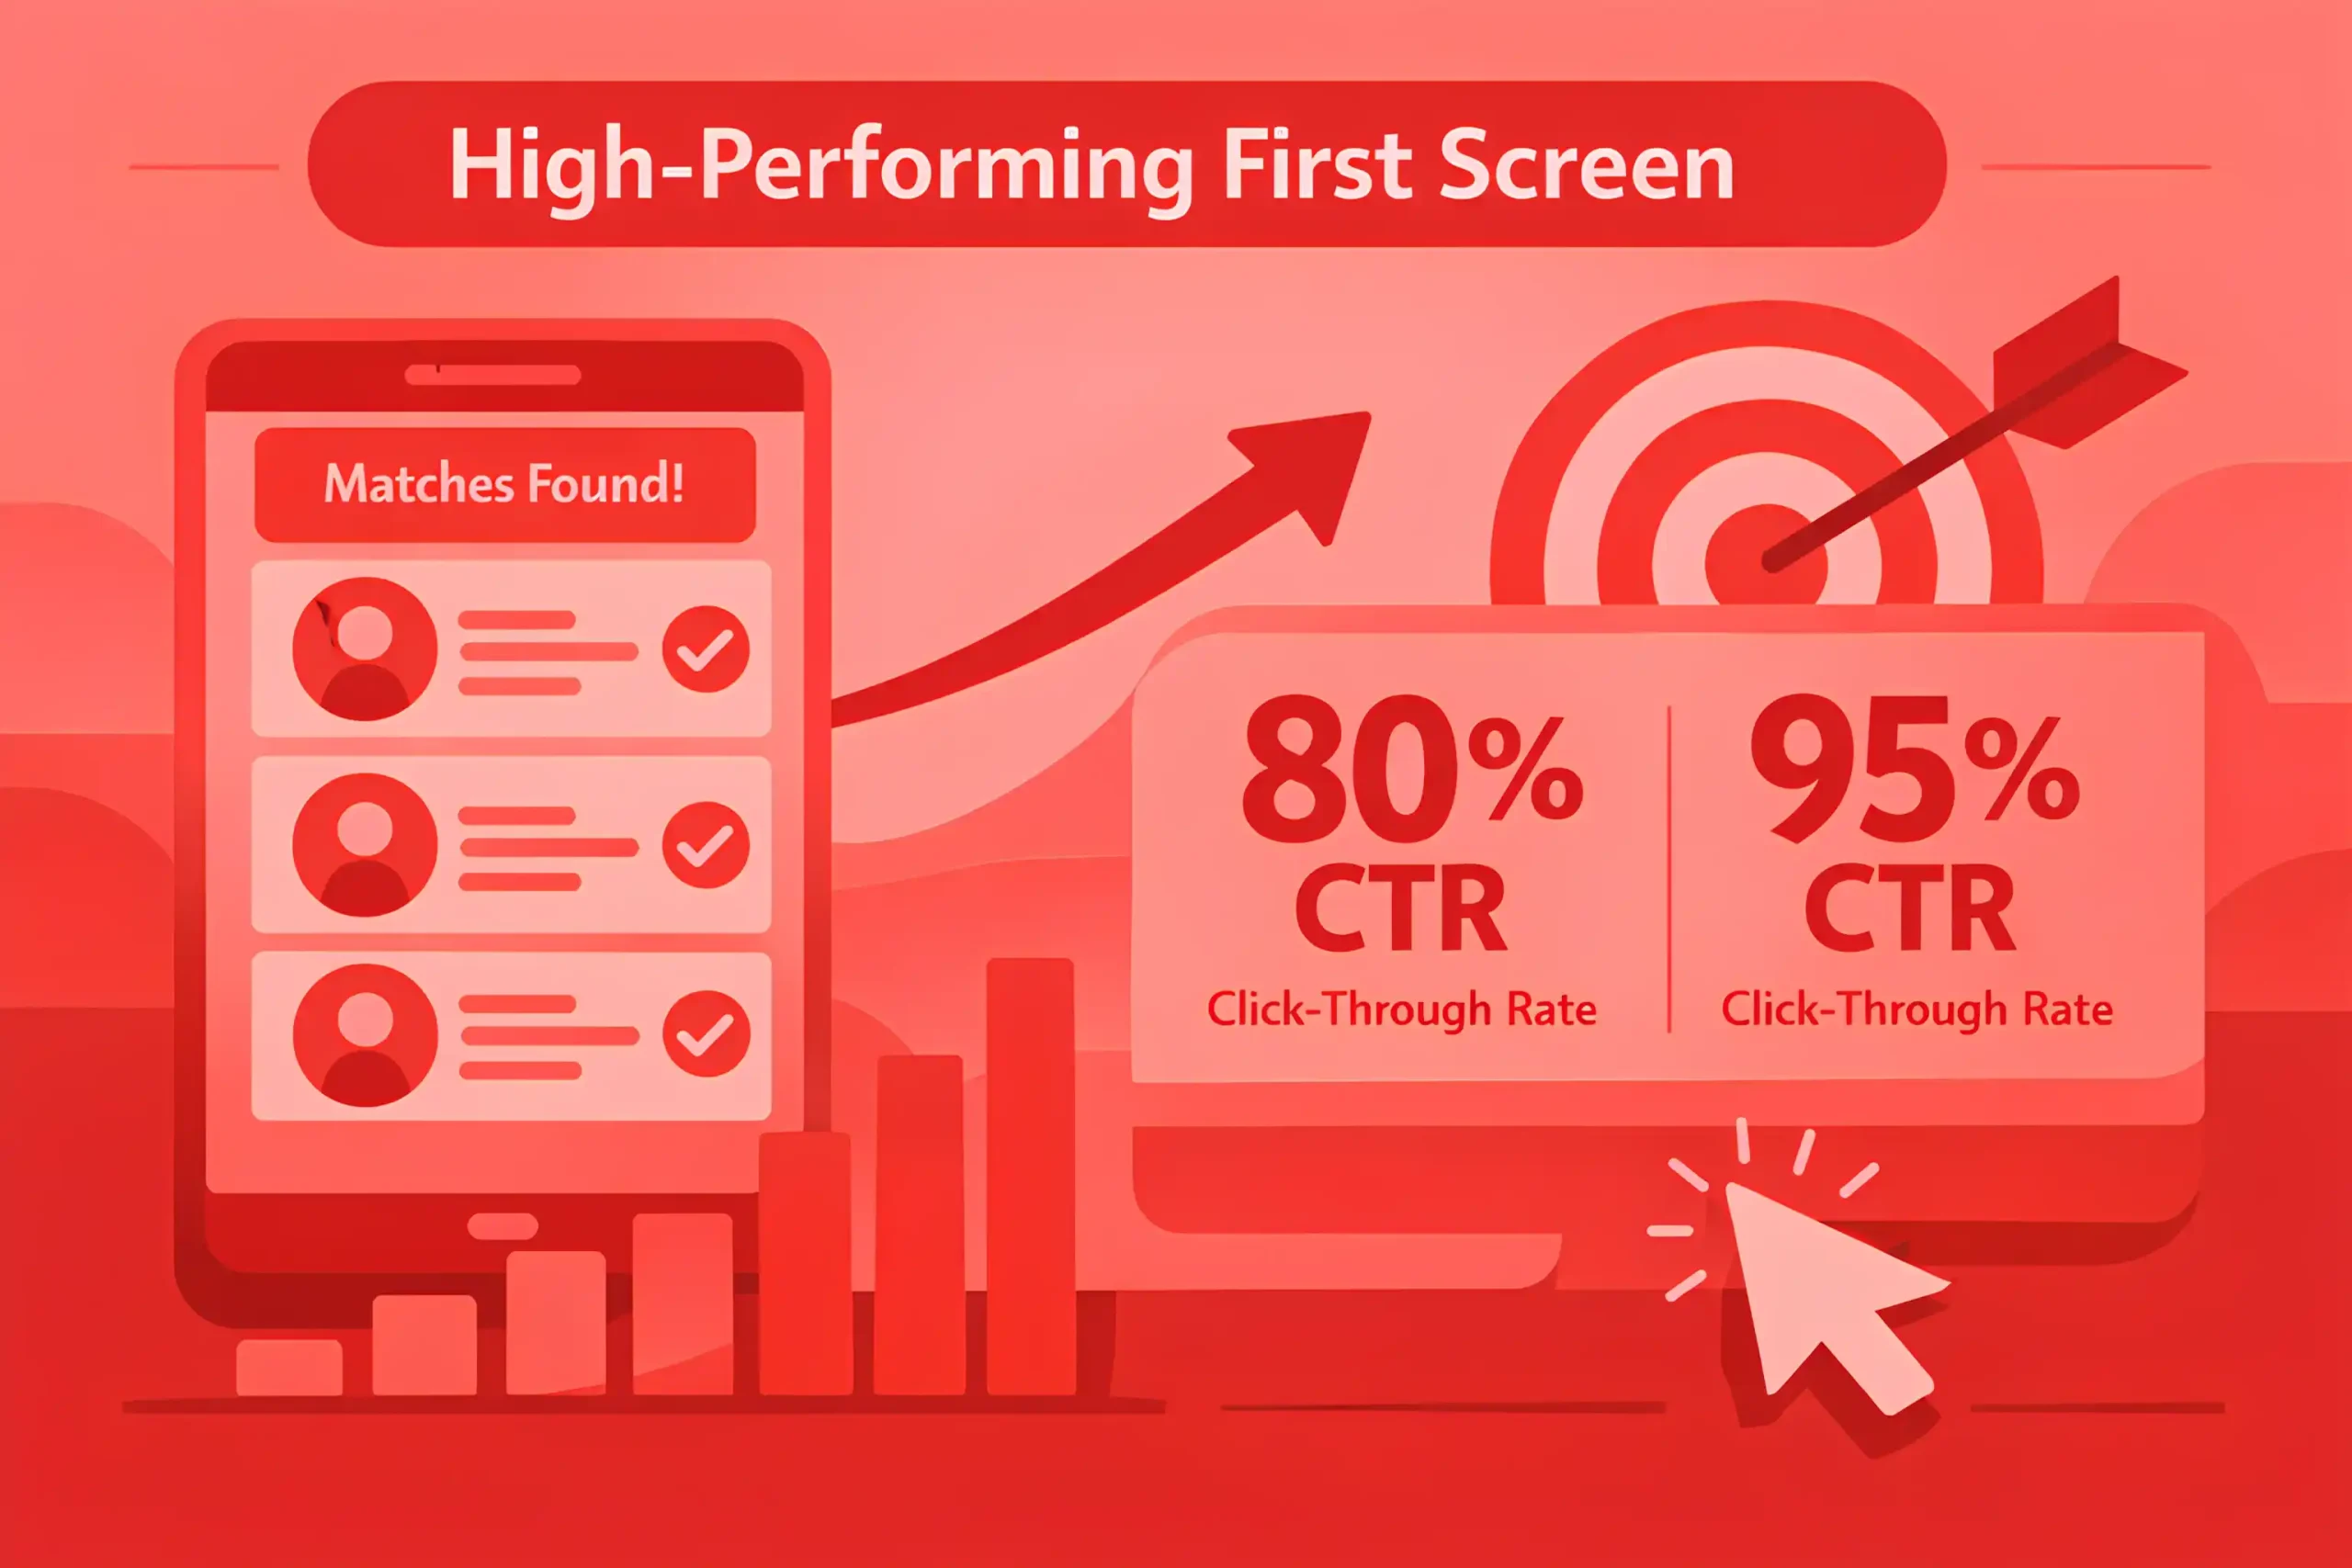
Most search sessions end with a click, with click-through rates commonly 60% to 85% from results to a product or category page.
When the first screen shows strong matches, CTR can reach 80% to 95%.
Add to cart rates for search users often run 2x to 4x higher than browse users, which is why aligning high-intent queries with optimized product pages through e-commerce SEO.
Typical add-to-cart rates from search sessions commonly land around 6% to 18%, depending on category and traffic quality.
Purchase conversion rates for searchers often run 1.5x to 3x higher than non-search sessions.
Search sessions commonly convert around 2% to 6% on many sites, with higher ranges in replenishment categories.
AOV for search-driven purchases often lands 5% to 20% higher because shoppers arrive closer to a decision.
Search users tend to buy more items per order, often 10% to 25% higher than browse orders.
Using filters after search often improves outcomes, with conversion lifts of 10% to 30% versus unfiltered search sessions.
Sorting by price or “best sellers” can increase click depth, but can also reduce conversion 3% to 10% if it hides the best fit products.
Searchers abandon faster when results feel wrong, and bouncing from the search results page can land around 10% to 30% on weaker implementations.
Refinement loops are common, and 20% to 45% of searchers run a second query before adding to cart.
When autocomplete is used, conversion often improves 5% to 15% because queries are cleaner and matches are better.
Useful to know: 100+ Reputation Management Statistics
No-Results, Zero-Click, and Refinement Patterns
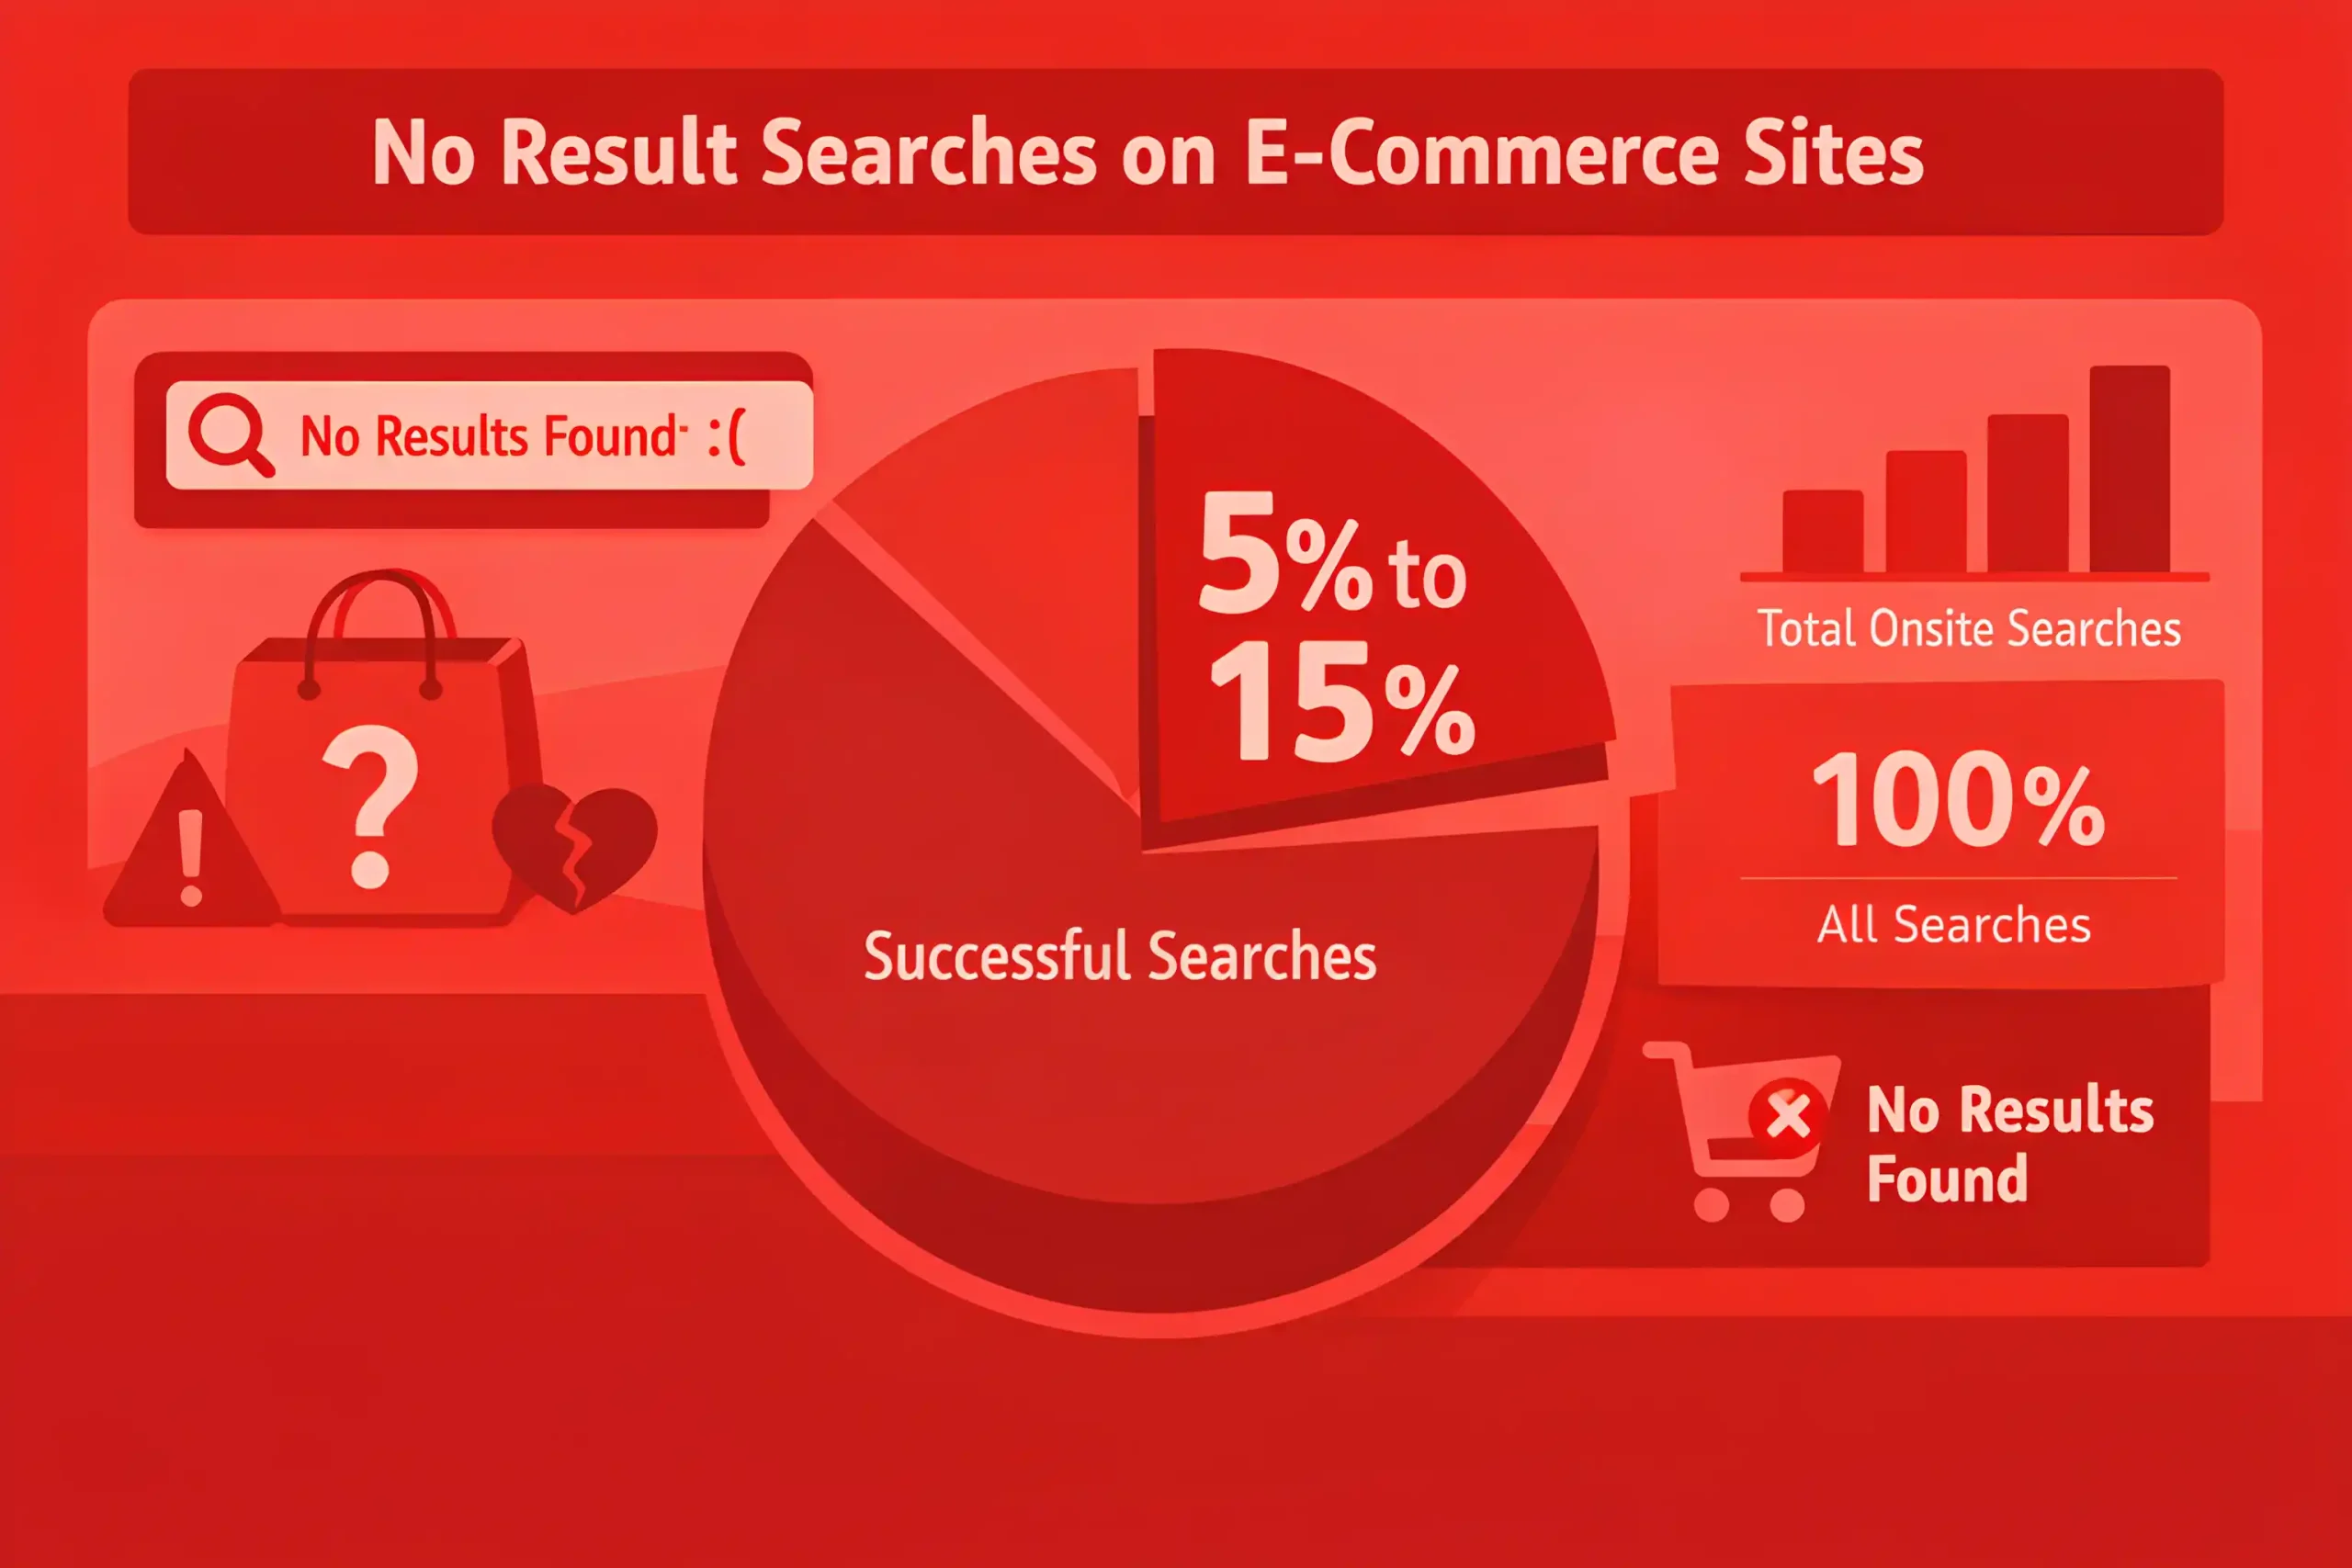
No results queries often represent 5% to 15% of total onsite searches on many e-commerce sites.
In complex catalogs or multi-language stores, no results rates can rise to 10% to 25% without strong synonym and typo handling.
Zero-click searches, where a query produces no product click, commonly account for around 10% to 30% of search sessions.
When relevance is weak on the first page, zero click rates can climb to 25% to 45%, so teams often revisit layout, ranking logic, and visual hierarchy through e-commerce web design.
Refinement is common, and 20% to 45% of search sessions include a second query.
Heavy refinement, three-plus searches in one session, often shows up in 5% to 15% of search sessions and signals friction.
Typos and spelling variants often account for 5% to 15% of failed queries.
Missing synonyms can drive 10% to 30% of no results outcomes in broad catalogs.
Category naming gaps create failures, and internal taxonomy mismatch can explain 10% to 25% of no results queries, which is often addressed through content structure improvements in web design.
Brand and model number searches are high risk for failures, and 2% to 8% of searches can fail due to formatting or spacing differences.
Out-of-stock items often create “soft zero results,” and 5% to 20% of searches can show low click rates because top matches are unavailable.
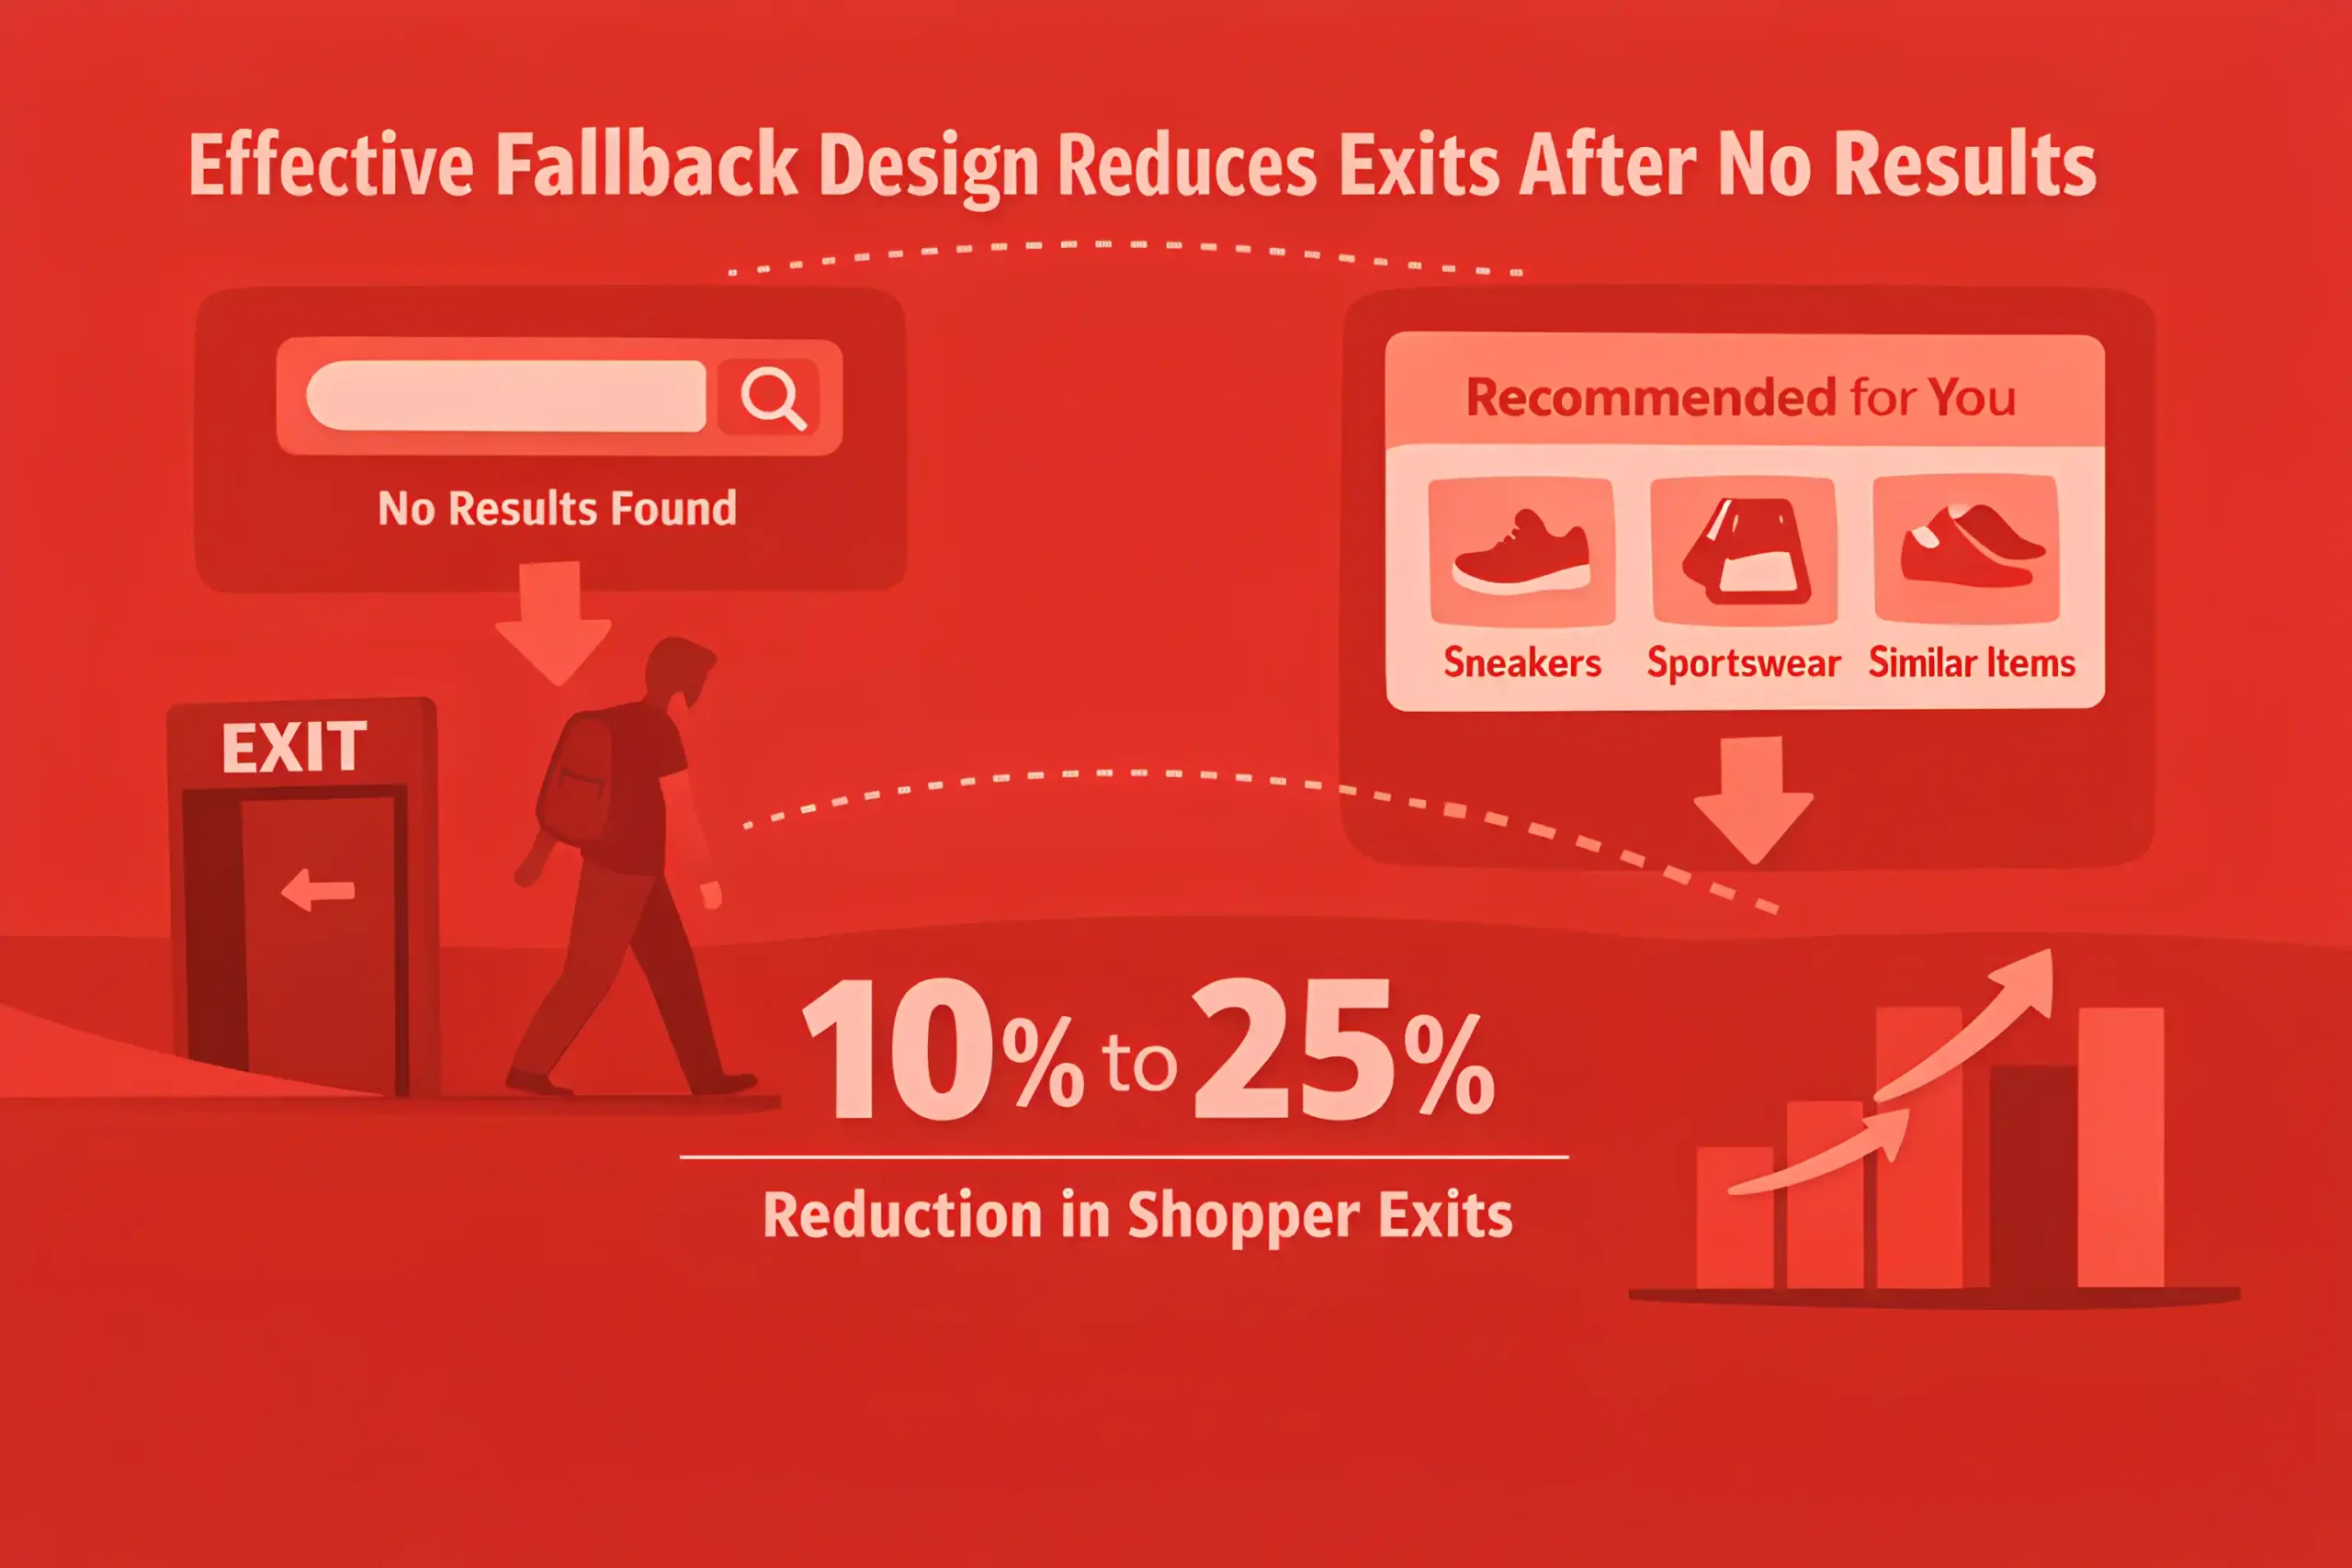
When shoppers hit no results, exit rates commonly rise to 30% to 60% unless fallback suggestions appear.
A good fallback design can cut exits after no results by 10% to 25% by redirecting shoppers to categories or close matches.
Autocomplete reduces failure rates, often lowering no results queries by 10% to 30%.
Query reformulation speed is fast, and many shoppers retry within 10 to 30 seconds after a poor result.
Search Experience & Performance Drivers
Autocomplete can lift search conversion by 5% to 15% because queries are cleaner and intent is clarified early.
Typo tolerance and synonym coverage often reduce no results rates by 10% to 30% in broad catalogs.
Personalized ranking, based on behavior and inventory, can improve CTR 5% to 20% when data quality is strong, and the measurement layer is usually defined inside a digital marketing strategy.
Merchandising rules, like boosting in stock items, often improve add to cart rates by 5% to 15% during supply volatility.
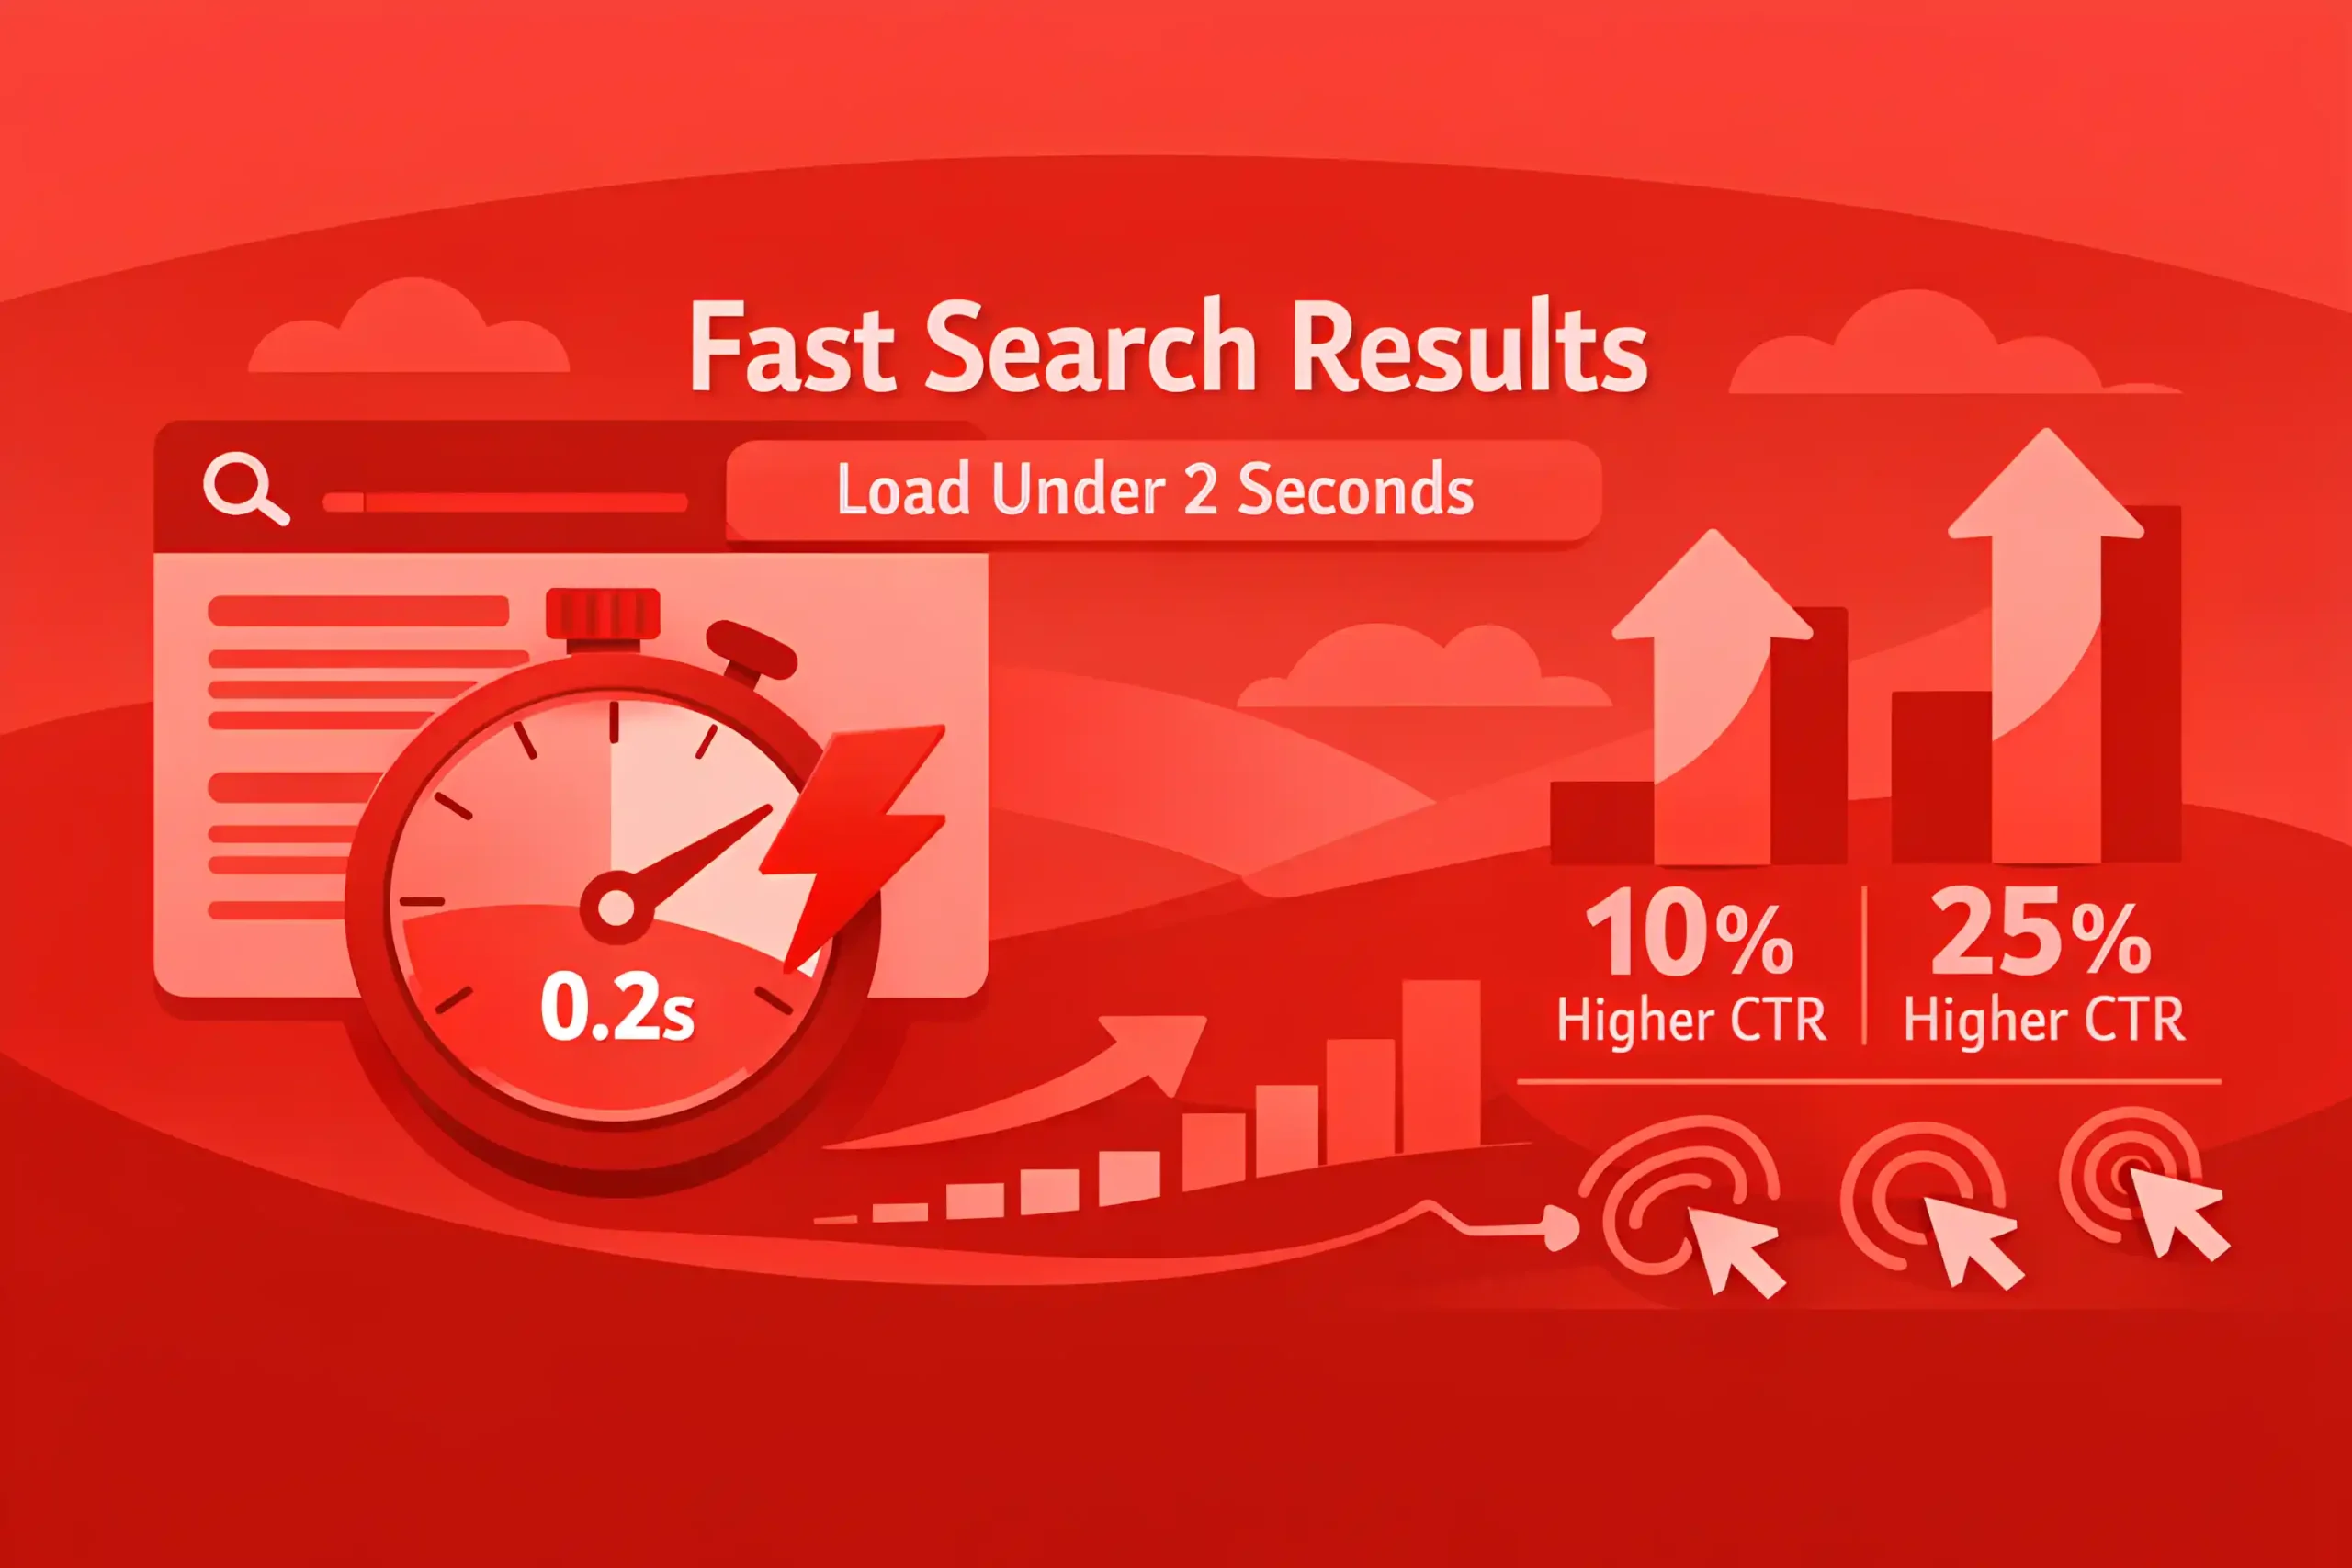
Speed matters, and search results that load in under 2 seconds often show 10% to 25% higher CTR than slower pages, so teams tie search performance directly to e-commerce SEO execution and site fixes.
Latency above 3 seconds commonly increases abandonment by 10% to 30% on mobile.
Rich results, like ratings, price, and availability, can lift click-through by 5% to 15% when displayed consistently.
Showing a clear “in stock” status can reduce wasted clicks and improve add to cart by 3% to 10%.
Filter visibility drives use, and prominent filters can raise filter adoption by 10% to 25%.
When filters are used, conversion often improves 10% to 30% versus unfiltered search sessions.
Sort defaults influence outcomes, and starting with “relevance” often outperforms “price low to high” by 3% to 12% in many categories.
Category and attribute facets that match shopper language often reduce refinements by 10% to 20%.
If the first row of results is wrong, the session often fails, and poor first screen relevance can raise zero click rates by 15% to 35%.
Query understanding that maps plural, singular, and variants often reduces reformulation by 10% to 25%.
Clear empty state UX can cut exits on failed searches by 10% to 25%, keeping shoppers moving to close matches.
Don’t miss out: 100+ Content Marketing Statistics
The Key Takeaways
Site search is one of the clearest signals of intent on an e-commerce site. When people search, they move faster, click with purpose, and convert at higher rates than casual browsers.
The numbers in our guide help you treat search as a revenue lever. Use them to set baselines for search adoption, no results, refinements, and conversion. Then fix the obvious leaks first: synonyms and typo handling, empty state fallbacks, speed, and results relevance on the first screen.
Once the basics are solid, focus on the compounding wins. Improve filters and facets, align ranking with inventory and margin rules, and track search queries as a product feedback stream. Strong search reduces friction, raises conversion, and makes merchandising and UX decisions easier to defend.