Most buyers make up their mind before your sales team ever gets a call. They do research, compare options, and narrow the shortlist long before they speak to anyone.
Content marketing is the work that happens in that quiet phase. Marketers consistently report that content drives awareness and demand, yet many still struggle to connect content performance to revenue and the real buyer journey.
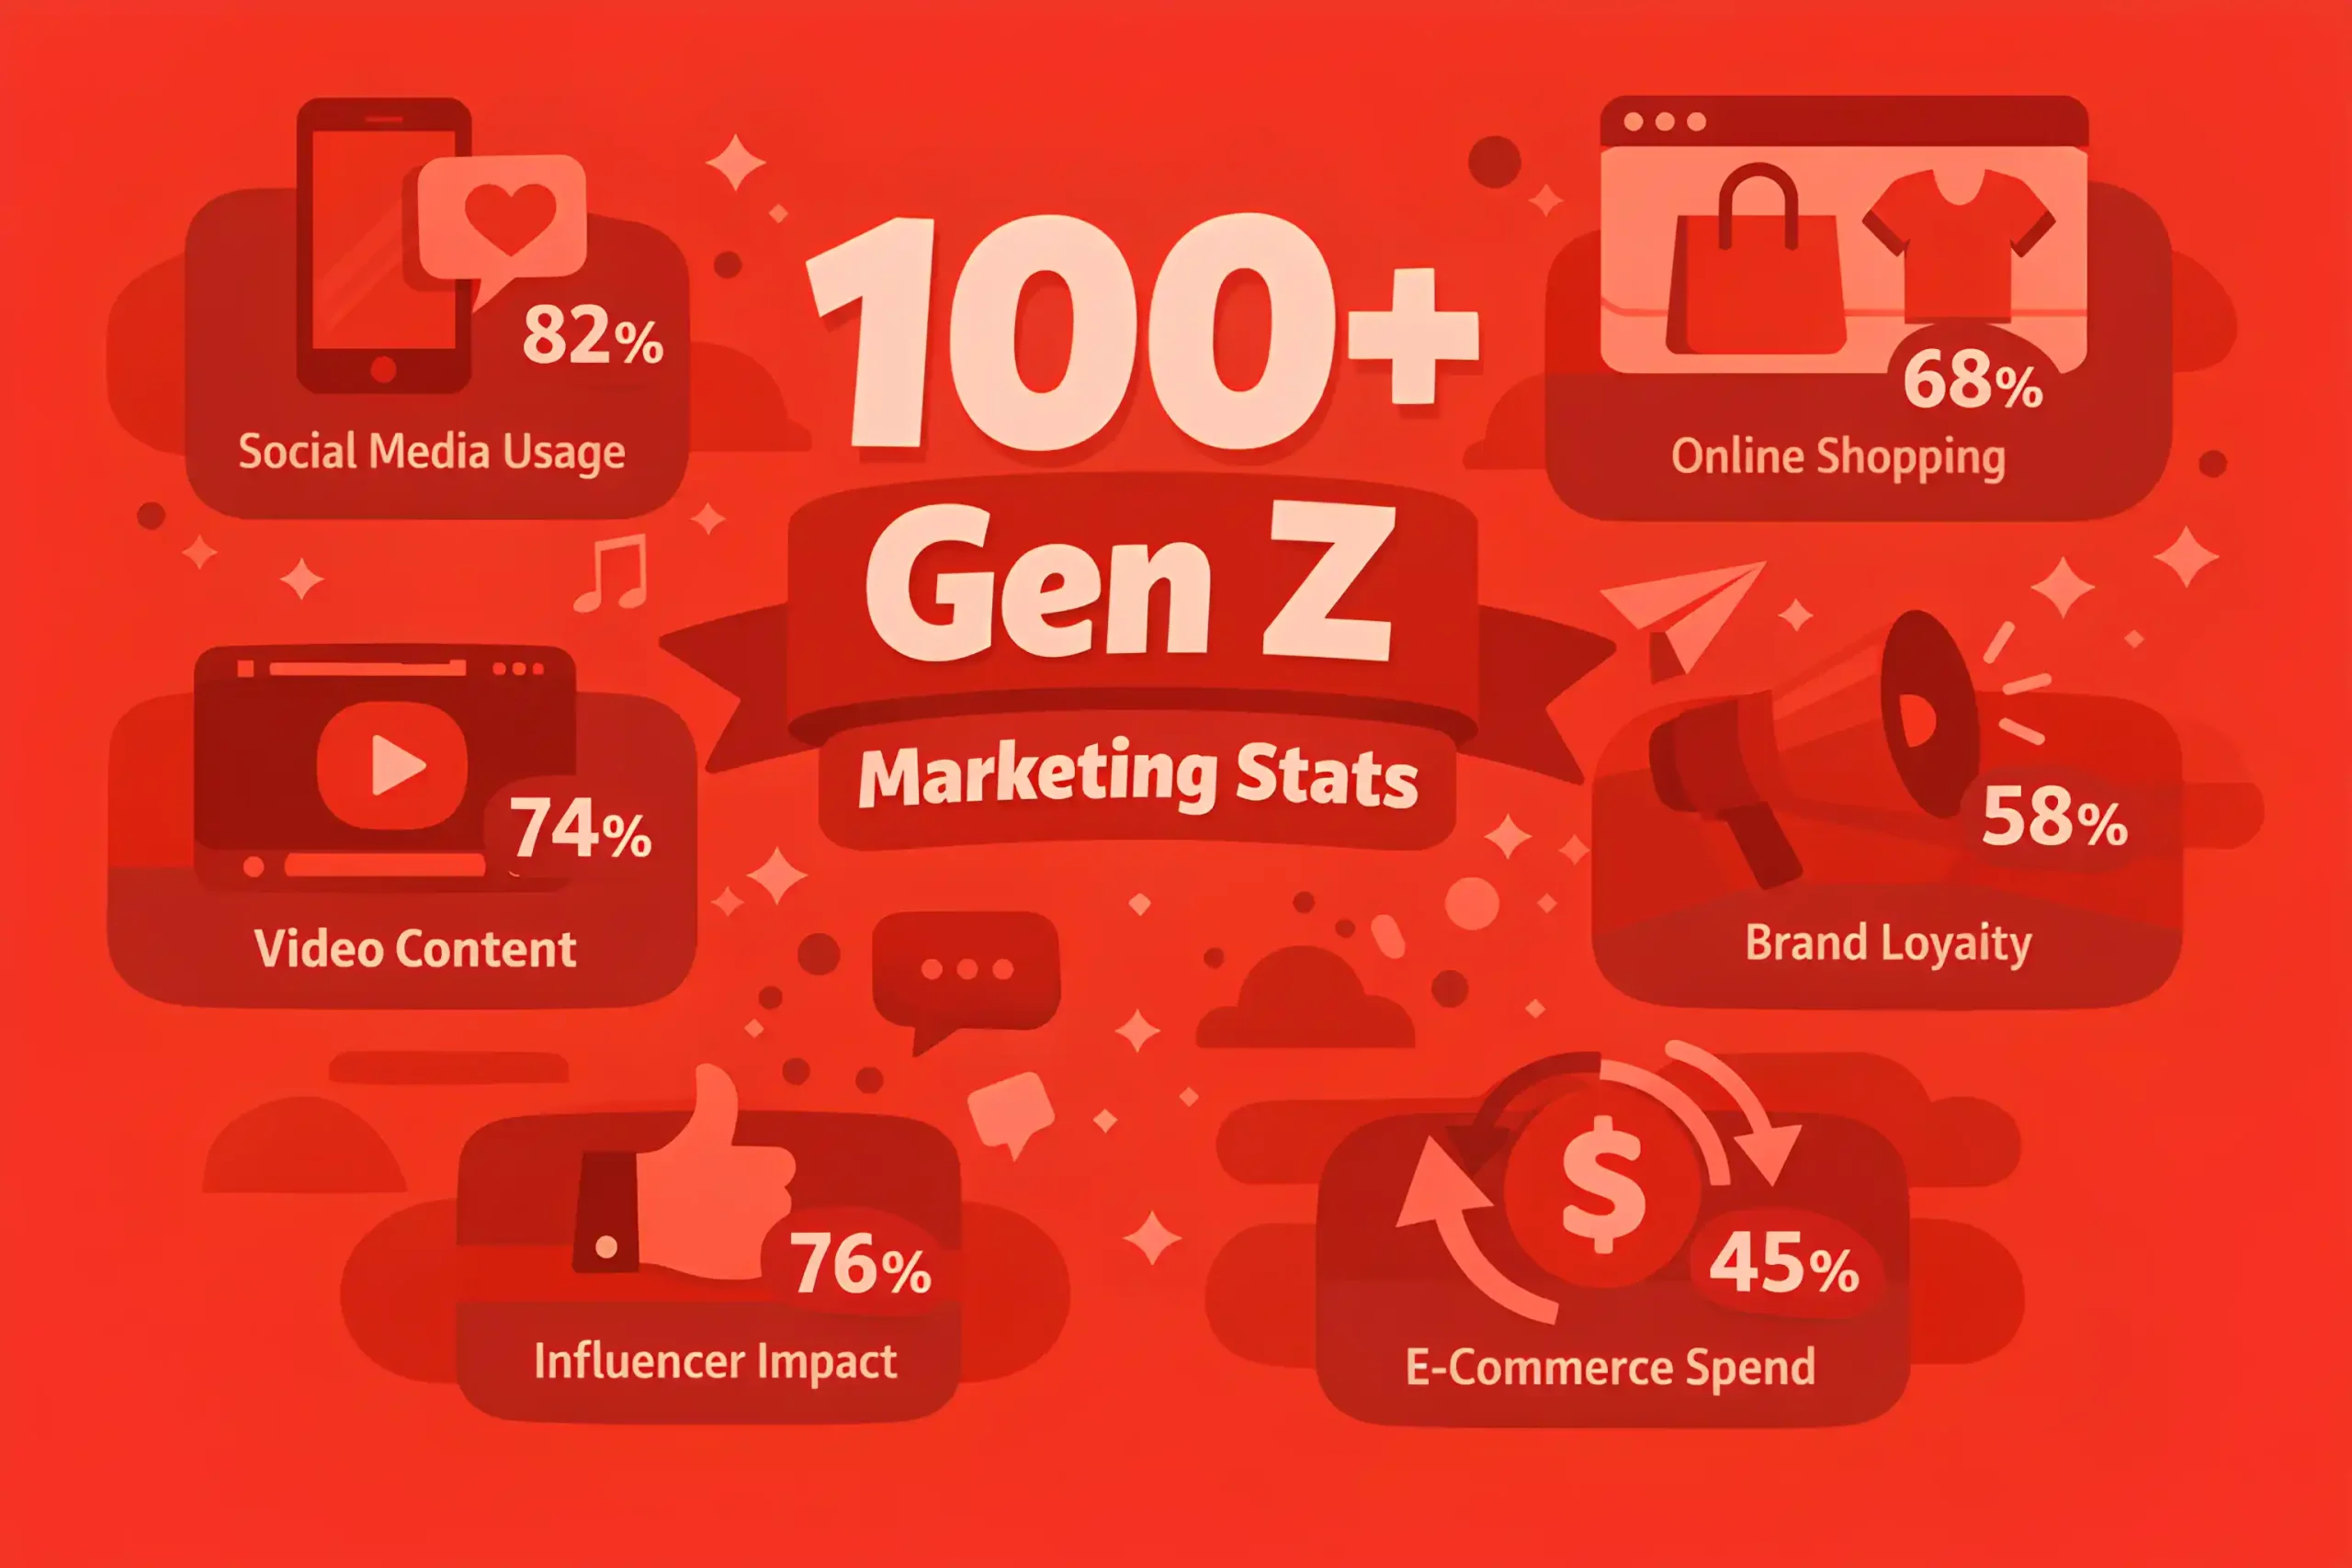
Our updated 2026 collection at NEWMEDIA.COM brings together more than one hundred content marketing statistics you can use in planning, reporting, and day-to-day content decisions. Use it to set clearer goals, challenge assumptions about channels and formats, and back priorities with data instead of opinions.
Content Marketing ROI and Budget Benchmarks
Content marketing budgets commonly land around 20% to 40% of the total marketing budget in teams that rely on organic growth.
Smaller teams often run leaner, with content spend closer to 10% to 25%, then increase once pipeline impact is proven.
Mature programs frequently split spend, so creation takes 40% to 60%, and distribution takes 40% to 60%.
Teams that underfund distribution often see strong pieces plateau, even when the content itself is solid.
A healthy content program often targets an ROI payback window of 6 to 12 months for evergreen assets.
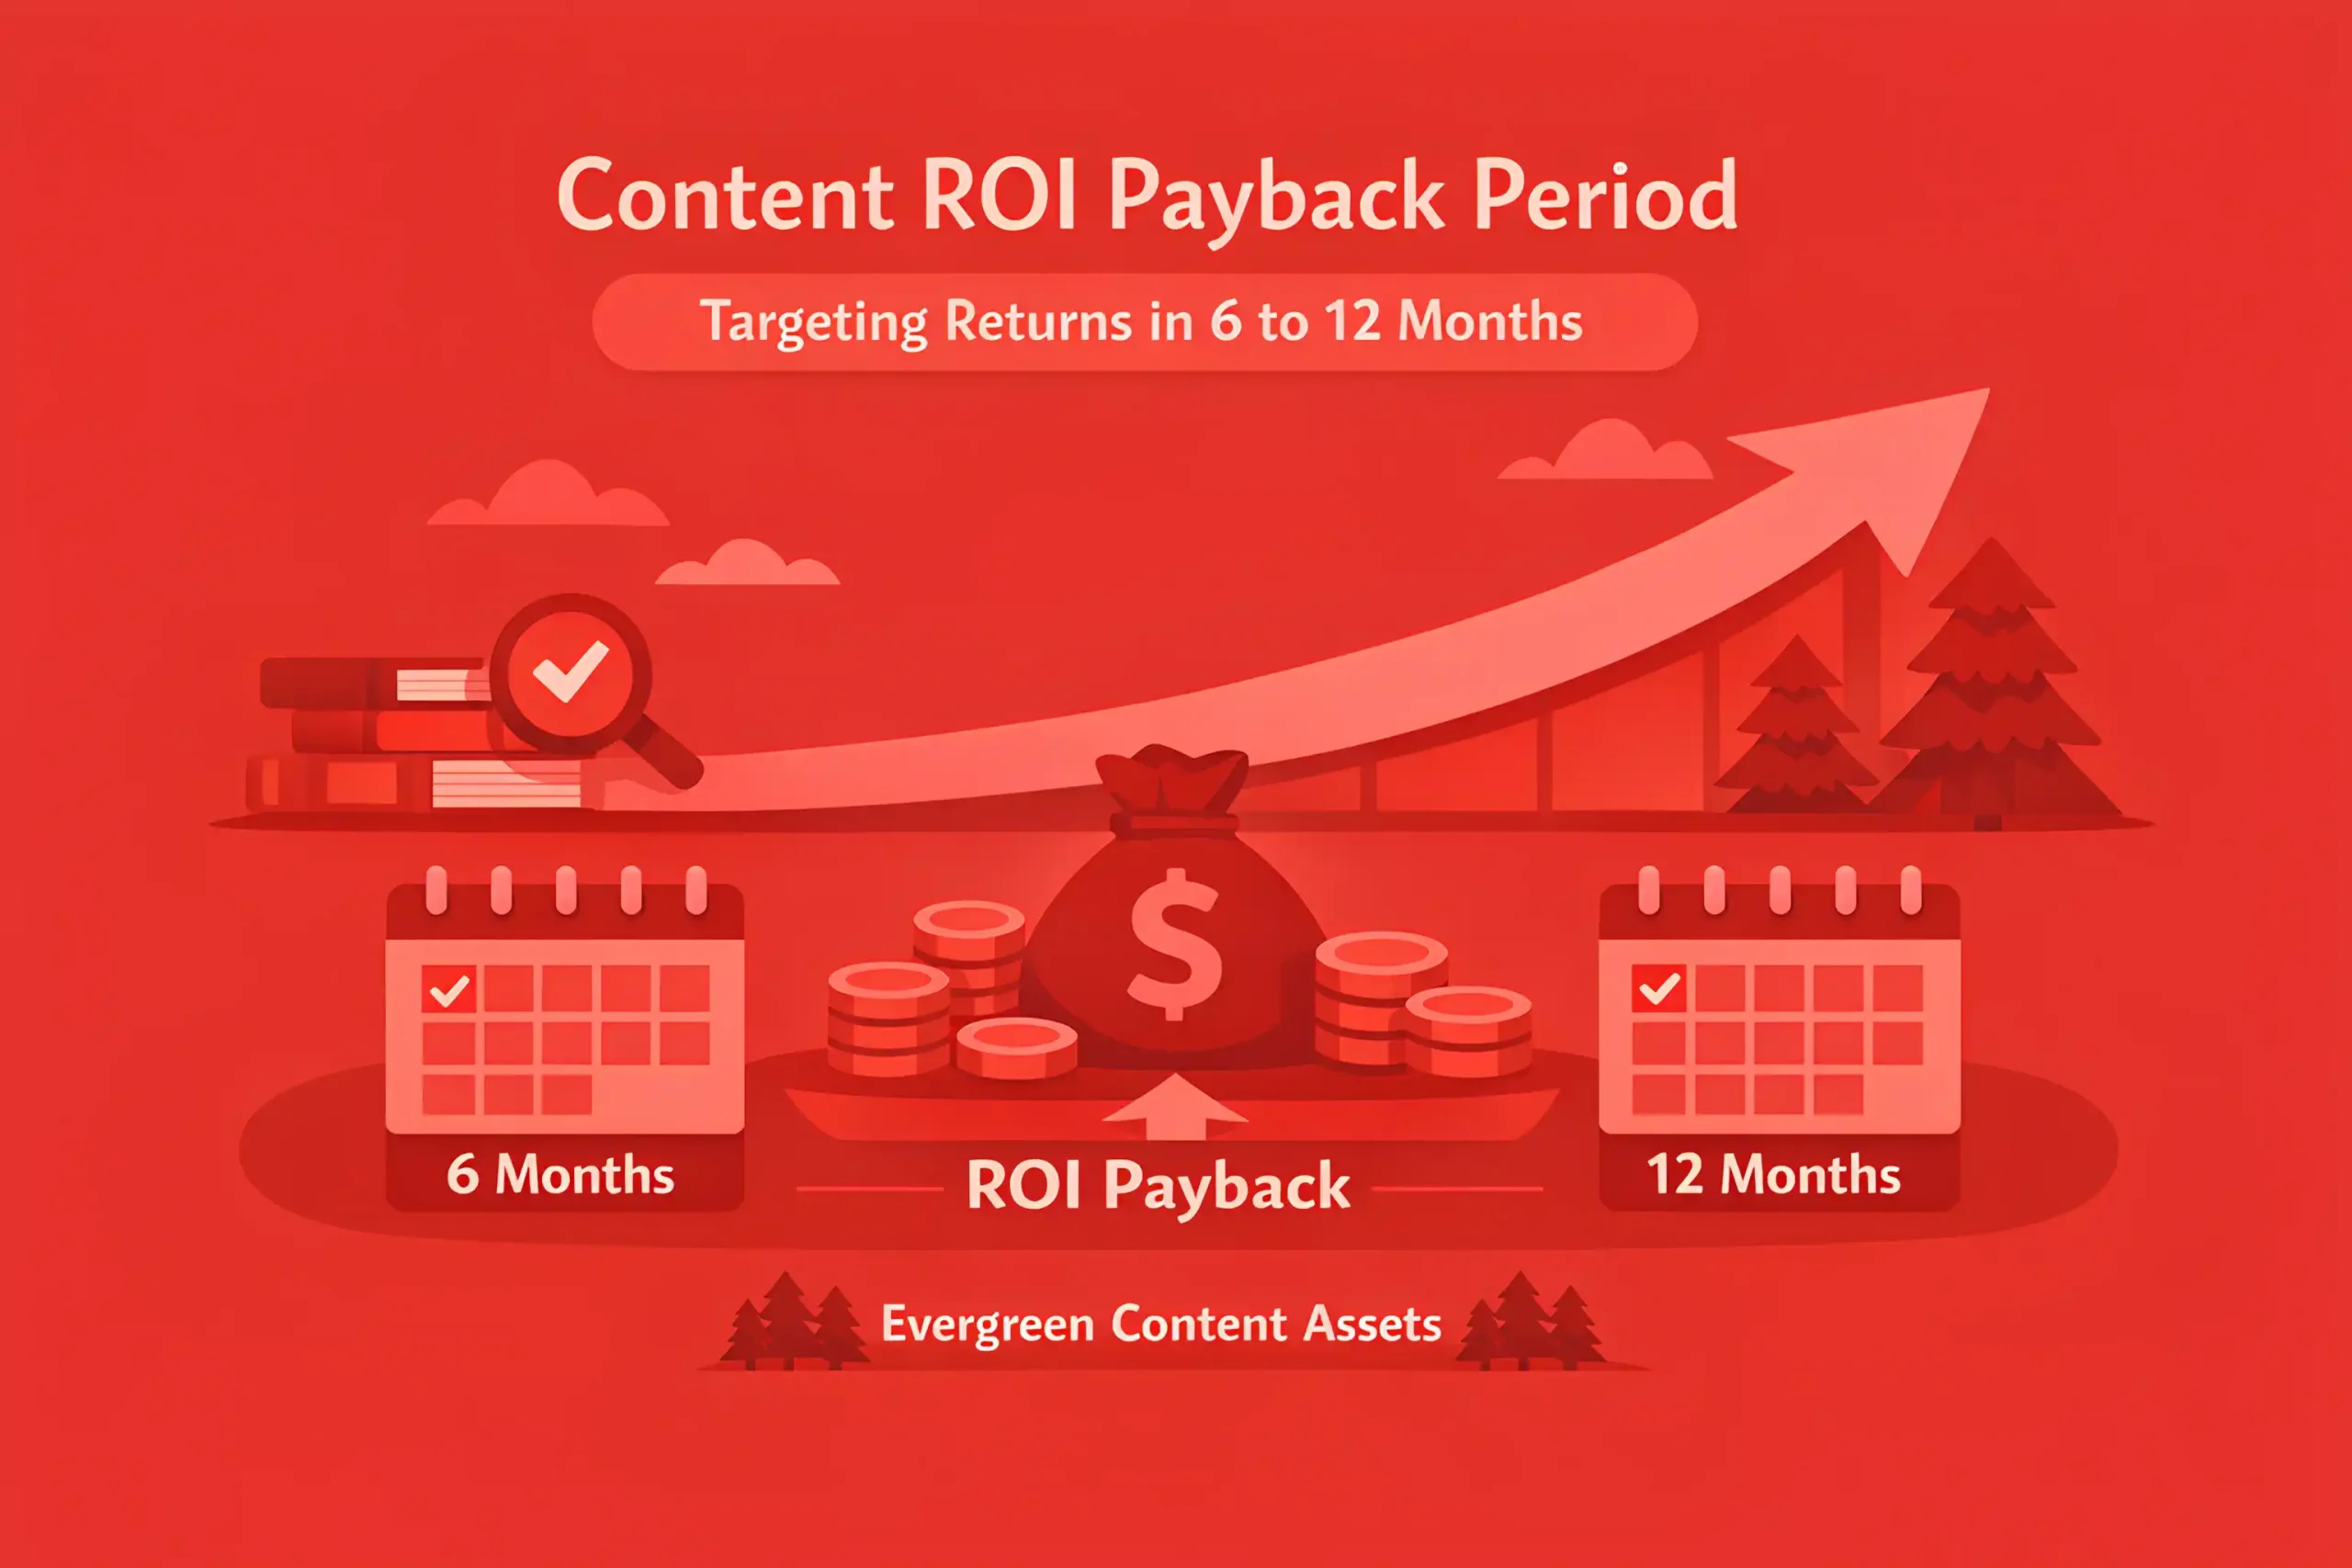
Campaign-led content can pay back faster, often within 30 to 90 days, but tends to decay sooner.
Content-driven leads commonly cost 30% to 60% less than paid acquisition once the library is built and ranking.
Organic content usually delivers compounding returns, with 50% to 80% of total lifetime results arriving after the first few months.
Teams often find that 10% to 20% of published pieces generate 50% to 70% of results, so pruning and updating matter.
Refreshing high-intent pages can deliver 20% to 60% lifts without increasing publishing volume, especially when those updates are tied to a broader SEO strategy.
A typical quarterly content budget split is 60% to 80% on core pages and refreshes, and 20% to 40% on new experiments.
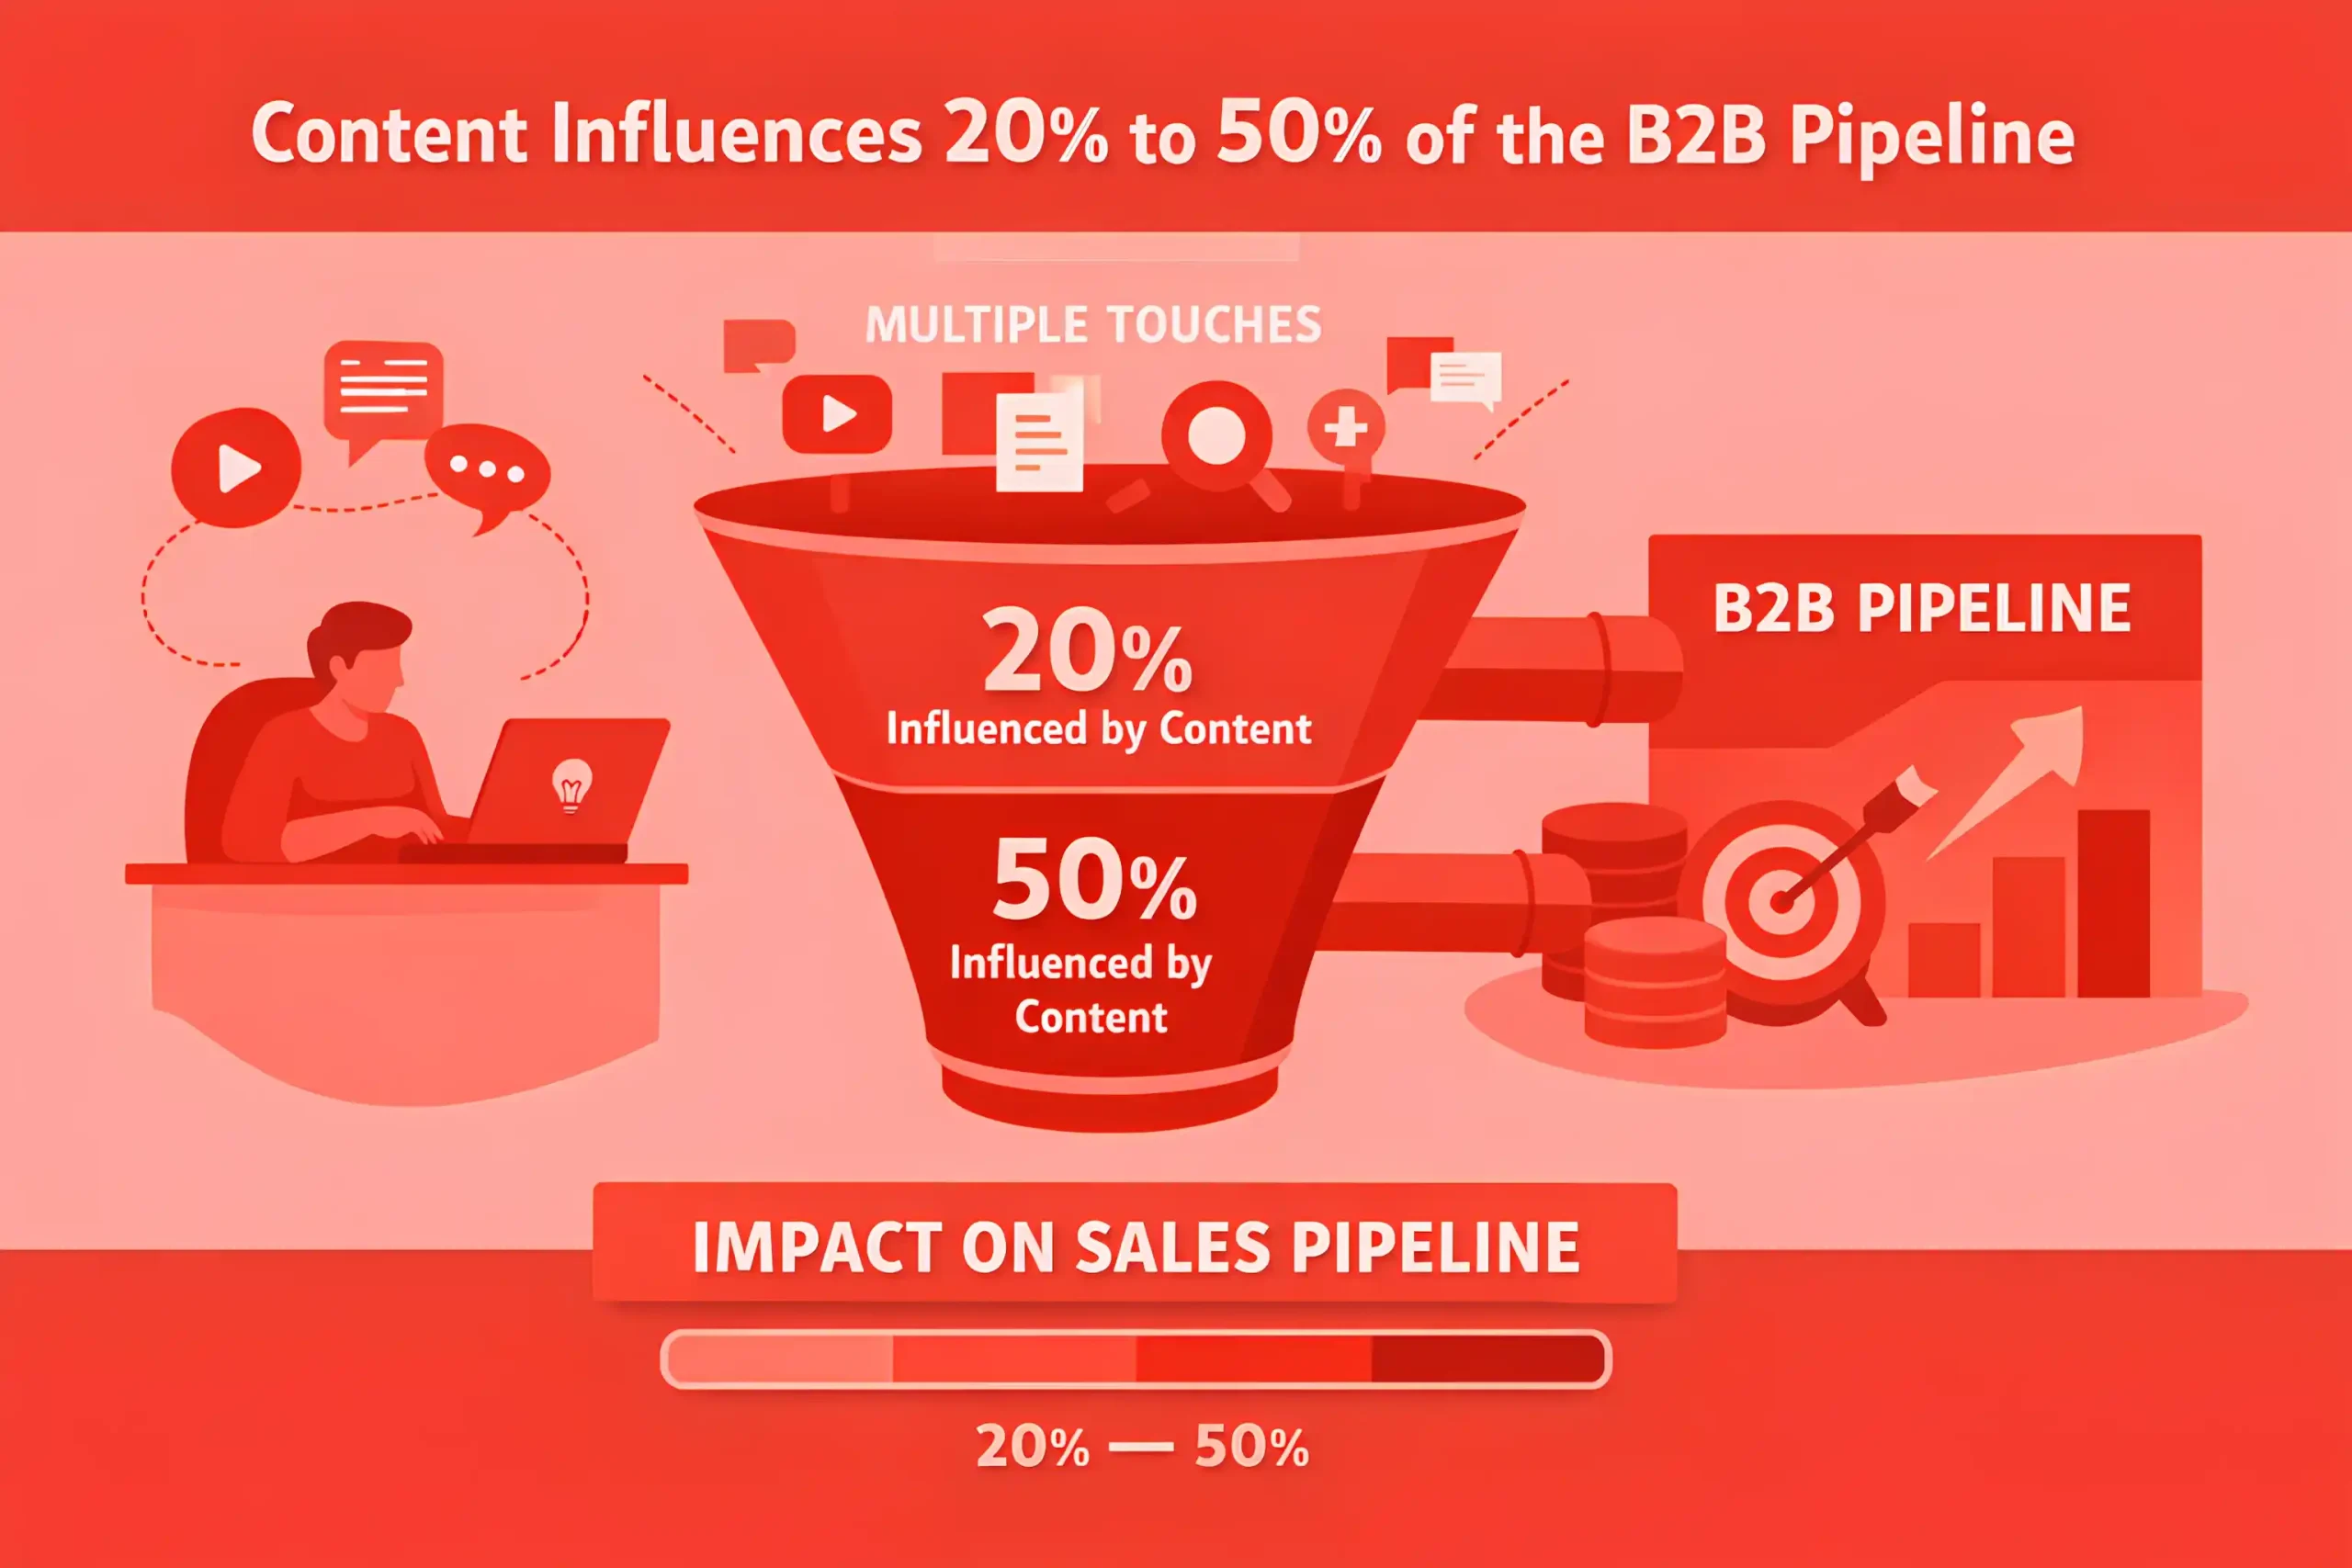
In B2B, content often influences 20% to 50% of the pipeline when influence is measured across multiple touches.
For e-commerce, content can contribute 10% to 30% of assisted conversions when attribution captures first and returning visits.
Teams that track content by cohorts often reduce wasted production by 15% to 35% because they stop funding low-intent topics.
A realistic benchmark for content-led conversion rate improvement after fixing intent and UX is 10% to 25% with conversion rate optimization.
When content is treated as a product, teams often increase output quality while reducing volume by 10% to 30%.
A common performance target is to grow organic sessions 5% to 15% month over month in the first growth phase, then stabilize around 2% to 6% as the base scales.
Content programs often require 3 to 6 months to show clear traction, and 6 to 12 months to look predictable at scale.
Budget increases are easiest to justify when reporting ties content to pipeline stages, which can lift approved spend by 10% to 25% versus traffic-only reporting.
You may also find interesting: 100+ Email Marketing Statistics
Traffic, SEO, and Organic Visibility Stats
Organic search often drives 40% to 70% of trackable website sessions for content-led brands.
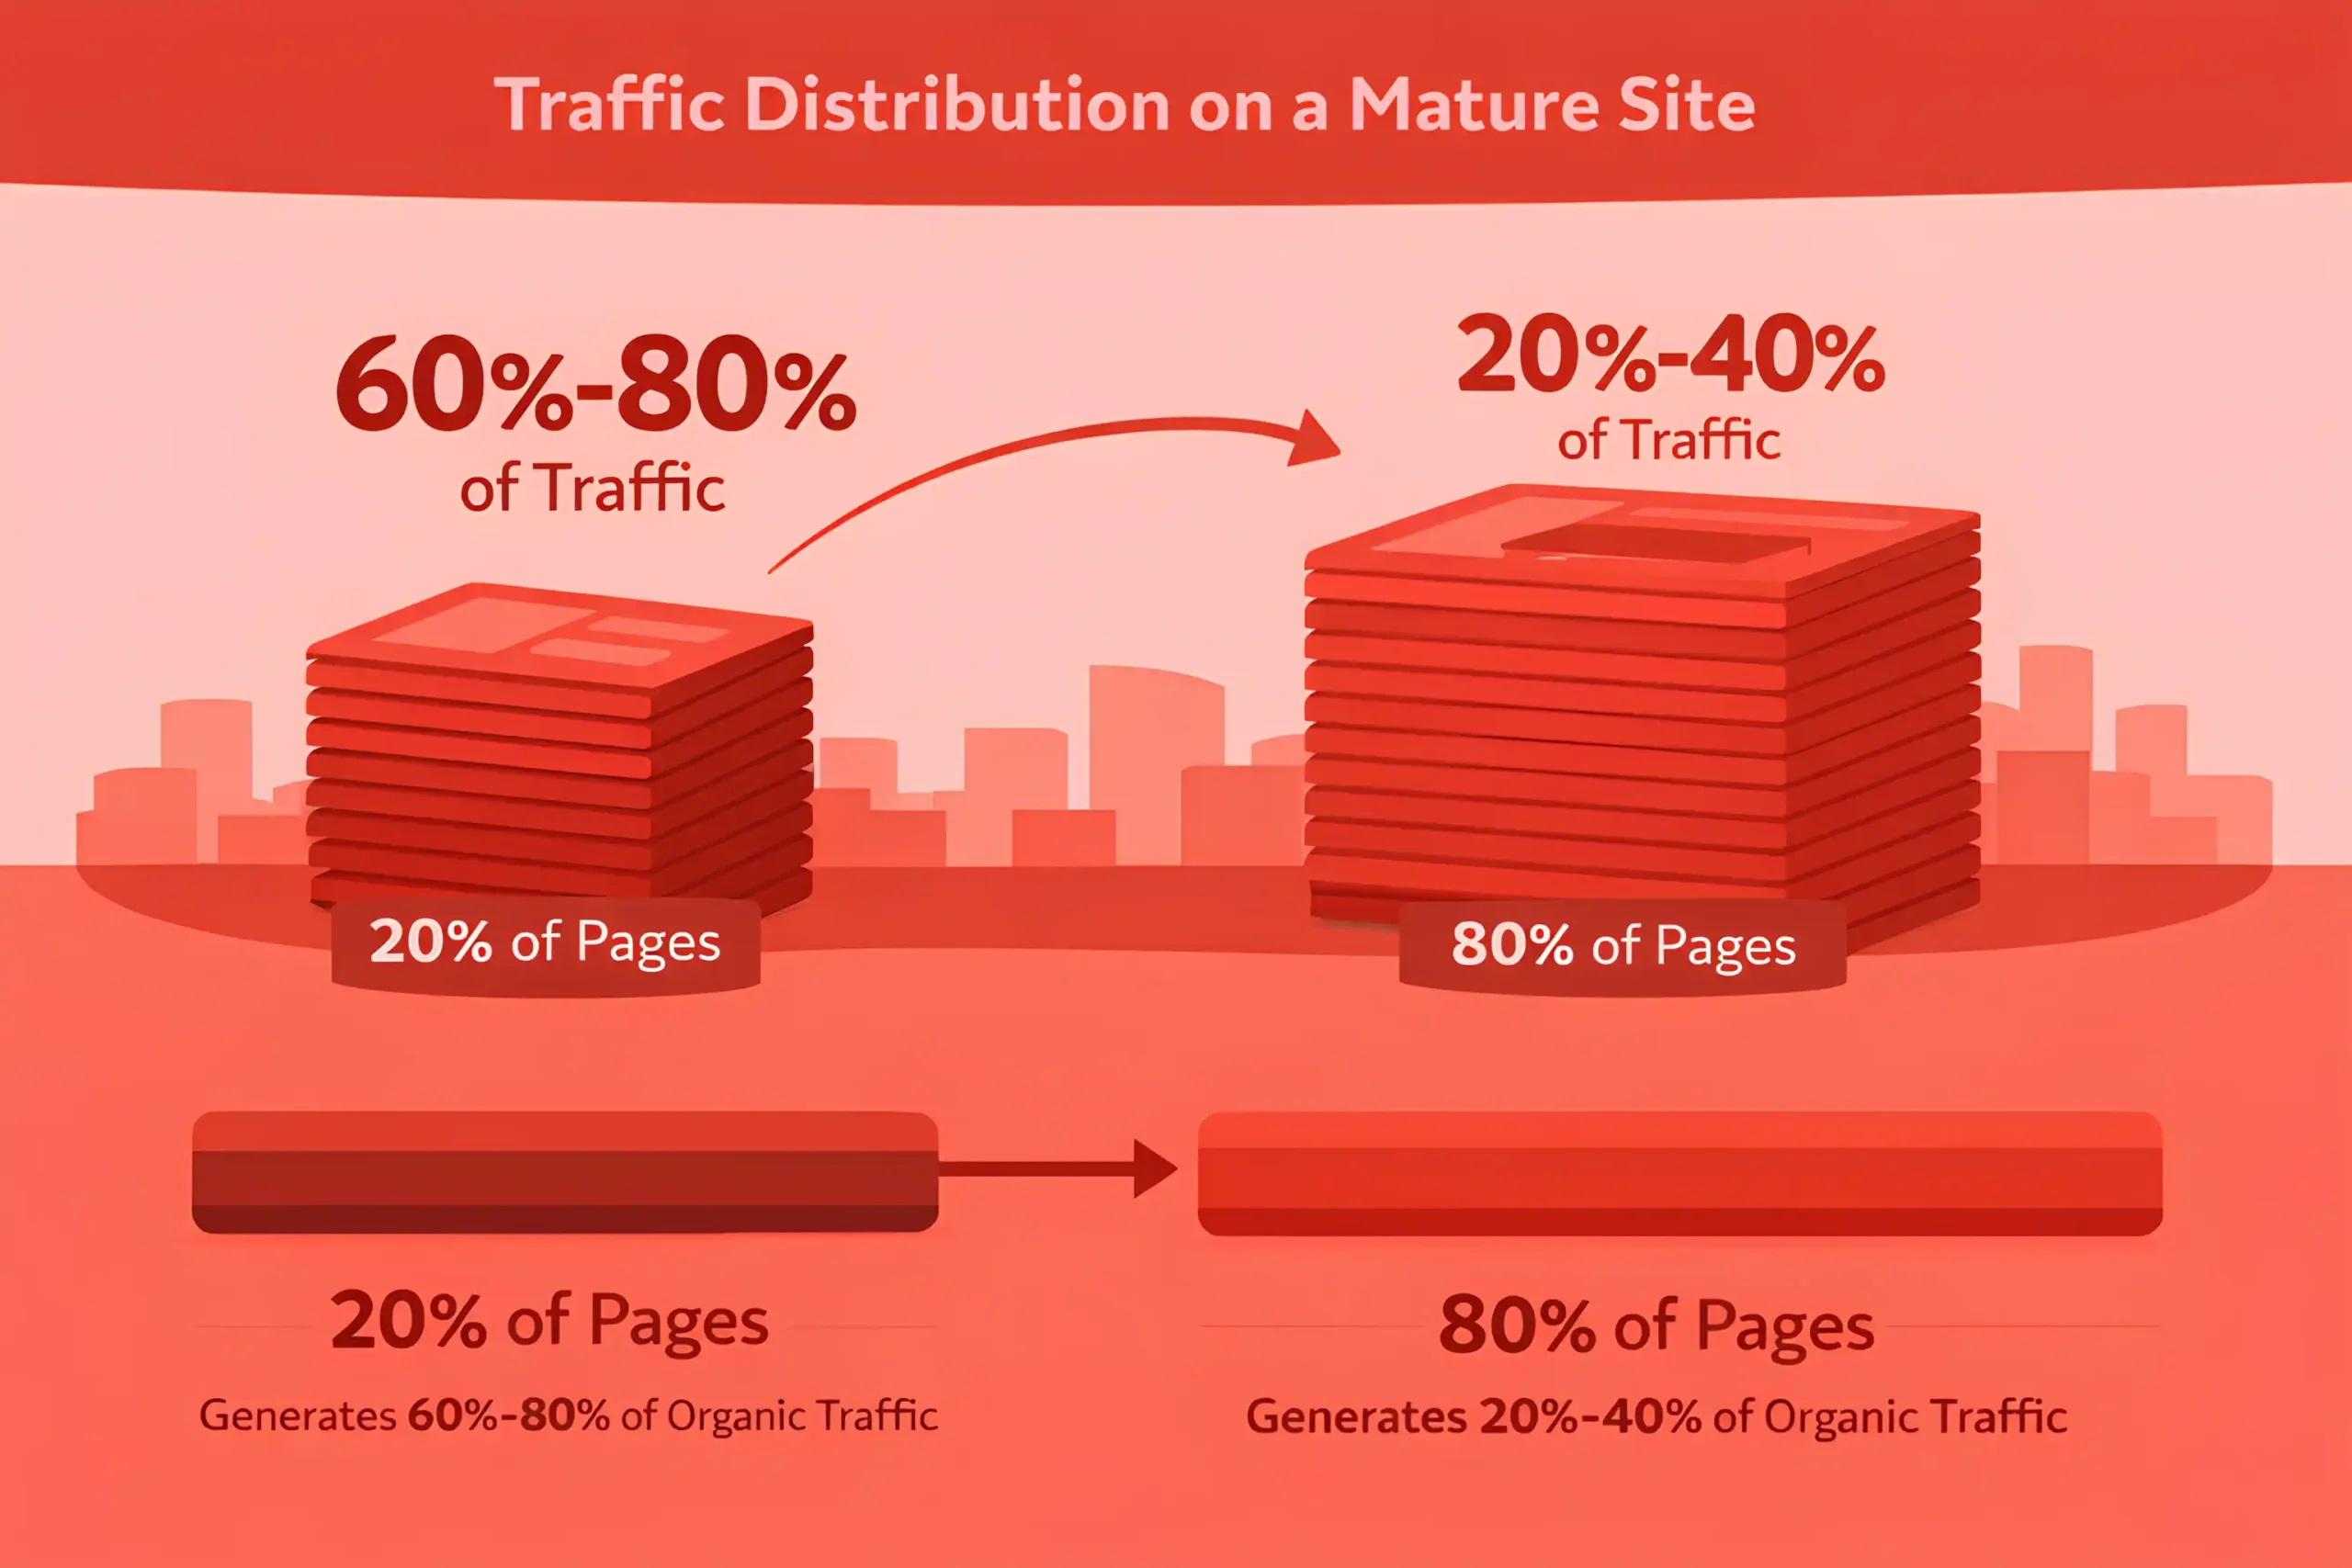
A typical mature site sees 10% to 20% of pages generate 60% to 80% of organic traffic.
Most sites get the majority of organic growth from existing content, with updates contributing 30% to 60% of yearly gains.
New content commonly needs 8 to 16 weeks to reach stable rankings on mid competition terms.
Competitive queries often take 6 to 12 months to break into consistent top positions without strong authority.
Long tail queries usually account for 70% to 90% of total impressions across a content library.
Click share is concentrated, with the top three results often capturing 55% to 75% of clicks.
Position one CTR frequently lands around 25% to 35%, then declines sharply past the first few results.
Moving from page two to page one can lift clicks by 3x to 10x, even if impressions stay similar.
Featured snippet capture can add 5% to 20% more clicks for a query set, but it can also siphon clicks in some cases.
Brand presence typically improves organic CTR by 10% to 30% on non-brand queries over time.
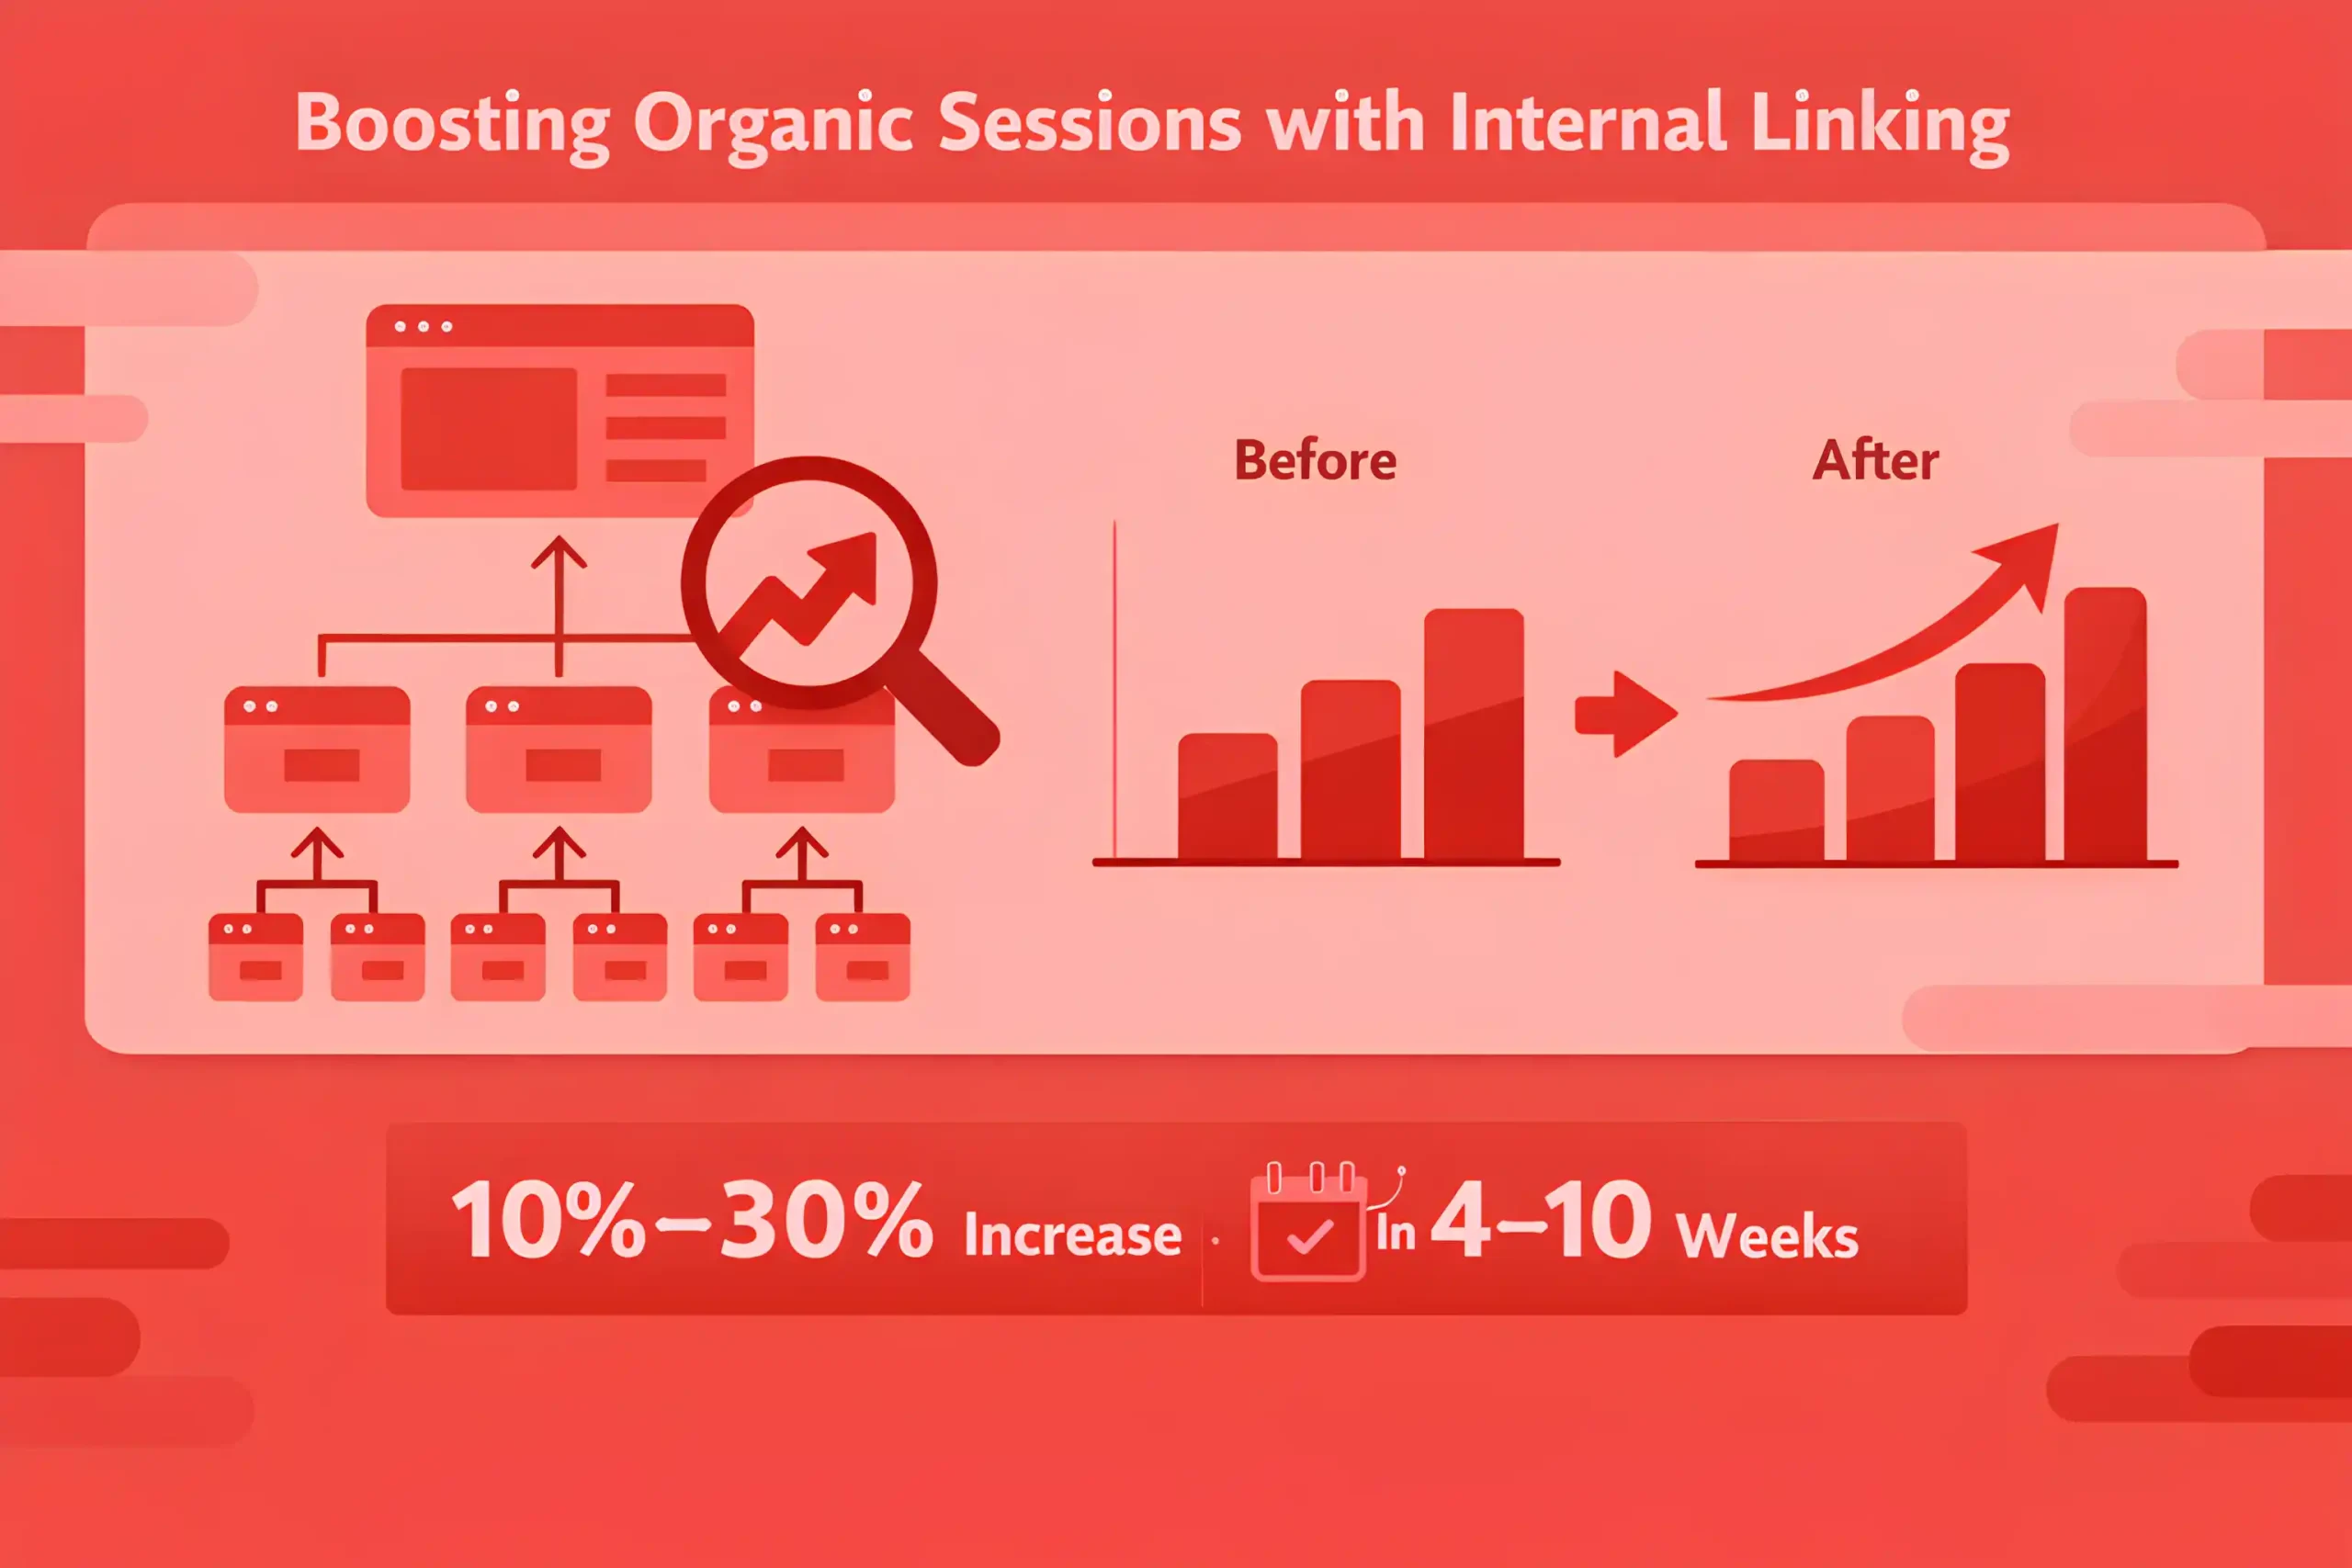
Internal linking improvements often lift organic sessions 10% to 30% on clusters within 4 to 10 weeks when paired with a clear digital marketing strategy.
A clear topic cluster structure commonly increases the number of ranking keywords by 20% to 50% over a quarter.
Indexation gaps are common, and cleaning crawl waste can improve discovery speed by 15% to 40% through focused technical SEO.
Search performance is often limited by technical drag, and cleaning crawl waste can improve discovery speed by 15% to 40%.
Content refreshes on high-intent pages often deliver 20% to 80% traffic lifts when intent match and UX are fixed.
Snippet improvements usually move CTR by 5% to 20% on pages already ranking on page one.
Pages that earn new quality links often see ranking gains within 2 to 8 weeks, and that momentum is usually driven by a strong digital PR agency.
Sites with consistent publishing and pruning tend to reduce traffic volatility by 10% to 25% across core topics.
For most teams, the most reliable compounding growth comes from improving the top 20% of pages, not publishing more.
Explore also: 200+ Social Media Marketing Statistics
Content Formats Performance
Short-form posts often win on reach, but long-form assets tend to win on qualified leads, especially in B2B.
Long-form pages commonly earn 2x to 4x more organic traffic over time than short posts when the topic has sustained demand.
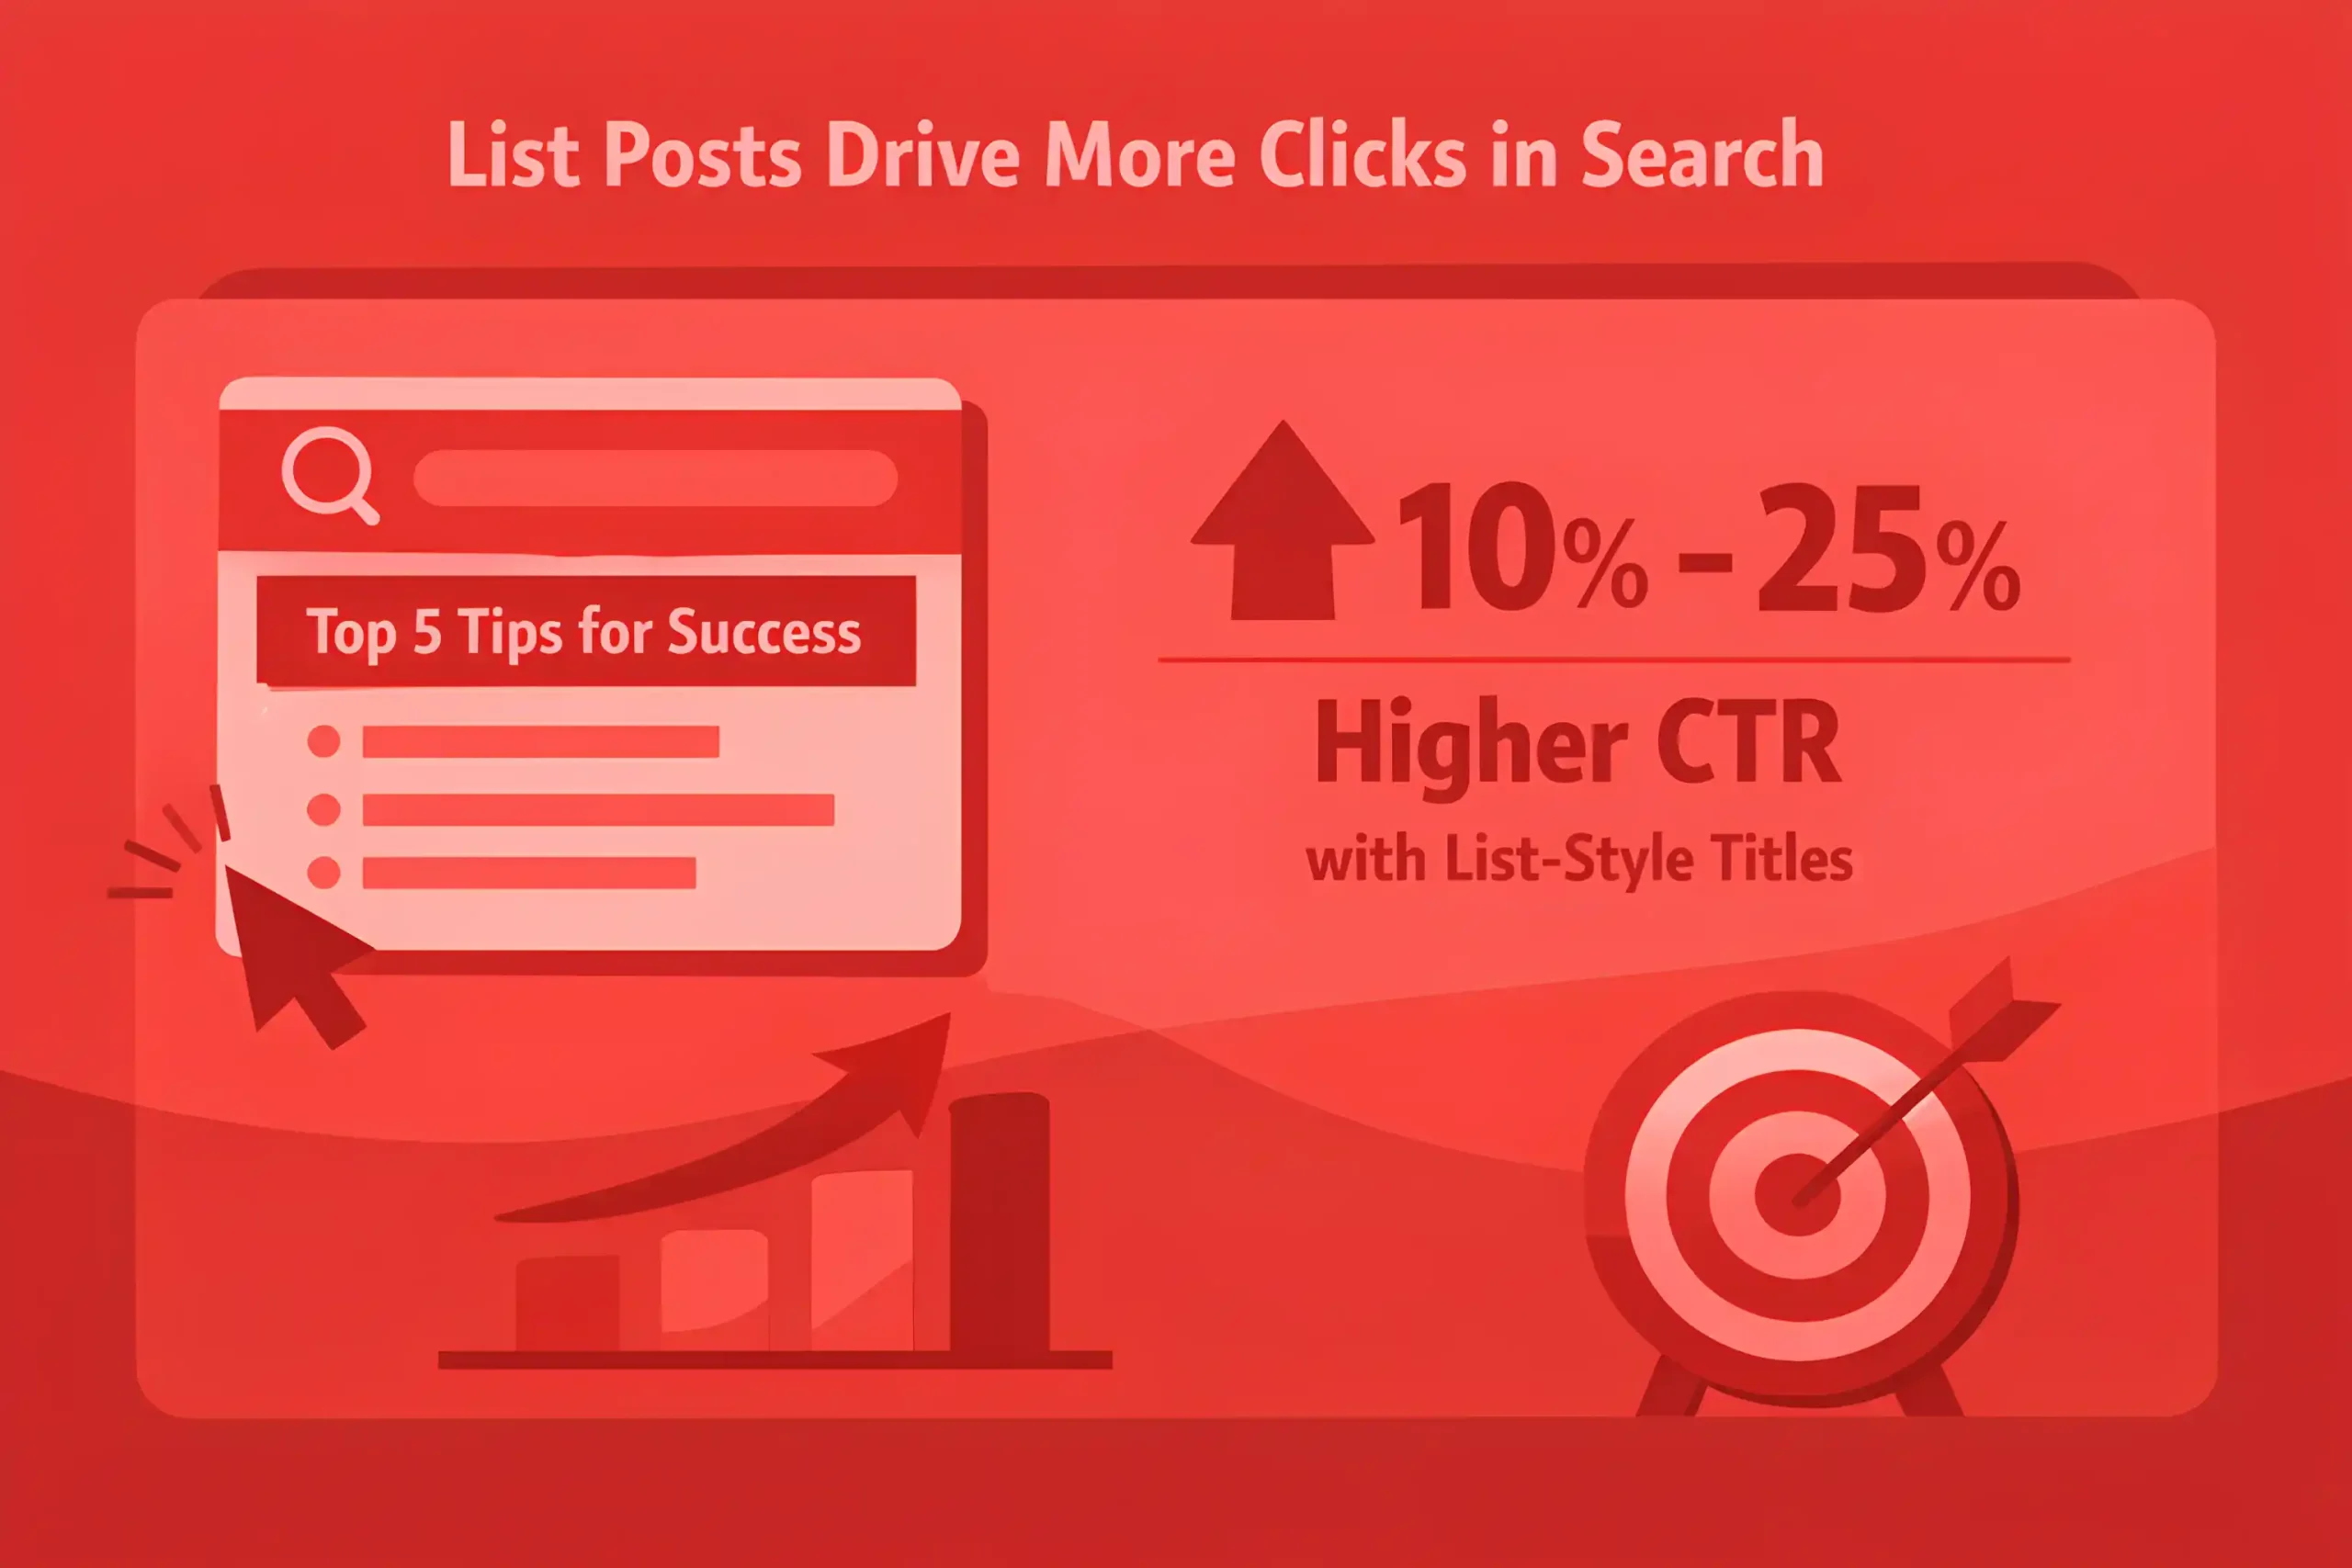
List-style posts often see 10% to 25% higher CTR from search when titles match clear intent.
Original research pieces typically attract 2x to 6x more backlinks than opinion content because they give others something concrete to cite.
Case studies often convert 1.5x to 3x better than general blog content on high-intent pages.
Comparison pages frequently deliver 2x to 5x higher conversion rates than TOFU posts because the reader is already evaluating options, which pairs naturally with B2B SEO services.
Templates and checklists often produce 3x to 8x higher email capture rates than standard articles.
Webinars usually generate fewer total leads than blog content, but those leads often show 20% to 50% higher sales readiness.
Video on landing pages can lift conversions by 5% to 20% when it reduces friction and answers objections fast, especially on sites built for conversion with B2B web design.
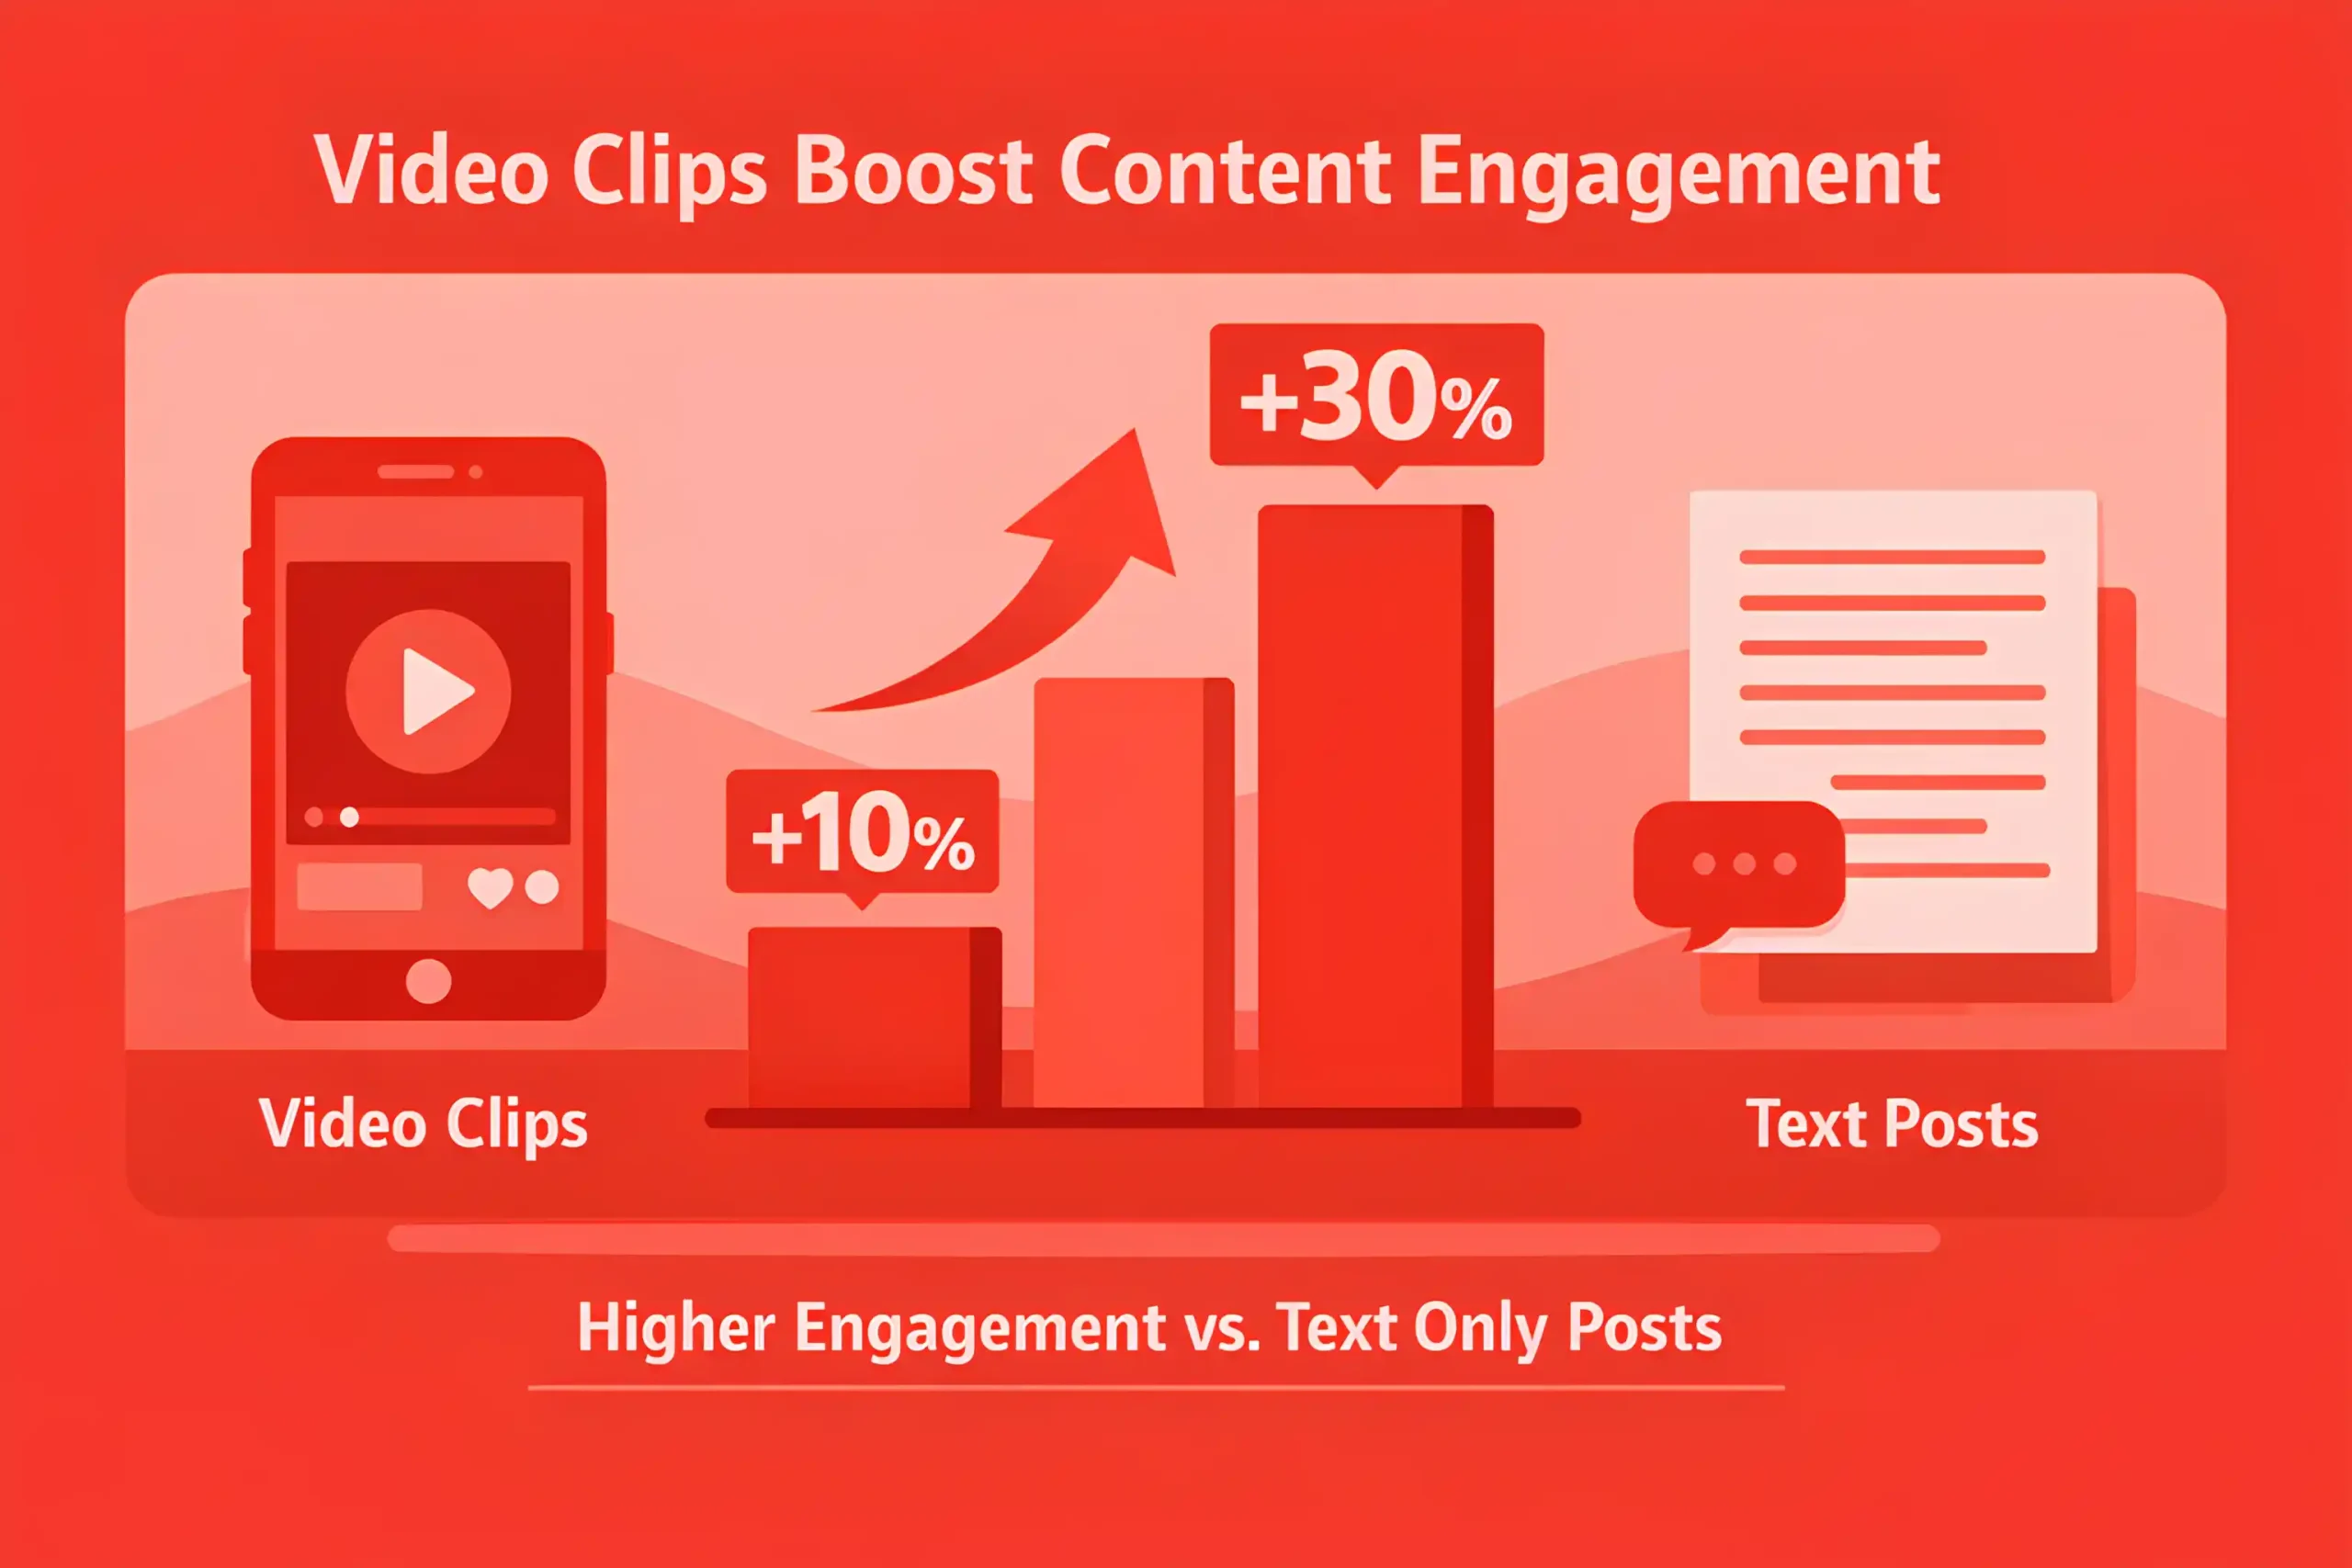
Short video clips used for distribution often raise content consumption by 10% to 30% compared to text-only social posts.
Carousels and slide posts commonly drive 15% to 40% higher saves and shares than single-image posts in professional feeds when managed through social media marketing services.
Podcasts build trust well, but attribution is slower, with most impact showing up after 3 to 6 months of consistent publishing.
Interactive tools often outperform static content, with conversion lifts of 20% to 60% when the tool solves a real calculation or decision.
Gated assets usually reduce total leads by 20% to 50% but improve lead quality by 10% to 30%.
Ungated assets often drive more organic links and shares, lifting top of funnel growth by 10% to 25% over time.
Repurposing one strong asset into multiple formats often increases total distribution reach by 2x to 5x without increasing research effort.
Updating an existing piece into a new format often delivers 15% to 35% incremental performance versus publishing a new topic from scratch.
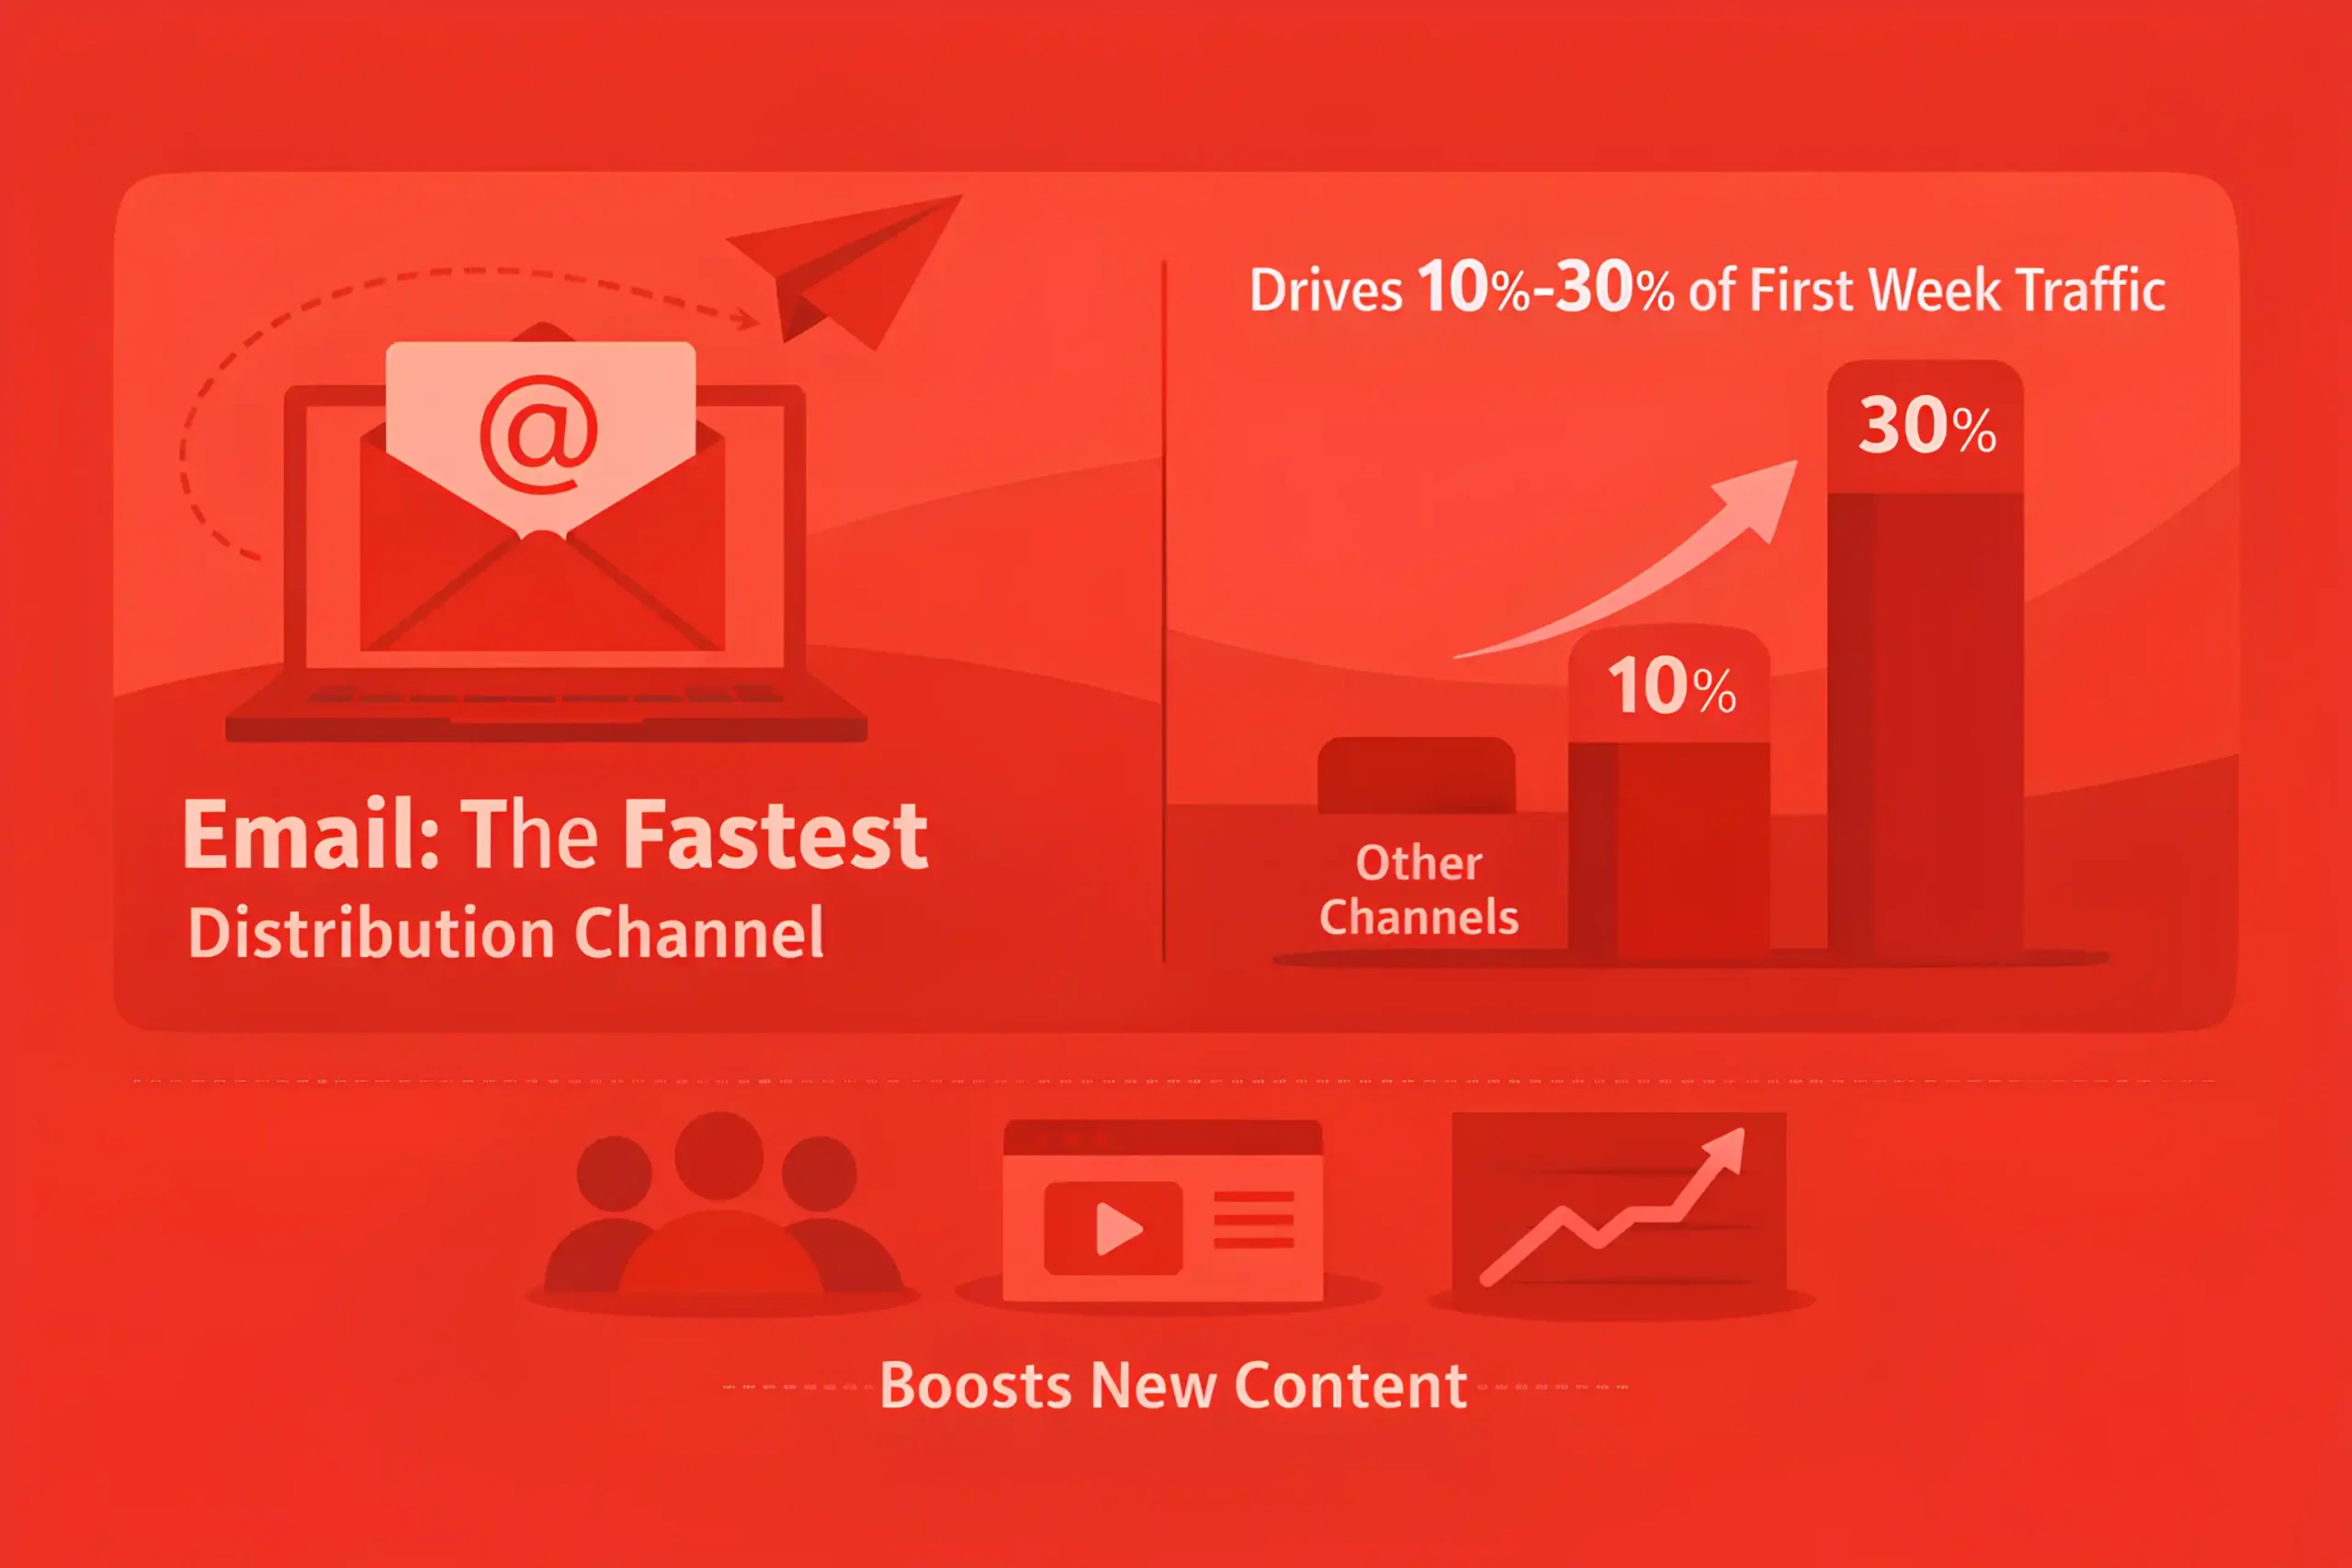
Email distribution commonly contributes 10% to 30% of total traffic to new content in the first week after publication.
Paid distribution used selectively can shorten the time to traction by 30% to 60% for new formats and new topics through programmatic advertising.
High-performing programs usually treat formats as a portfolio and push 60% to 80% of effort into the few formats that consistently convert.
You might also like: 100+ Reputation Management Statistics
Distribution and Promotion Benchmarks
Organic reach from social alone is often inconsistent, so most teams treat it as amplification, not the primary engine, which lines up with the social media marketing statistics.
Email is usually the fastest owned distribution lever, commonly driving 10% to 30% of first week traffic to new content.
Internal linking and homepage modules often generate 15% to 40% of early pageviews for fresh posts on established sites.
Syndication can add 5% to 20% incremental reach, but it works best when it sends a clear click path back to the original asset and reinforces a consistent brand.
Partner newsletters and comarketing swaps often deliver smaller volume, but higher intent, with conversion lifts of 10% to 40% versus broad social.
Community posts in niche groups usually drive low-scale traffic, yet strong engagement, often improving time on page by 10% to 30%.
Founder-led distribution can outperform brand channels, with 1.5x to 3x higher engagement in many B2B categories.
A strong repurposing system often increases total reach 2x to 5x per asset by turning one piece into multiple cuts.
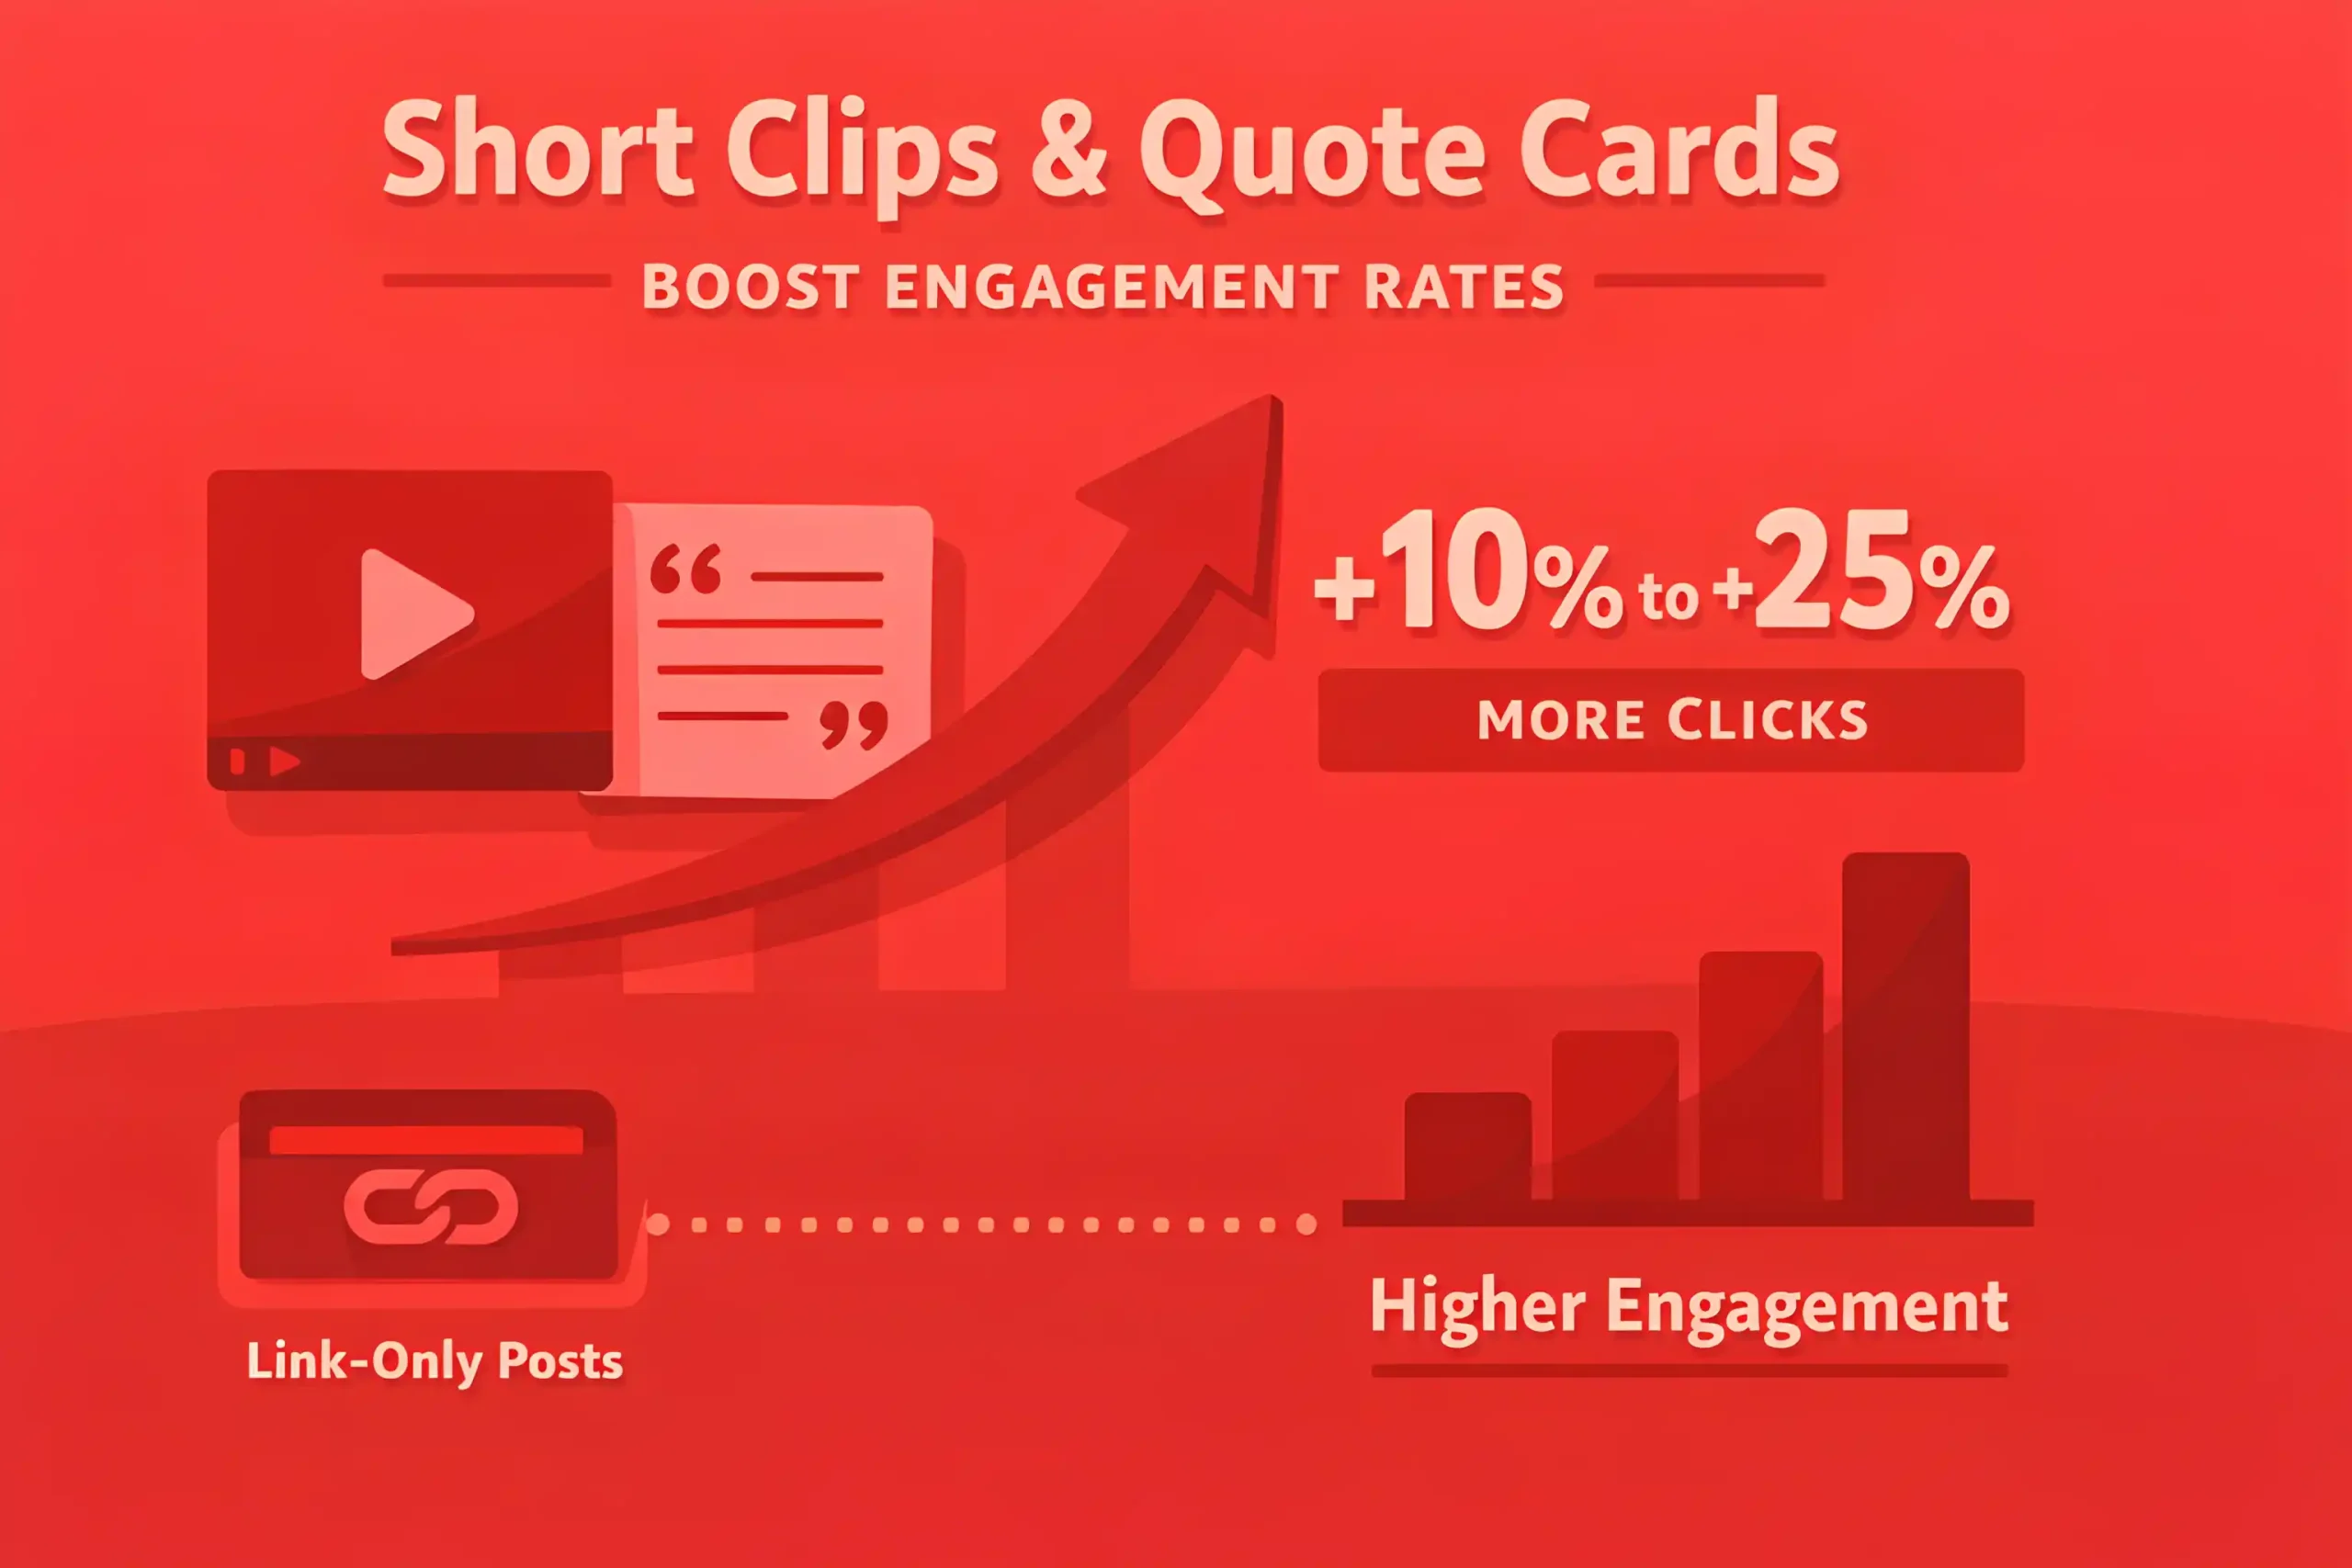
Short clips and quote cards often raise clicks by 10% to 25% compared to link-only posts.
Posting the same asset multiple times across weeks often increases total clicks by 20% to 60% because audiences do not see everything on the first pass.
Paid promotion used selectively can shorten the time to traction by 30% to 60%, especially for new formats or new topics, which is a common use case for SaaS PPC.
Retargeting readers with a follow-up offer often lifts conversion rates by 10% to 35% compared to cold promotion.
PR-driven links can accelerate rankings, with visible impact often appearing within 2 to 8 weeks on borderline page-one pages.
A single high-quality link can move results more than dozens of low-value mentions, especially for competitive queries.
The most effective distribution mix often includes at least 3 to 5 channels per asset rather than relying on one source.
Teams that plan distribution before writing often improve early performance by 15% to 30% because the asset fits channel constraints.
Publishing without a distribution plan commonly leaves 50% to 80% of potential reach unrealized.
Promotion cadence matters, and many teams see stronger results when they promote for 2 to 6 weeks, not just launch week.
Content that earns early engagement signals often gets compounding lift, with 20% to 50% of lifetime traffic arriving after the initial push.
A simple benchmark many teams use is to spend 30% to 60% as much effort on promotion as on creation.
B2B vs B2C Content Marketing Benchmarks and Funnel Metrics
B2B content usually has lower traffic ceilings per piece but higher value per conversion, while B2C often flips that equation.
B2B programs often see organic conversion rates around 0.3% to 2% from content sessions to a tracked lead action.
B2C ecommerce content commonly converts around 0.5% to 3% from content sessions to purchase, and that gap closes fastest when the post-click experience is for speed and checkout clarity with a Shopify web design agency.
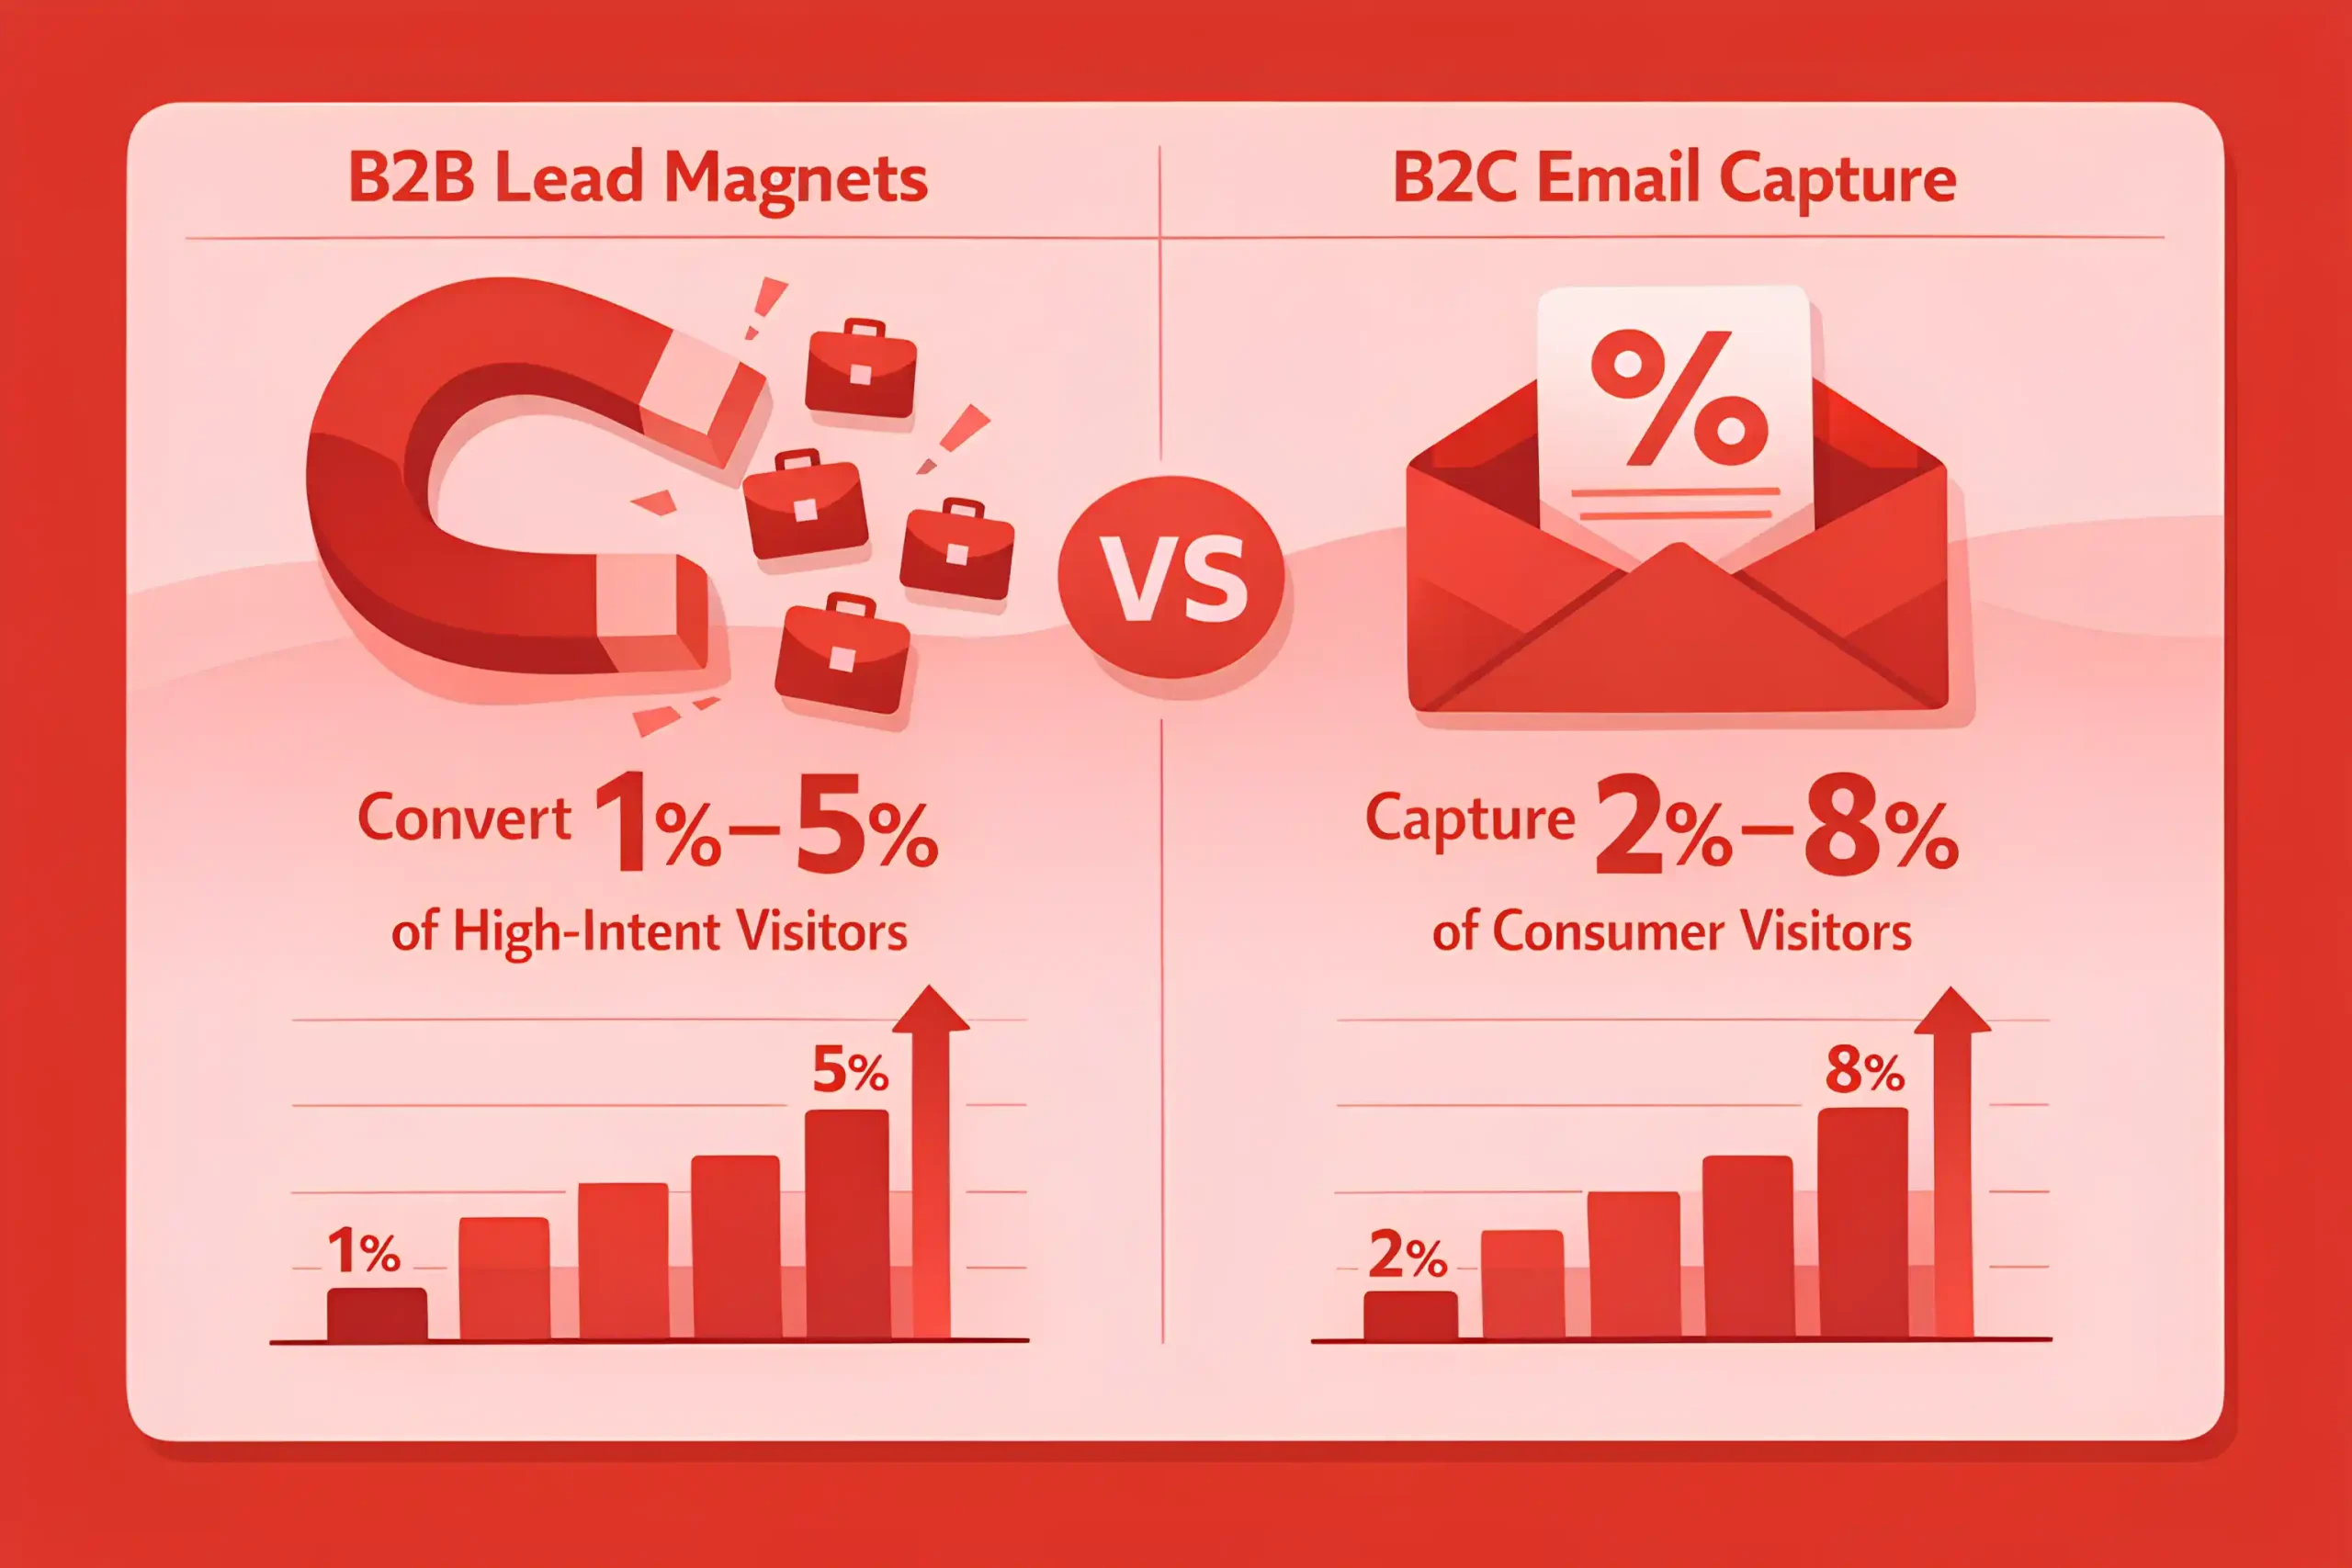
B2B lead magnets often convert 1% to 5% of visitors on high-intent pages, while B2C email capture offers often land in the 2% to 8% range.
In B2B, newsletter signups are frequently the primary conversion on TOFU content, accounting for 40% to 70% of tracked conversions from blog traffic.
In B2C, product discovery content often drives assisted conversions, with 10% to 30% of purchases influenced by non-product pages when attribution is measured across multiple sessions.
B2B nurture cycles are longer, and it is common for 30% to 60% of content generated leads to convert outside the first month.
B2C purchase cycles are shorter, with 50% to 80% of content-influenced purchases happening within 7 to 30 days of first touch.
B2B mid-funnel assets like comparisons and case studies often convert 2x to 5x better than general thought leadership posts.
B2C category guides and buyer’s guides often produce 1.5x to 3x higher revenue per visit than lifestyle content when intent is to drive purchase.
B2B demo or consultation rates from product content commonly fall around 1% to 4% of visitors once the page ranks, and that number is strongly tied to site architecture and integrations covered in enterprise web design.
B2C add to cart rates from content-referred sessions often sit around 2% to 8%, depending on pricing and product fit.
B2B sales acceptance rates for content leads often range from 10% to 30%, driven by targeting and lead routing.
B2C repeat purchase rate uplift from content plus email sequences often lands around 5% to 15% over a quarter.
B2B funnel drop off is steep early, with 60% to 85% of TOFU visitors never returning without retargeting or email capture.
B2C retargeting can recover a meaningful share, often lifting the returning visitor rate by 10% to 35% when offering match intent.
B2B content teams often measure success by influencing the pipeline, and 20% to 50% influence share is a common internal benchmark in mature reporting.
B2C teams more often benchmark by blended ROAS and assisted revenue, with content contributing 10% to 30% of assisted sales in attribution views.
B2B organic growth tends to be slower but steadier, often aiming for 3% to 10% month over month traffic growth early, then 1% to 5% at scale.
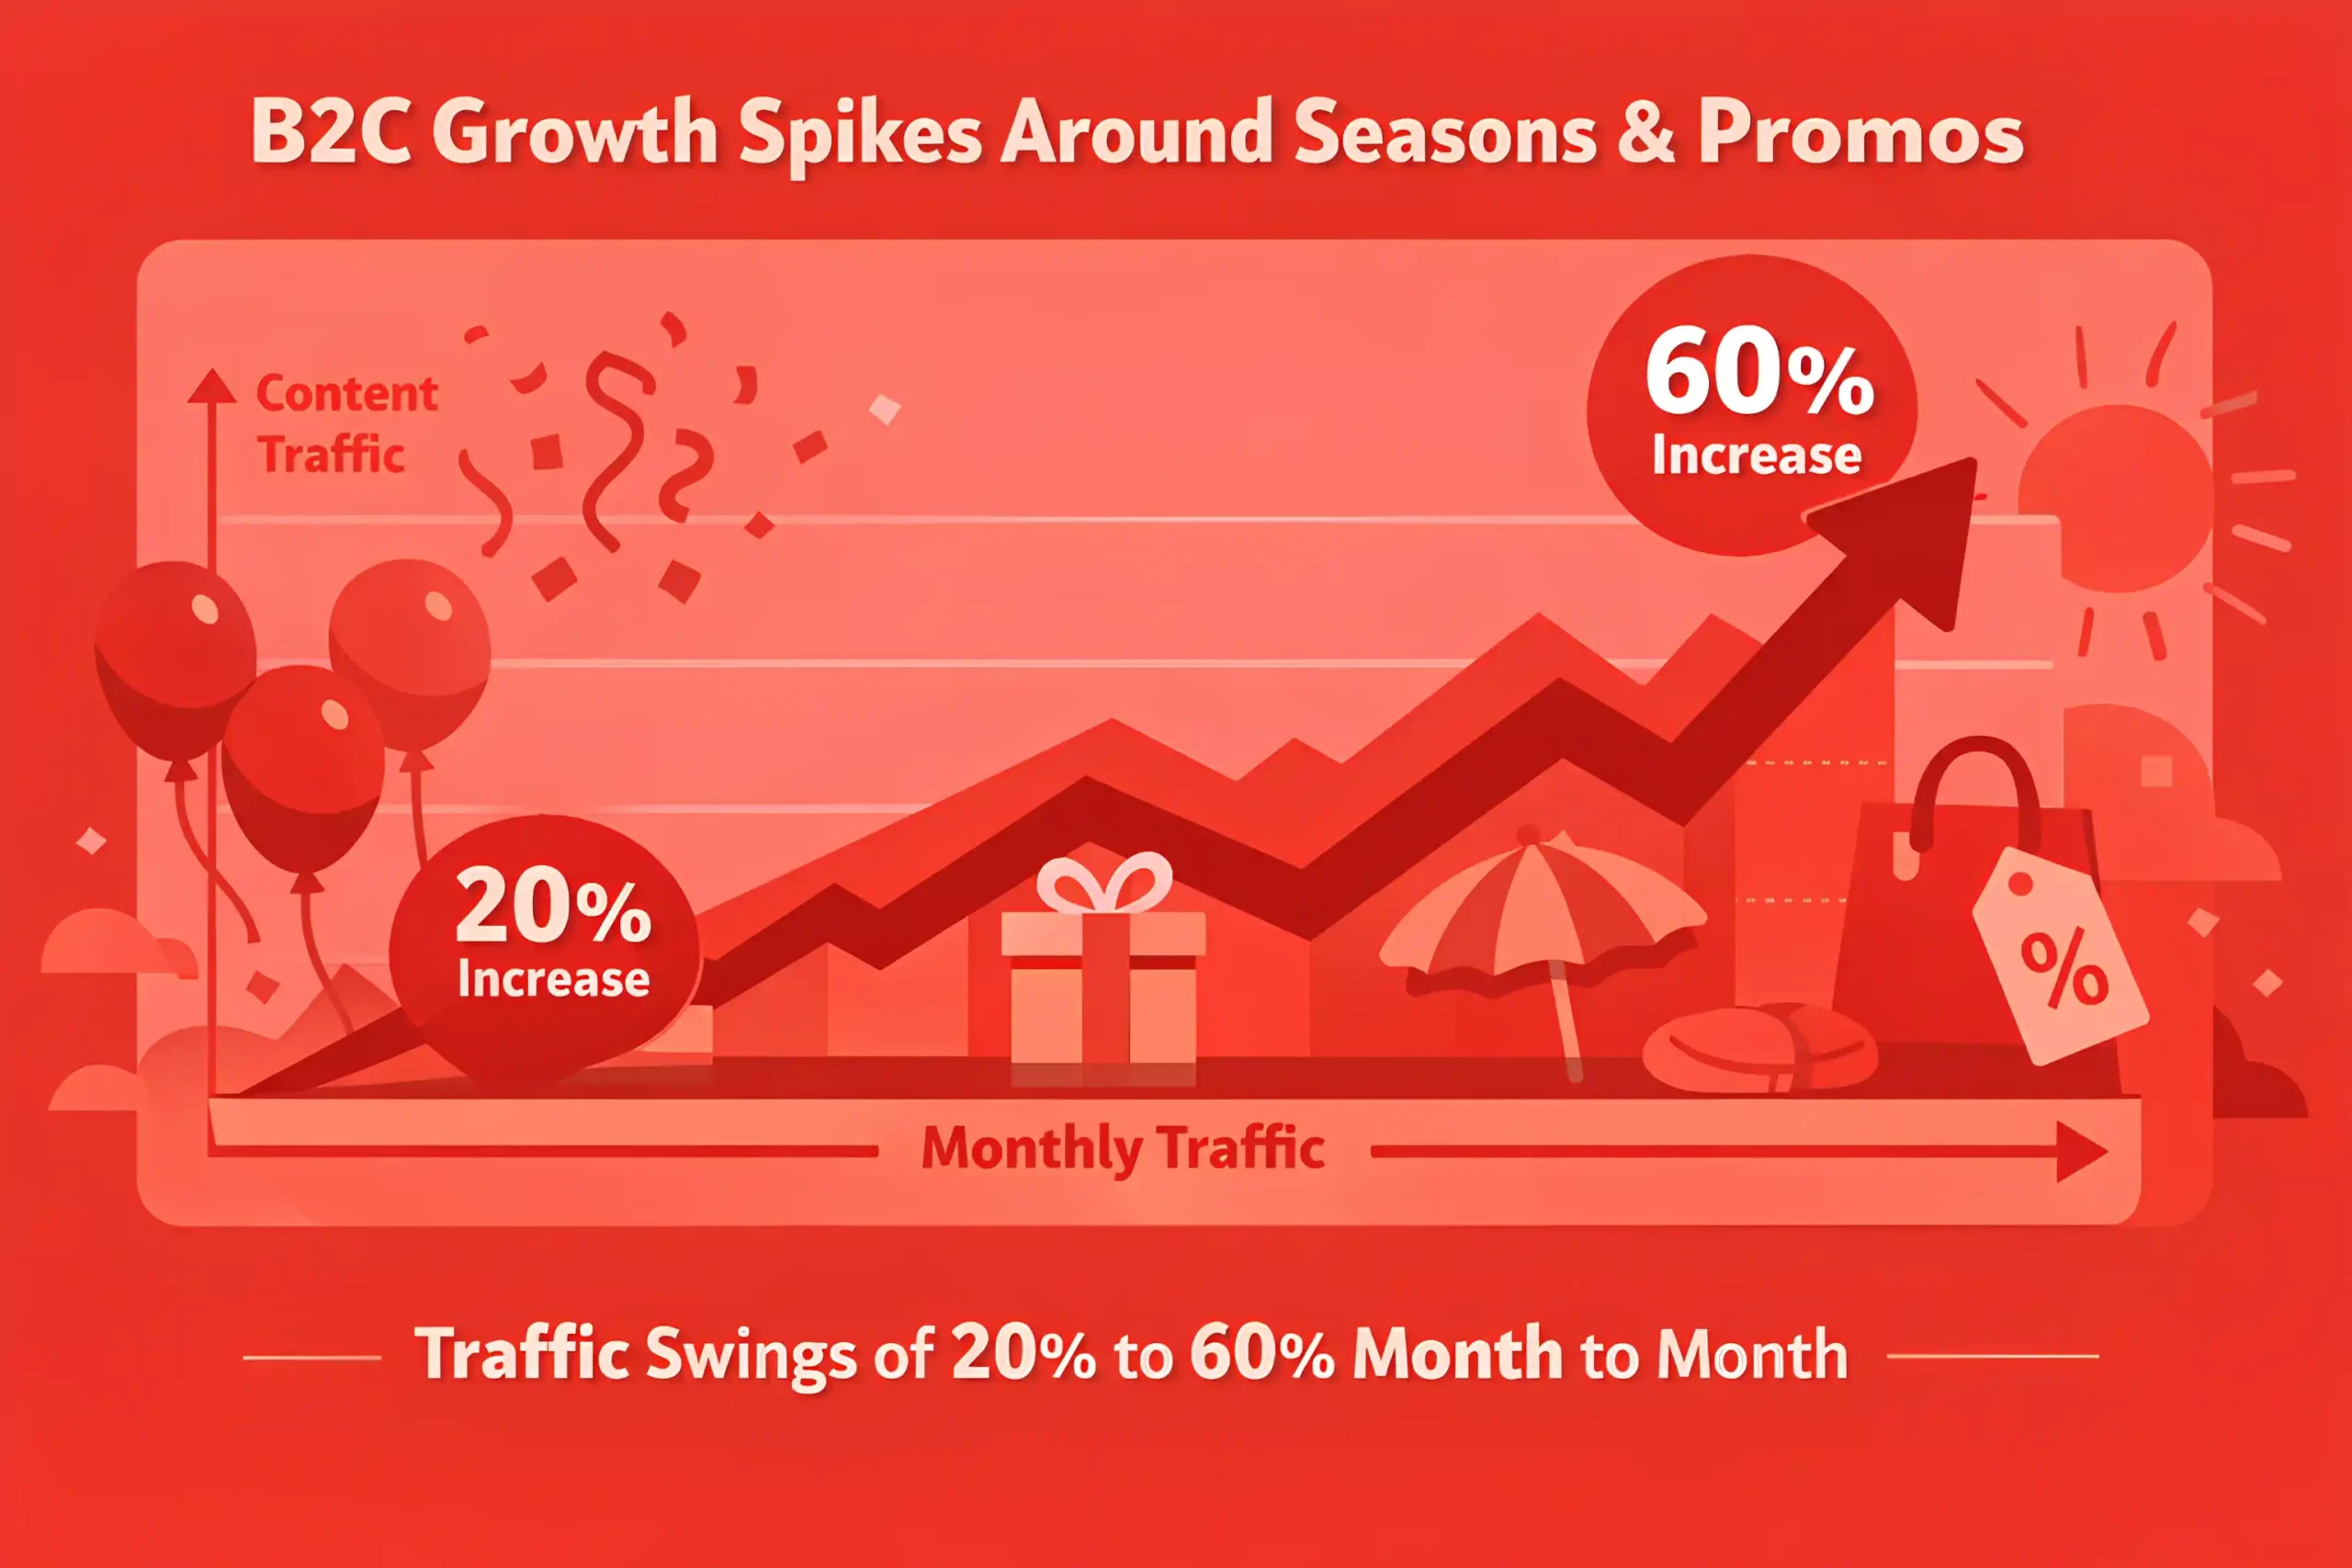
B2C growth can spike harder around seasons and promos, with content traffic swings of 20% to 60% month to month not unusual.
The Key Takeaways
Content marketing in 2026 rewards focus, and the same applies to teams investing in content marketing services. Publishing more rarely fixes performance on its own. The teams that improve fastest are the ones that treat content like a system: clear audience, clear intent, and clear measurement tied to pipeline, revenue, or retention.
Still, content does not win on quality alone. Distribution, internal linking, and smart repurposing decide how far an asset travels, while technical hygiene and updates decide how long it keeps earning. In most libraries, a small set of pages drives most results, so improving what already performs usually beats chasing new topics.
Use the statistics in our guide as a decision tool. Set realistic targets, spot where traffic or engagement drops off, and choose investments that pay back over time. If a metric does not change your next action, remove it and keep the reporting clean.