
A few years ago, digital PR felt like a link play. Publish a campaign, pitch reporters, count pickups, move on. In 2026, everything looks different. Newsrooms are smaller, attention is split across search, social, and creator feeds, and a story can travel farther than the outlet that published it.
At the same time, brands still need proof. Leadership wants coverage that drives demand, not a screenshot in a recap deck.
Our updated collection on NEWMEDIA.COM brings together 100+ digital PR statistics on outreach performance, media response, link impact, formats, creator partnerships, and measurement, helping teams set realistic expectations, pick tactics that fit the market, and report outcomes that hold up under scrutiny.
Digital PR Impact on Brand Awareness, Trust, and Reputation
Earned coverage often lifts branded search demand by 10% to 40% within 7 to 30 days.
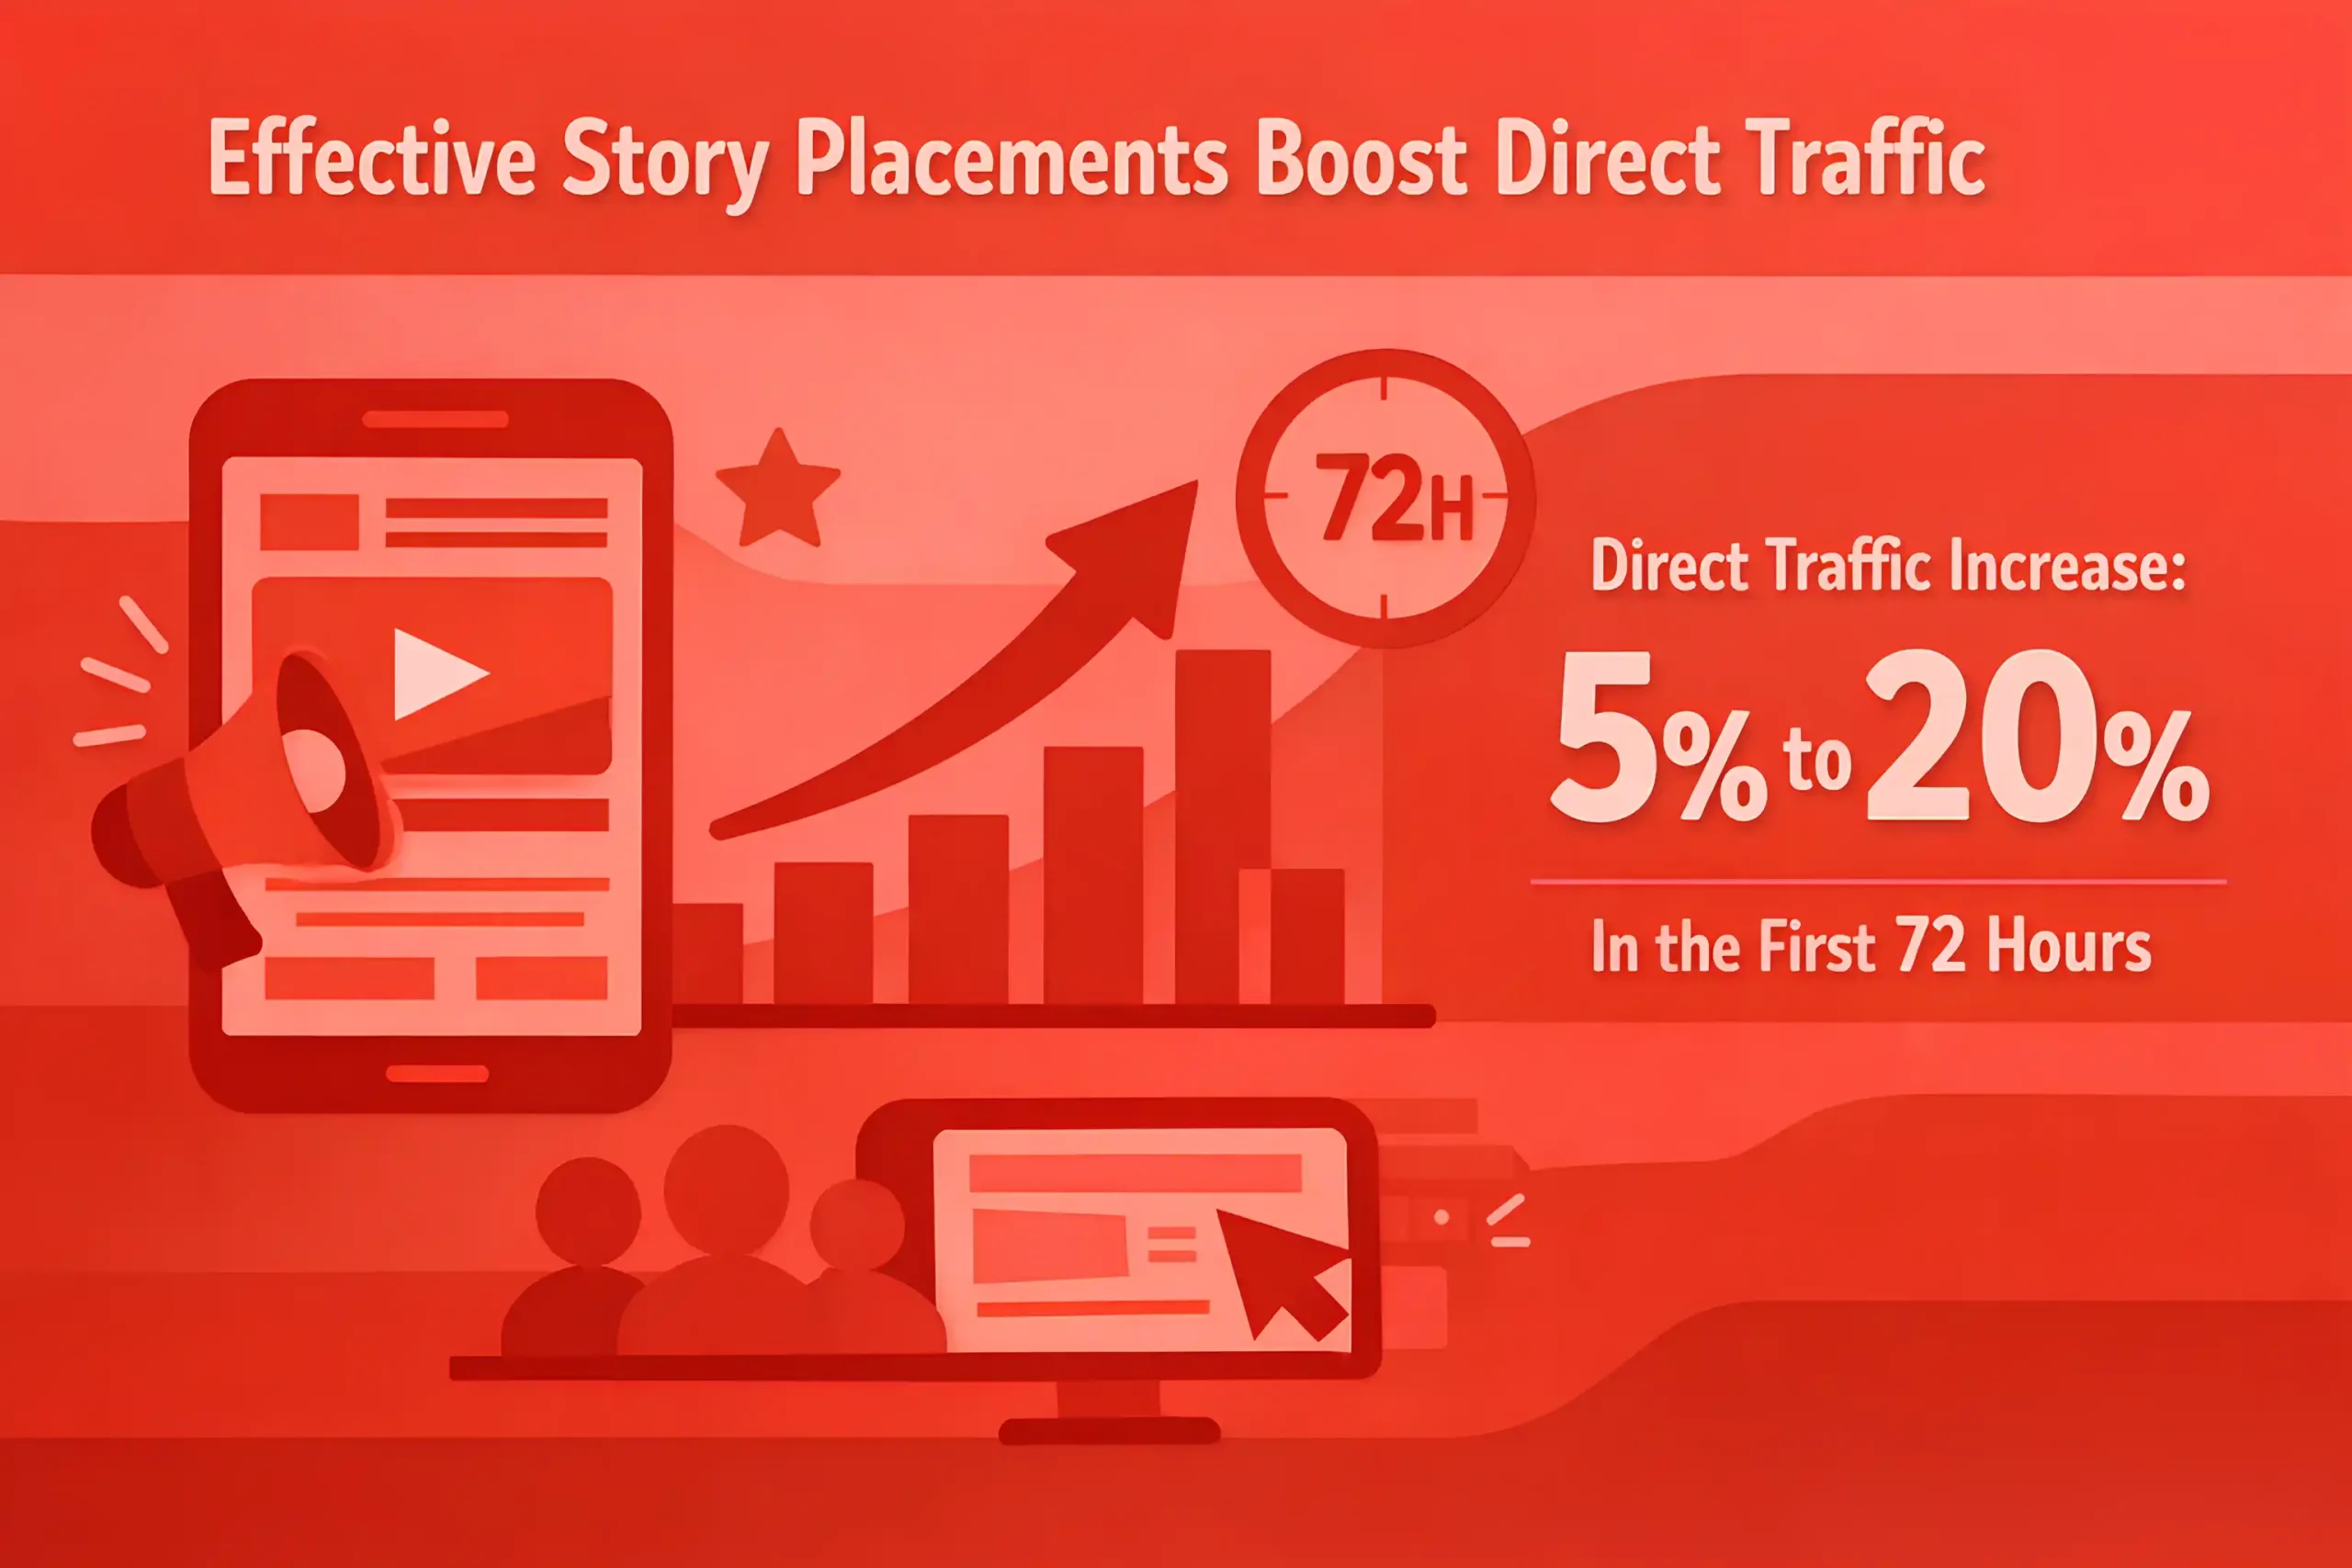
Strong story placements can increase direct traffic by 5% to 20% during the first 72 hours.
Audience reach from a single campaign is usually concentrated, with the top 3 placements driving 50% to 75% of referral visits, which is why distribution planning is integrated into marketing strategy.
Brand recall commonly improves by 5 to 15 points when exposure repeats across multiple outlets in a short window.
Trust tends to rise more from credible third-party mentions than from paid ads, and brands often protect that lift through reputation management.
Positive coverage paired with consistent messaging can improve favorability by 5% to 18% over a quarter.
Digital PR linked to a clear proof point often lifts consideration by 4% to 12%, especially in high trust categories.
Reputation improvements often show up first in reduced negative sentiment, with declines of 10% to 30% after consistent narrative work.
Share of voice gains of 5 to 20 points often correlate with stronger brand recall, especially when competitors stay quiet.
A visible stream of earned mentions can reduce perceived risk, cutting sales cycle length by 5% to 15% in B2B motions.
For employer brand, credible coverage can increase qualified applicant volume by 10% to 35% in the following month.
When a story gets repeated by creators and communities, total impressions often expand by 2x to 6x versus publisher reach alone.
Reputation damage compounds quickly, and delays in response beyond 24 hours often increase negative coverage volume by 15% to 40%.
A clear corrective statement plus supporting proof often reduces the negative share of voice by 10% to 25% within 2 to 6 weeks.
Brands with consistent third-party validation often see higher conversion rates on product pages, commonly 3% to 12% lift, when proof is placed and tested through conversion rate optimization.
Earned trust signals can improve email signup rates by 5% to 20% when coverage is referenced near the form.
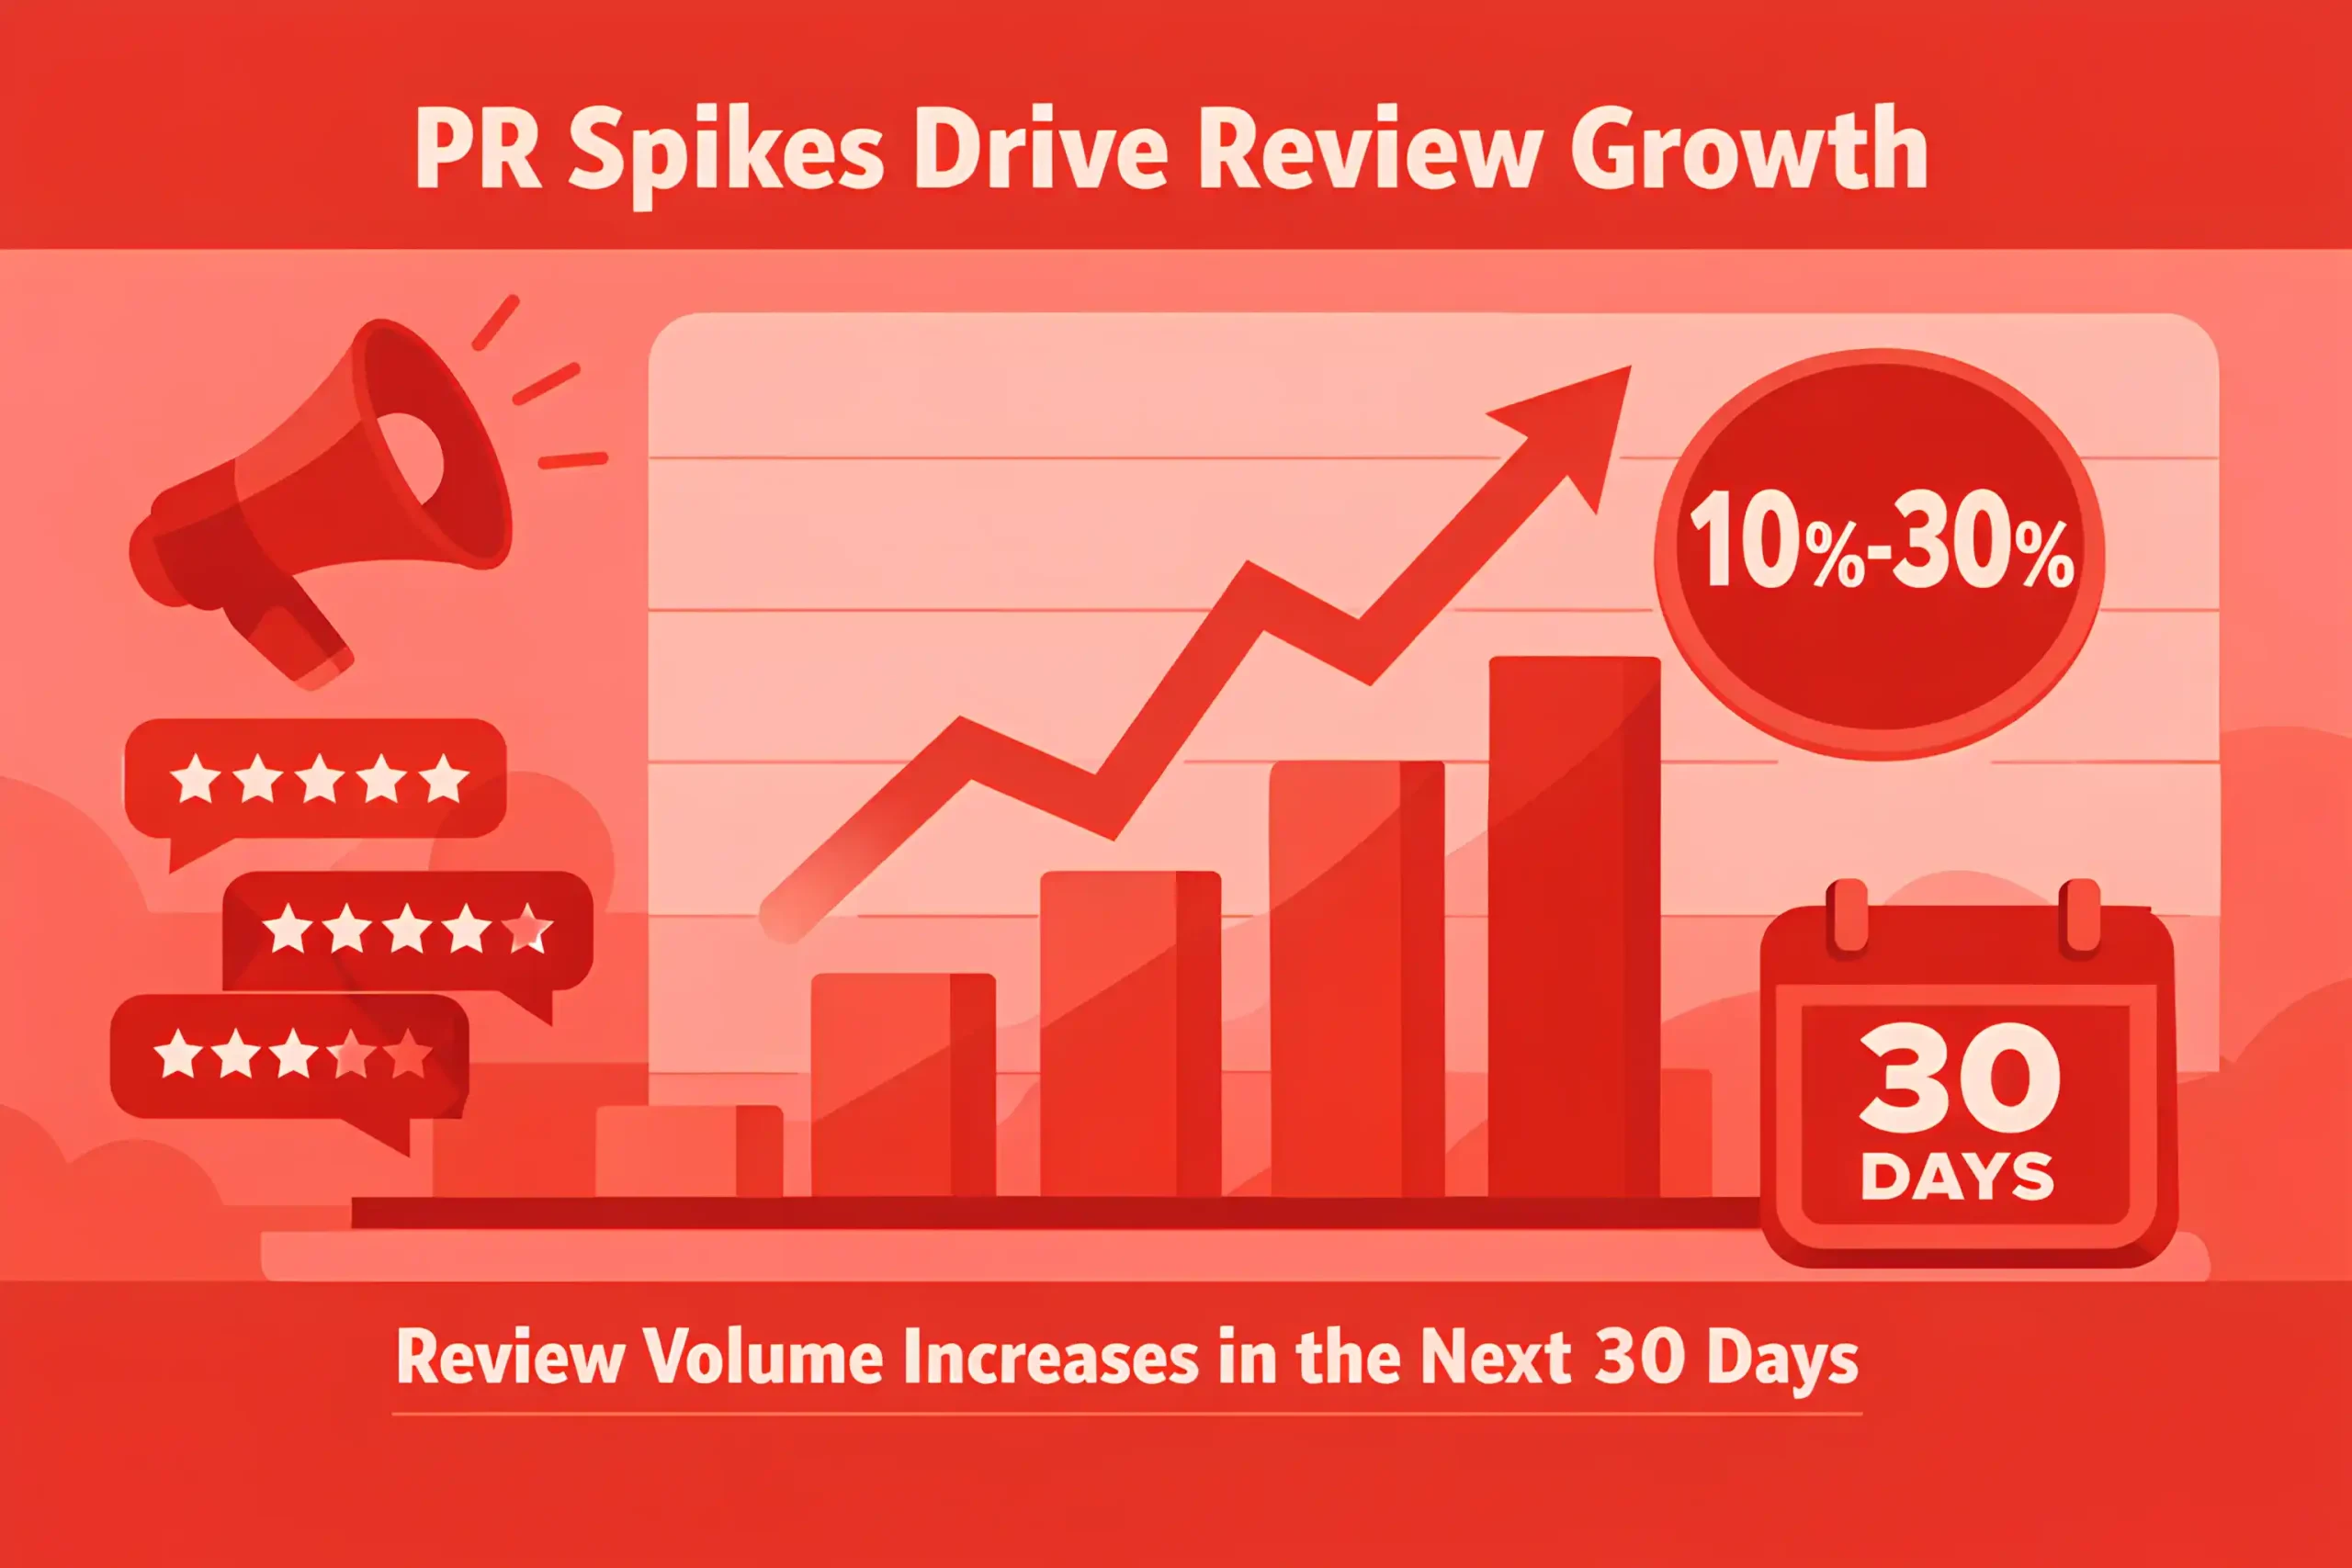
For review categories, PR spikes often lead to review volume increases of 10% to 30% over the next 30 days.
Reputation work tends to show the biggest impact in retention, with churn reductions of 2% to 8% when trust gaps close.
High-credibility placements usually outperform low credibility mentions, often generating 1.5x to 3x stronger lifts in trust and consideration.
Campaigns that connect coverage to a measurable brand promise often improve the long-term brand search baseline by 5% to 15% after the spike fades.
Also explore: 250+ Digital Marketing Statistics
SEO & Link Results From Digital PR
Digital PR campaigns often generate 5 to 30 referring domains per story when the angle is newsworthy and data-backed.
A single top-tier placement can drive 20% to 50% of total links from a campaign through syndication and secondary pickups, and that link concentration is why SEO services are effective.
Link velocity spikes are common, with campaigns earning 30% to 70% of total links in the first 7 days.
Follow link share from earned media often lands around 30% to 60%, depending on publisher policies.
Lower-tier pickups tend to deliver more links, but top-tier placements often deliver stronger ranking impact per link.
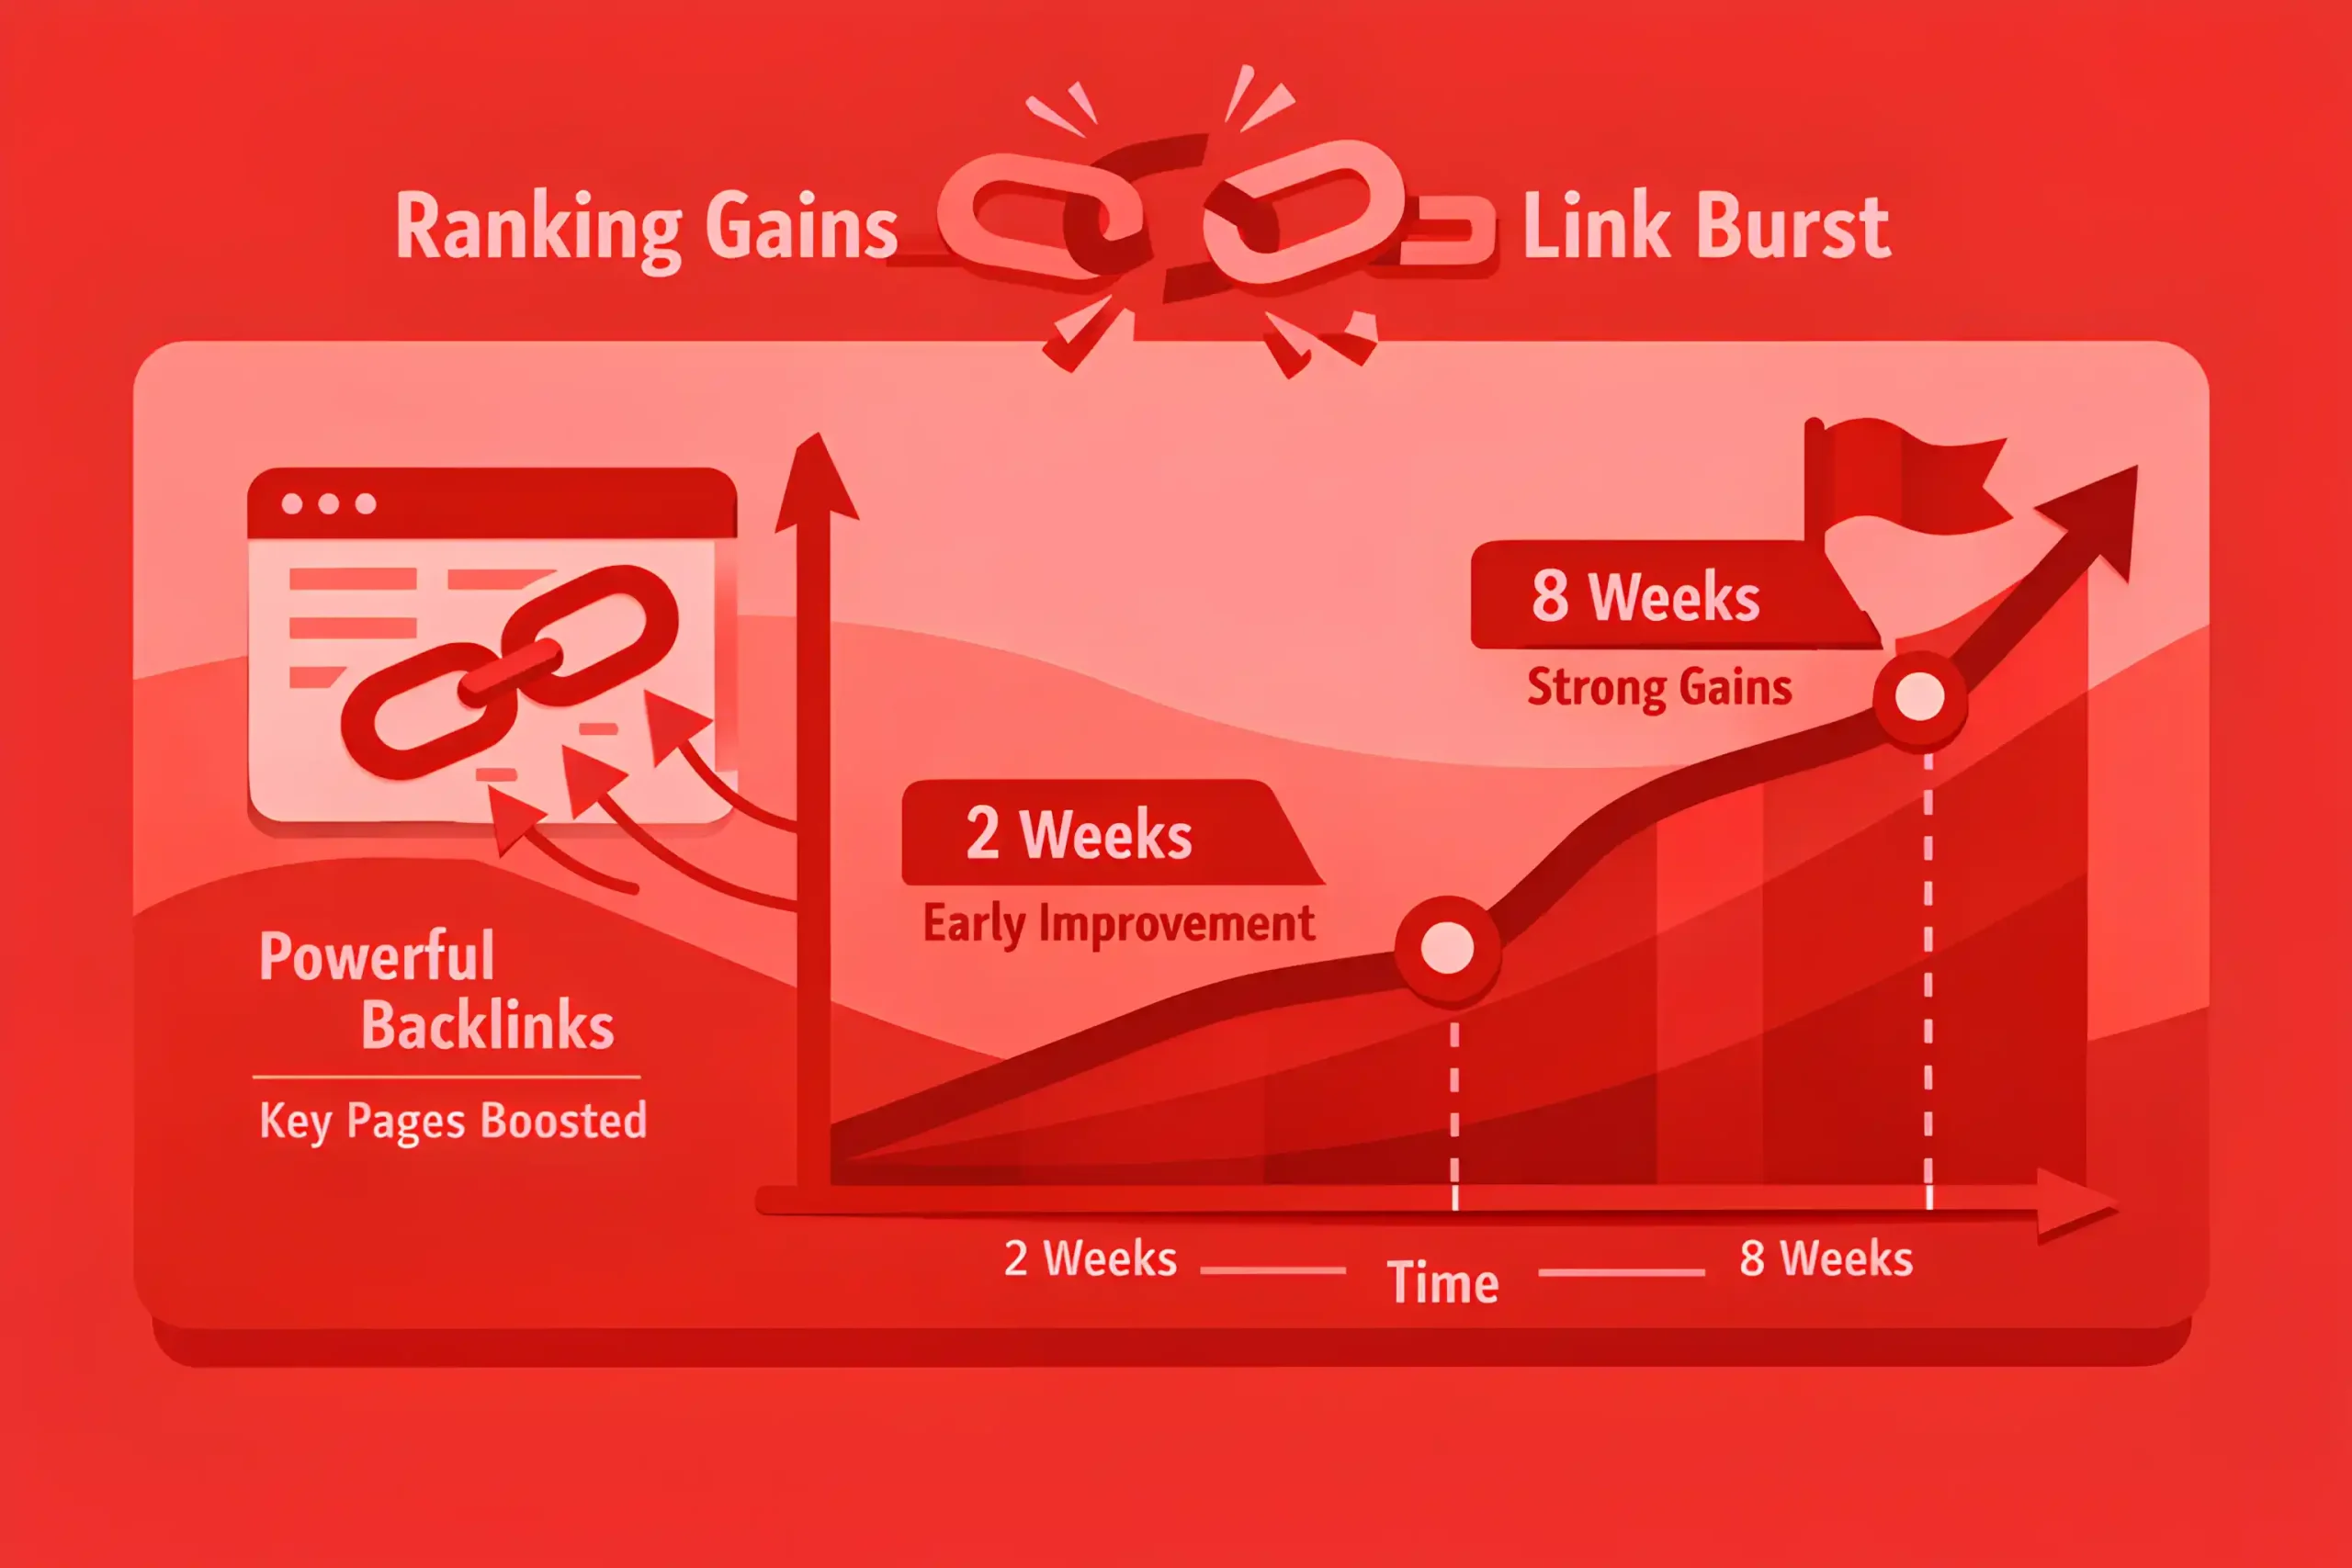
Sites often see measurable ranking movement within 2 to 8 weeks after a strong link burst hits key pages, especially on pages near page one, which is also a common pattern in enterprise SEO.
Pages on the edge of page one often see the fastest gains, commonly 2 to 6 position improvements after high-quality links.
Digital PR links pointed at a hub page often lift related cluster pages, with organic traffic up 5% to 20% across the group.
Branded search demand often rises 10% to 40% after coverage, and the uplift can support non-brand rankings indirectly.
Campaigns that earn links from diverse domains often outperform single-outlet heavy coverage, with a stronger lift by 10% to 25%.
Anchor text tends to be branded or URL-heavy, often 60% to 85% of earned links, which is usually safer for long-term SEO.
Deep links to product or feature pages are harder to win, and often make up only 10% to 30% of earned links without a strong product story, so many teams focus on linkable assets and then route authority through technical SEO.
Data-led campaigns often earn 2x to 6x more links than opinion pitches because other writers can cite the asset.
Rank improvements are more consistent when campaigns land 5 to 15 high authority domains rather than 50+ low-value mentions.
Referral traffic from earned links is often modest but high-intent, with conversion rates 10% to 30% higher than average organic.
Coverage that includes an embedded chart or asset often improves link retention, reducing link loss by 10% to 25% over time.
Unlinked brand mentions can outnumber linked mentions by 2x to 5x, creating a conversion target for link reclamation.
Digital PR often improves crawl discovery, with new pages indexed 10% to 30% faster when internal linking supports the PR landing page.
Campaigns paired with on-site updates often compound impact, with total organic lift 15% to 35% higher than PR alone.
The most reliable outcome is authority growth over time, with domain-level metrics improving gradually once campaigns run consistently for 3 to 6 months.
Also read: 100+ Reputation Management Statistics
Media Outreach Performance
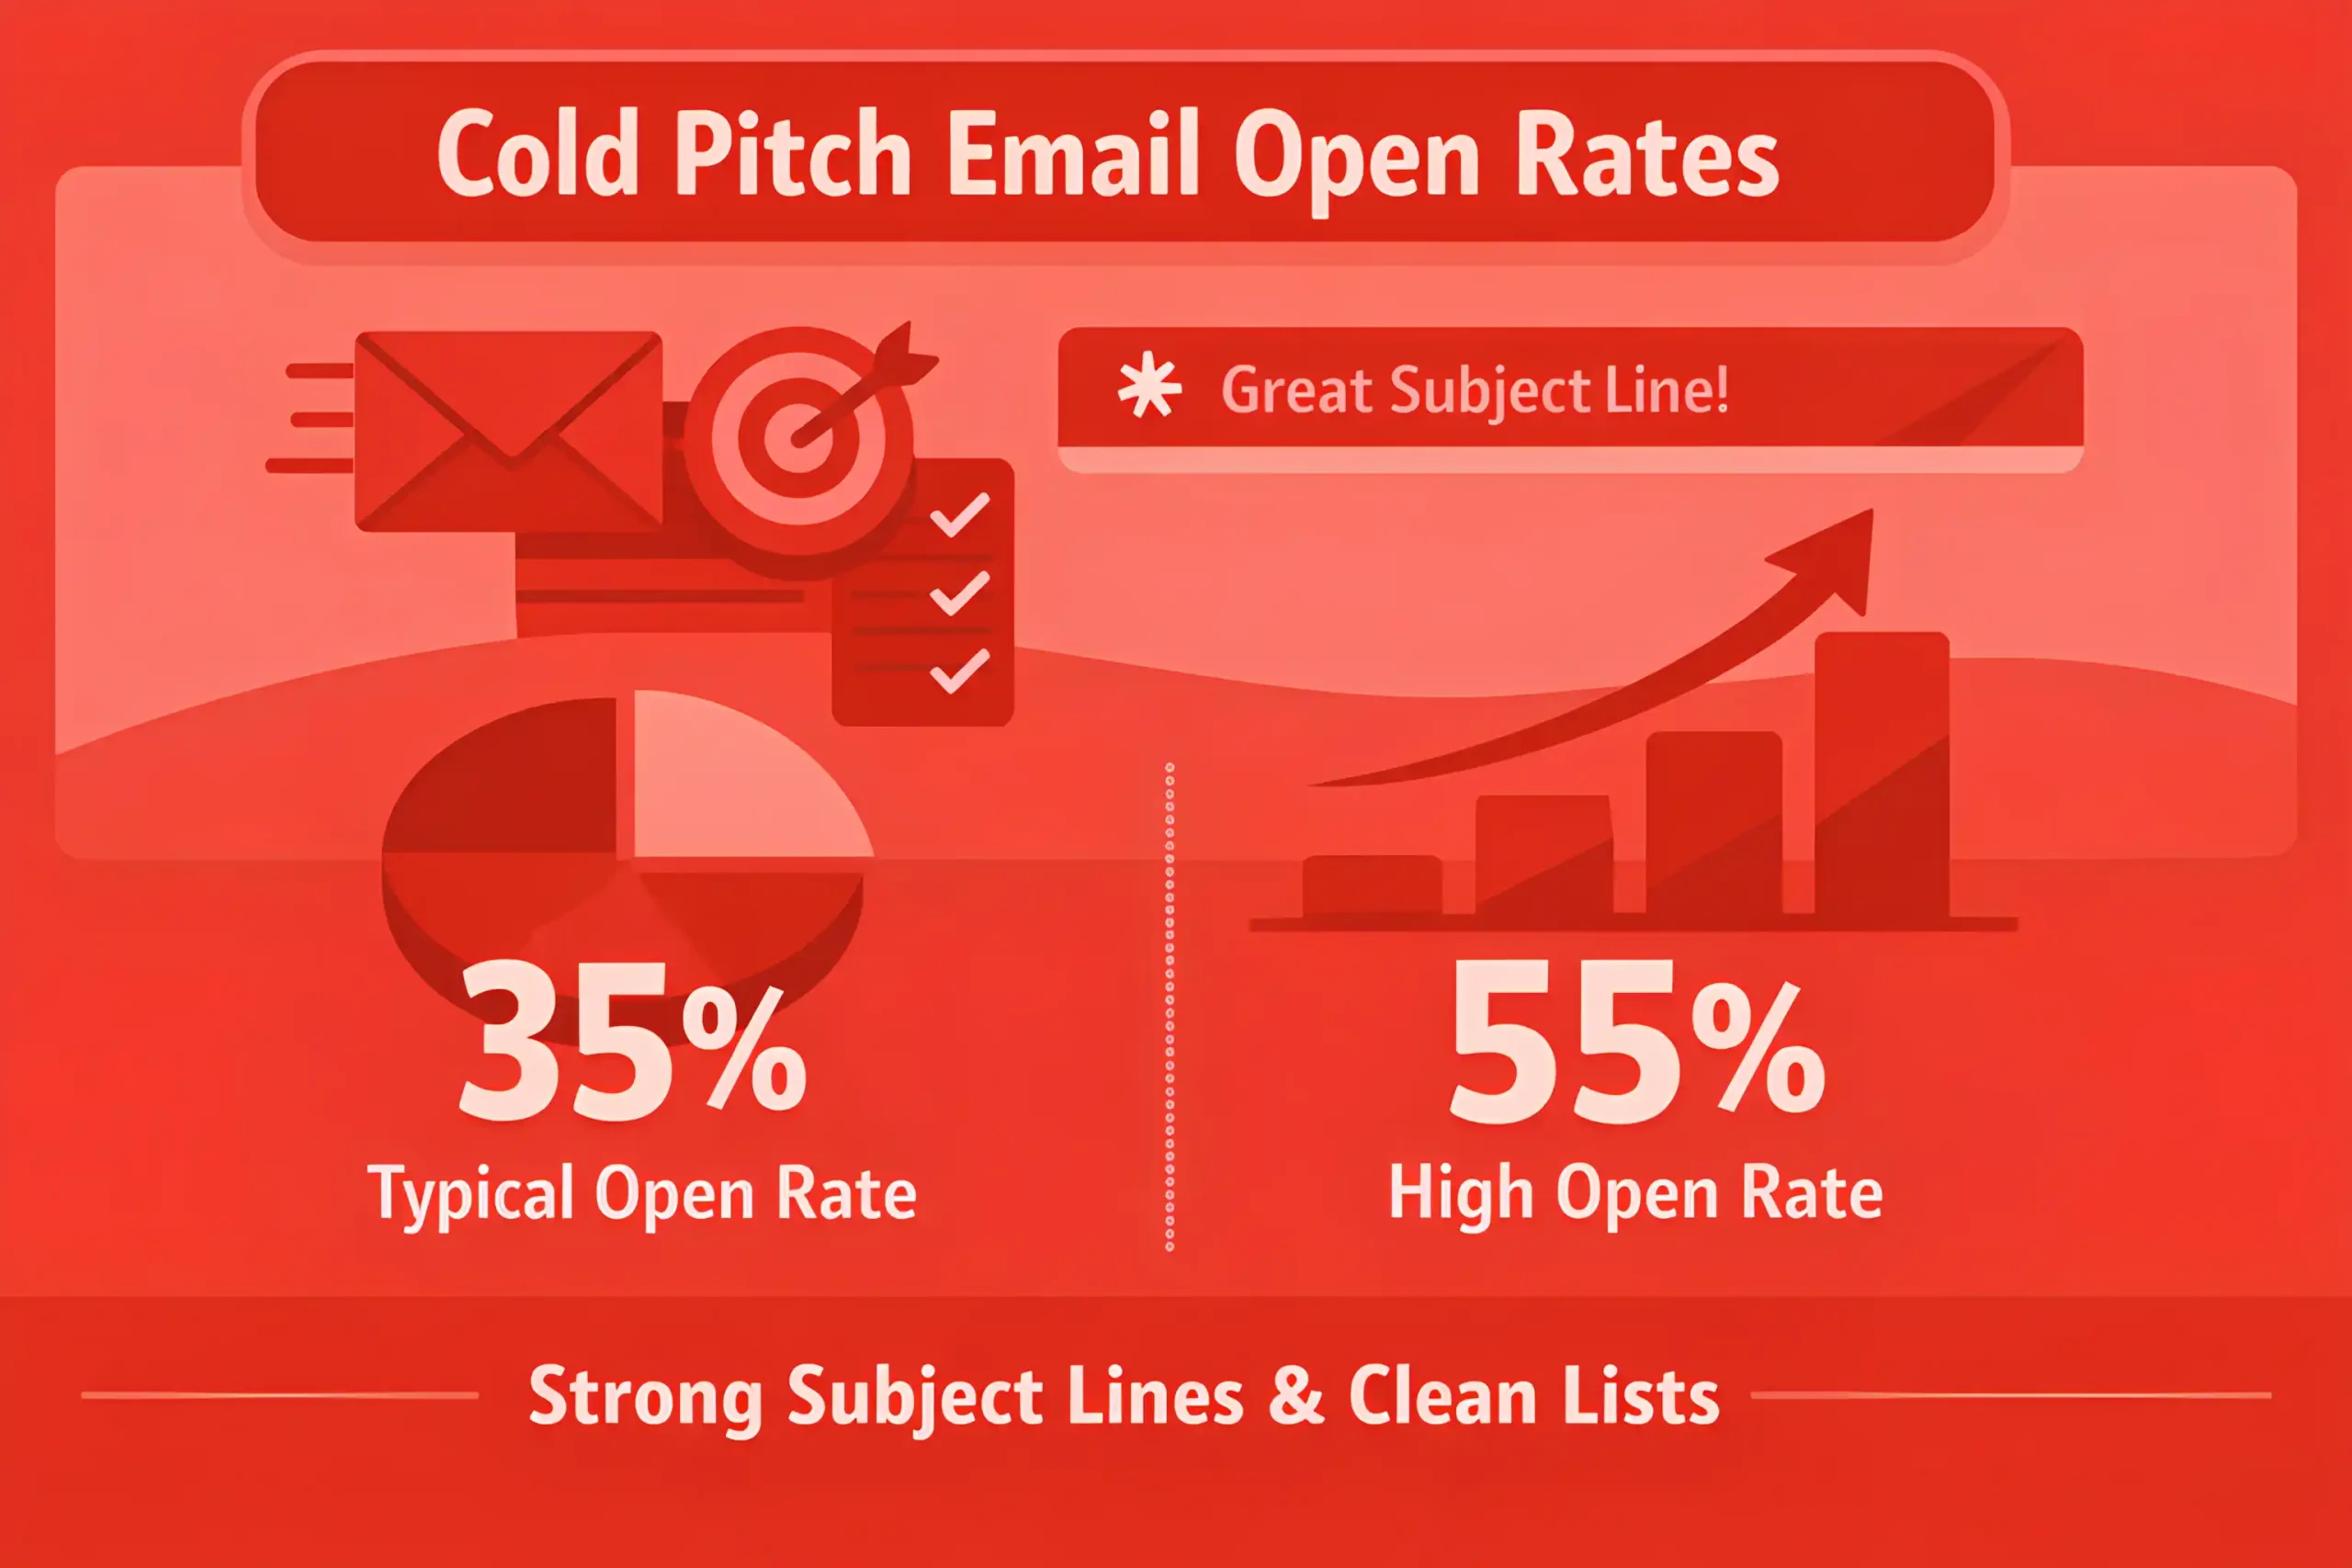
Cold pitch open rates commonly land around 35% to 55% when subject lines are tight, and lists are clean.
Reply rates on cold outreach often fall in the 3% to 12% range, depending on relevance and timing.
Positive reply rates tend to be lower, commonly 1% to 6% across broad campaigns.
Personalized pitches often outperform generic blasts, improving reply rates by 20% to 60%.
Follow-ups usually add incremental replies, often 15% to 35% of total responses coming from the second touch.
Most responses arrive quickly, with 60% to 80% landing within 48 hours of the first send.
Campaigns often see diminishing returns after 2 to 3 follow-ups, and unsubscribe or complaint risk rises.
Warm outreach to previously engaged journalists often converts better, with positive reply rates 2x to 4x higher than cold.
Pitches tied to original data or a timely hook often earn 1.5x to 3x higher pickup rates than commentary-only angles.
Exclusive offers can increase acceptance, with pickup likelihood up 10% to 25% when the outlet fit is strong.
Average time from pitch to publication often ranges from 3 to 14 days, but can stretch longer for features.
News cycle congestion can cut response rates by 10% to 30% during major events.
Early week pitching often performs better, with response rates 5% to 15% higher than late Friday sends.
Pitches sent outside business hours often see lower reply rates, commonly 10% to 25% below baseline.
Short, specific pitches usually perform best, and many teams tighten language and structure using content writing services.
Including a clear asset, like a chart or small dataset, often improves pickup rates by 10% to 20%.
Attachment-heavy emails can hurt deliverability, and link-only pitching often keeps inbox placement 5% to 10% higher, which becomes easier when the asset lives on a fast, clean page built with web design services.
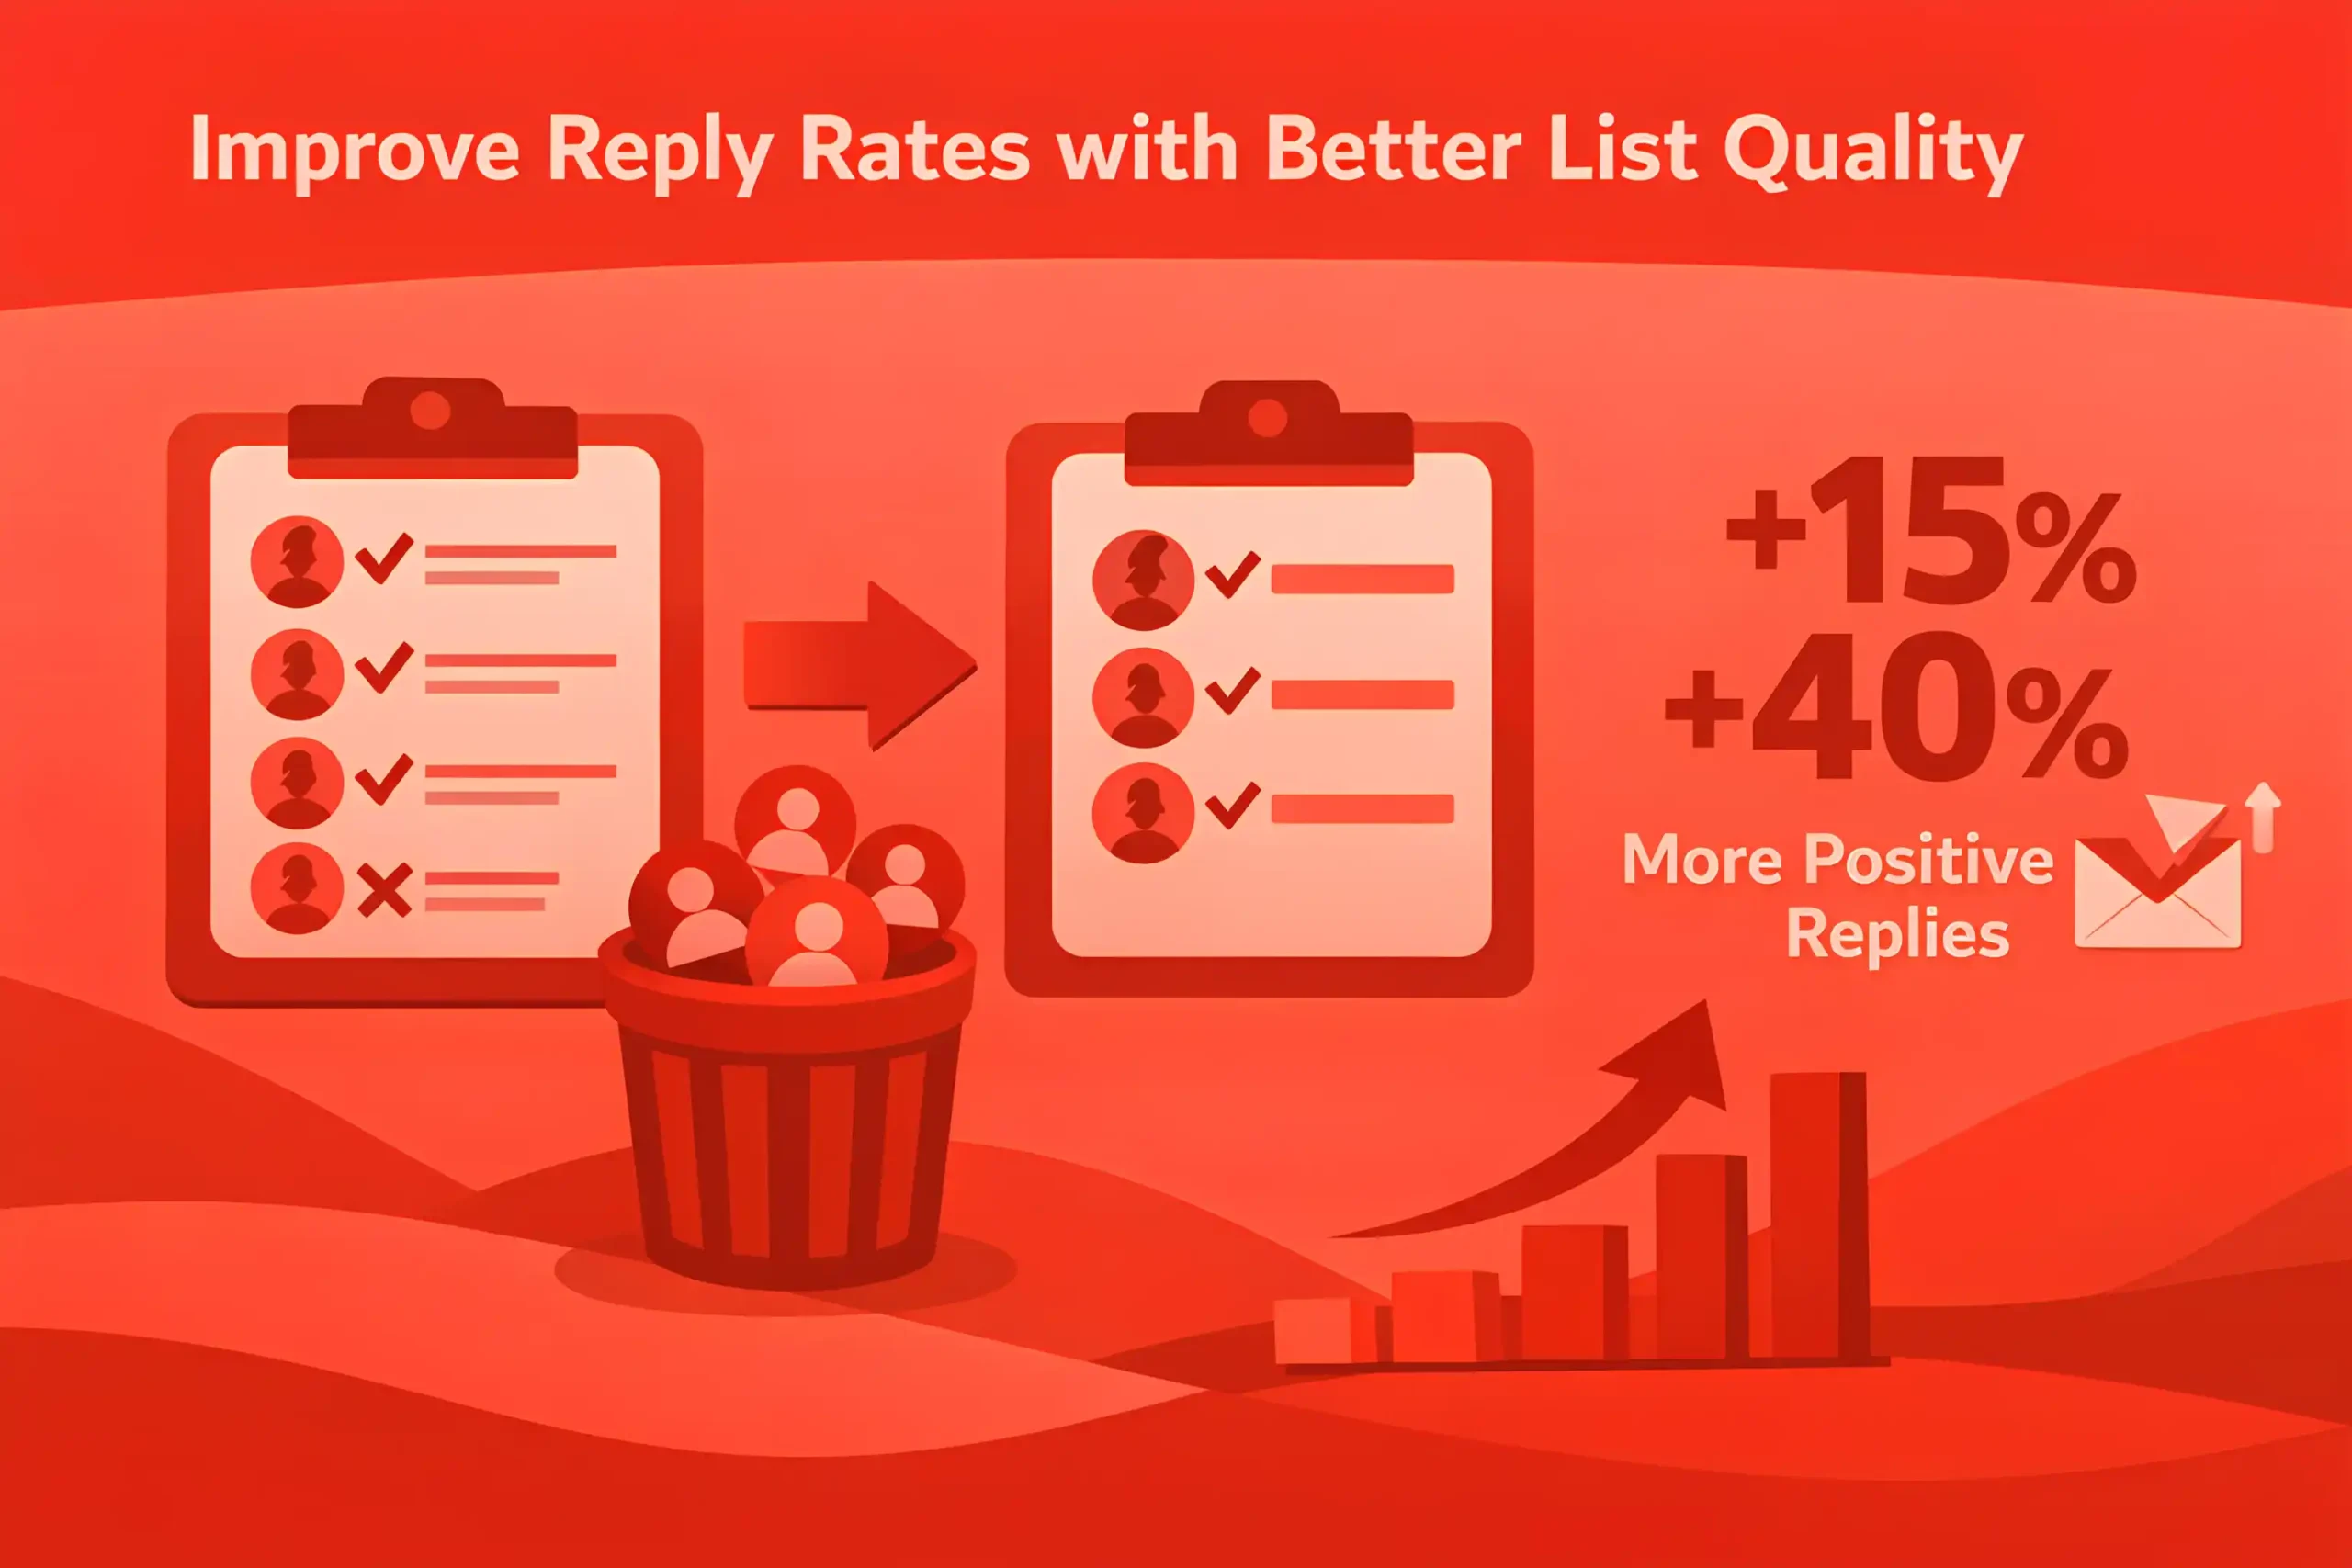
List quality is the biggest lever, and removing low-fit contacts can improve positive replies by 15% to 40%.
Also read: 100+ Content Marketing Statistics
Campaigns that target fewer, higher-fit outlets often beat broad spraying, with pickup rates improving 10% to 30%.
A realistic benchmark for publication pickup from cold pitching is often 0.5% to 3% of total contacts, depending on story strength.
Read also: 200+ Social Media Marketing Statistics
Content That Wins Coverage
Original research and data releases often increase pickup rates by 2x to 6x compared to commentary-only pitches.
Visual first assets like simple charts or a one-page benchmark can lift journalist responses by 10% to 25%.
Stories built around a clear “new finding” often earn 1.5x to 3x more coverage than trend summaries.
Industry benchmarks tend to outperform brand announcements, often generating 5 to 30 referring domains per launch.
Localized angles usually raise relevance, improving reply rates by 15% to 40% in regional outreach.
Exclusive offers can improve acceptance by 10% to 25% when outlet fit is strong.

Tight packaging matters, and headlines that state the takeaway often improve opens by 5% to 15%.
Strong hooks show fast, and pitches that lead with the point often improve positive replies by 10% to 30%.
Contrarian takes backed by evidence often perform well, lifting pickup by 10% to 35% when risk is managed.
Human stories tied to proof often travel farther, increasing secondary pickups by 20% to 60%.
Tools, calculators, and templates often earn links over time, with 30% to 60% of links arriving after the first month.
“State of the industry” roundups often produce steady coverage, especially when refreshed annually.
Short lists rarely win unless the selection method is clear, and adding criteria can raise pickup by 10% to 20%.
First-party insights from product or platform data often boost credibility, improving response by 15% to 35% when privacy is handled well.
Expert quotes work best when specific, and generic statements often reduce interest by 10% to 25%.
Fast follow posts tied to breaking news can lift pickup by 20% to 50%, but timing windows are tight, so teams often rely on disciplined performance marketing.
Evergreen explainers rarely win cold outreach unless paired with a fresh angle or a new dataset.
Assets designed for skimming often perform better, and reducing the reading load can lift responses by 10% to 20%.
Campaigns with a single clear landing page often convert coverage into links more reliably, improving link capture by 10% to 30%.
The most consistent winners combine proof, novelty, and clean packaging, then keep the story easy to cite in one paragraph.
Related article: 100+ AI Marketing Statistics
Measurement, Budget, and ROI Benchmarks
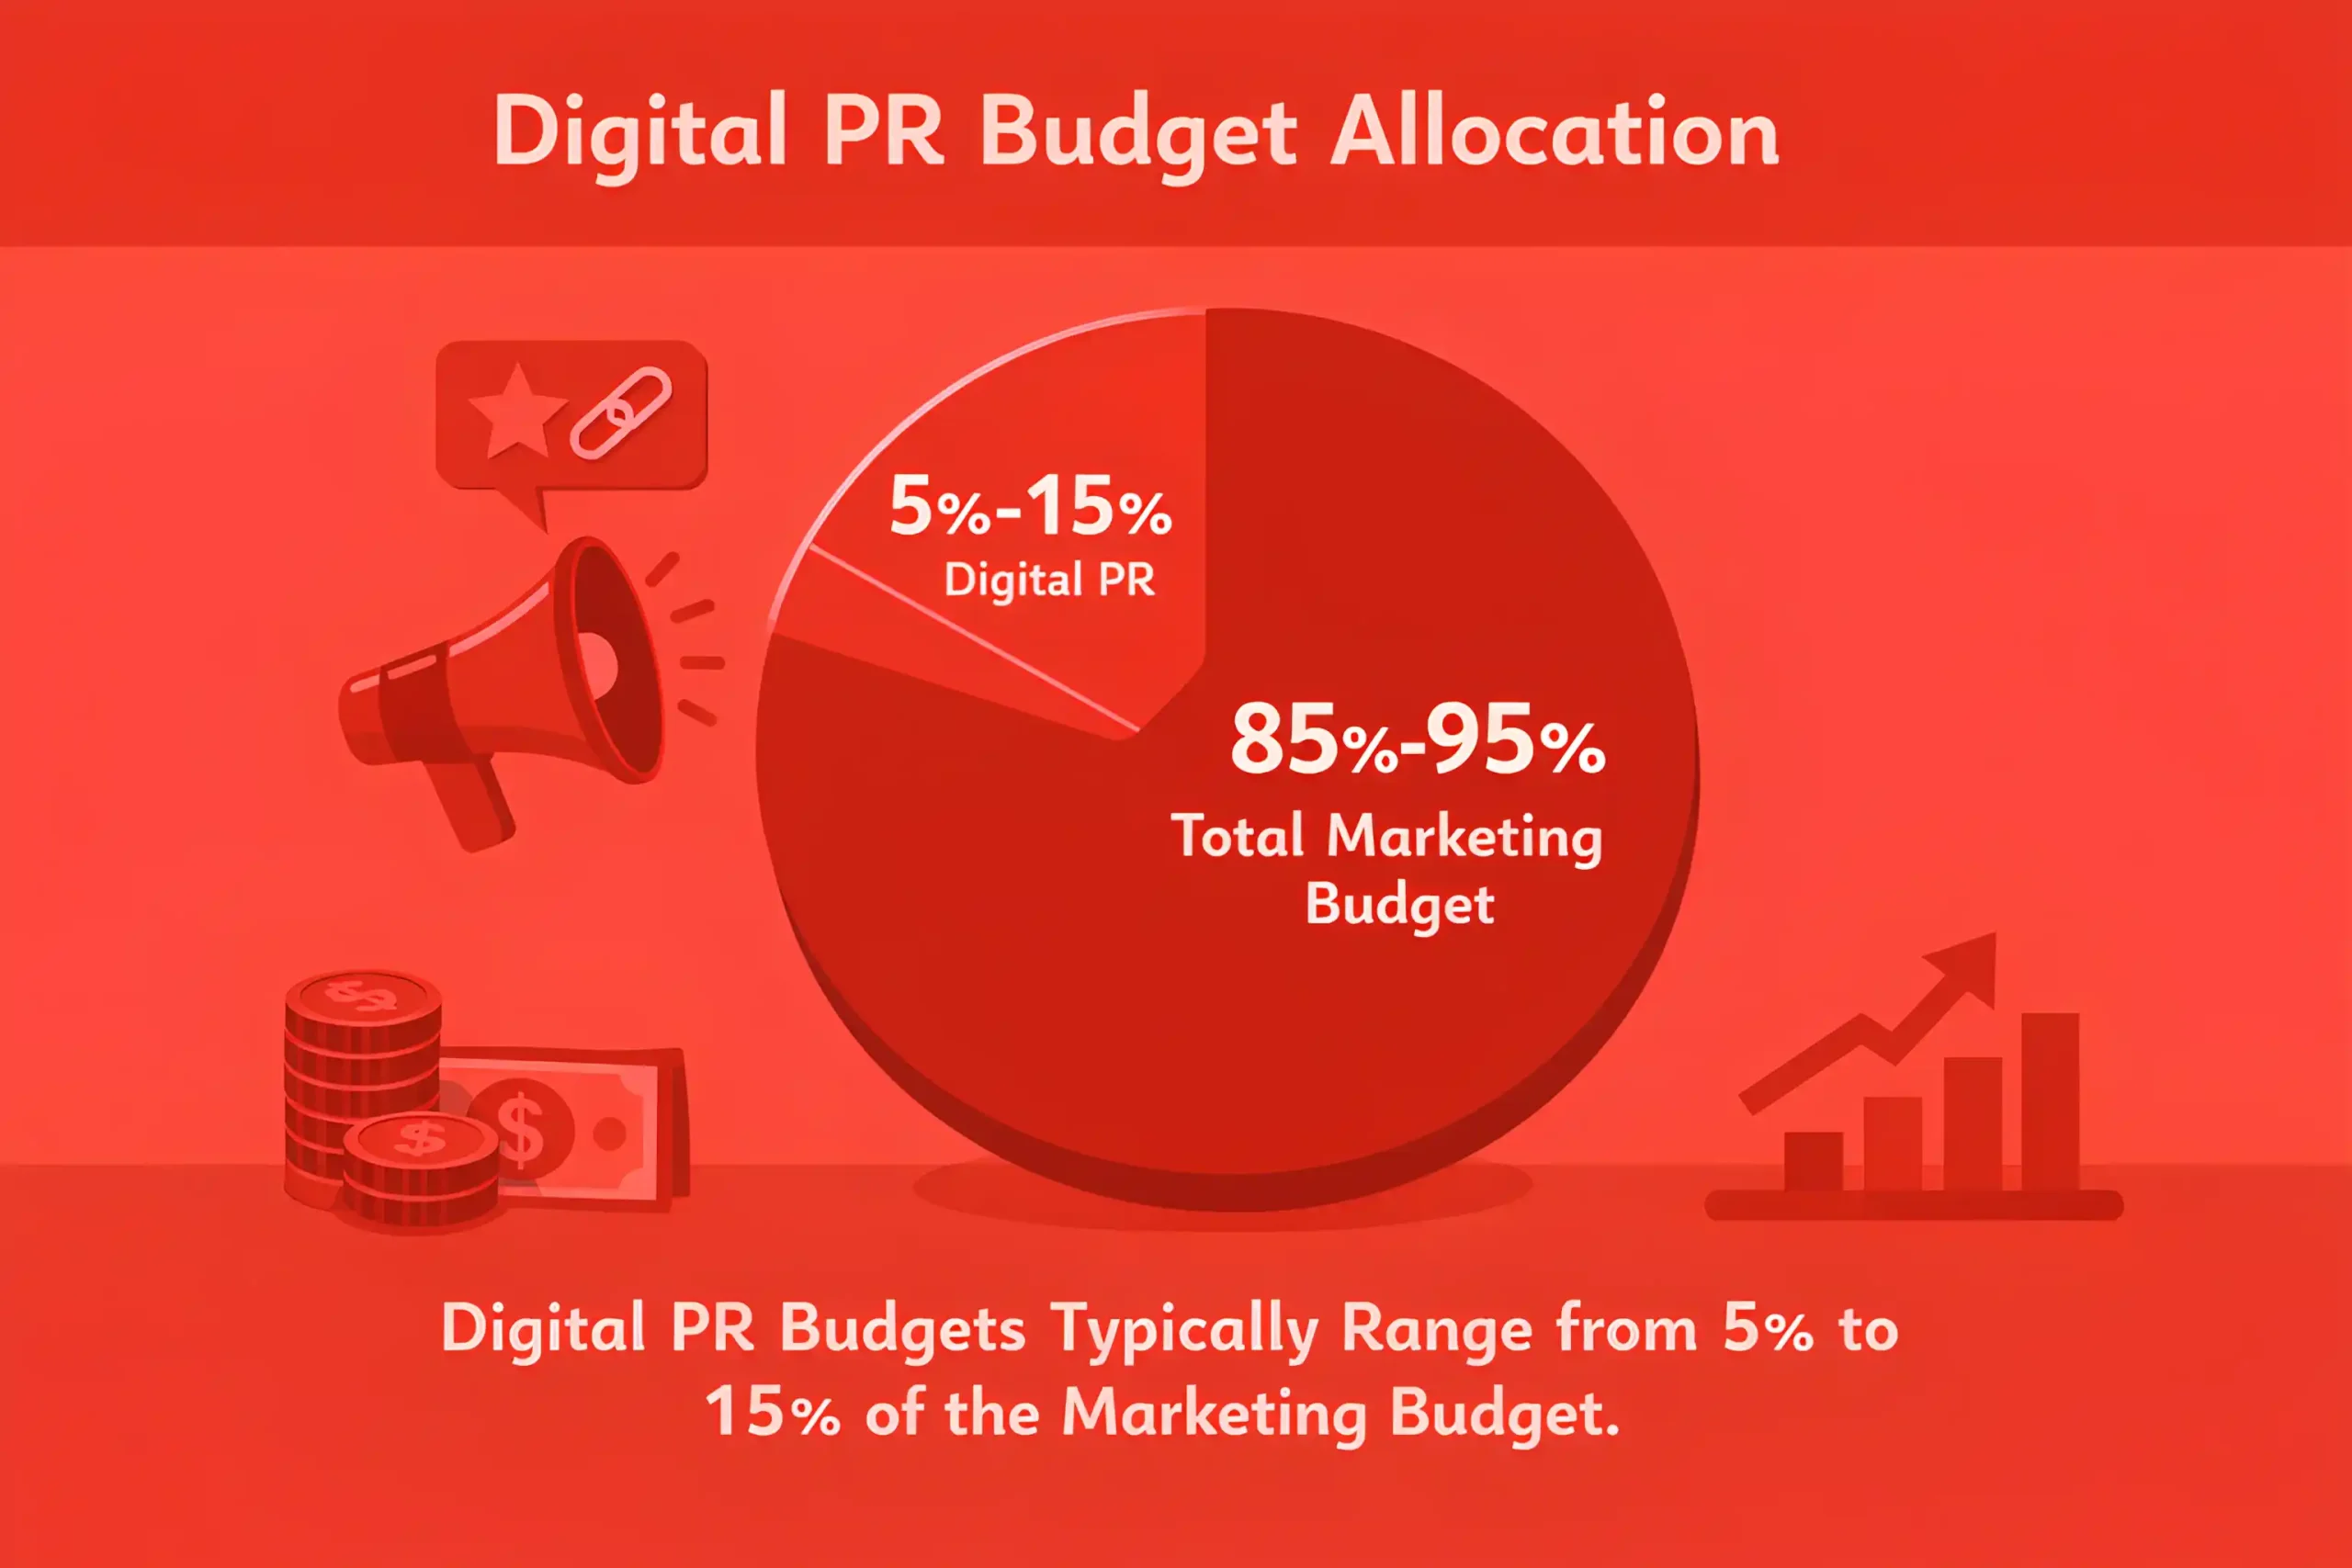
Digital PR budgets often land around 5% to 15% of the total marketing budget in teams running consistent campaigns.
Early-stage brands commonly spend $3K to $15K per campaign, mainly on research, creative, and outreach ops.
Mid-market programs often sit around $15K to $75K per month once data assets, design, and steady pitching are included.
Agency retainers commonly cluster between $5K and $25K per month, depending on volume and tier targets.
Cost per earned placement varies widely, but many teams plan around $250 to $2,500 per placement across a quarter.
Cost per referring domain from PR often falls in the $150 to $1,200 range, driven by asset strength and outlet fit.
A realistic pickup rate from cold outreach often sits around 0.5% to 3% of contacts, so list quality shapes budget efficiency.
Campaigns built on original data often reduce cost per link by 20% to 50% compared to commentary campaigns.
Most measurable lift appears in 30 to 90 days, with SEO effects lagging brand lift and referral spikes.
Branded search is a common leading indicator, and many teams look for 10% to 40% uplift after strong coverage bursts.
Referral traffic from earned media is often smaller than expected, but conversion rates can run 10% to 30% higher than average traffic.
Attribution usually undercounts PR, so many teams track assisted conversions and branded search lift as primary proof points.
Share of voice targets often aim for a 5 to 20 point lift over a quarter for a focused narrative.
Link quality beats link volume, and 5 to 15 high authority domains often outperform 50+ low-value mentions for rankings.
Reporting time can be a hidden cost, and teams often spend 10% to 20% of program time on measurement and stakeholder updates.
PR plus on-site improvements often compounds outcomes, with total organic lift 15% to 35% higher than PR alone.
Budget efficiency improves with consistency, and programs running 3 to 6 months usually have a lower cost per result as relationships build.
The cleanest ROI story ties coverage to one primary business goal, then maps supporting metrics like links, branded demand, and qualified leads, which is easier to communicate with a clear digital marketing strategy.
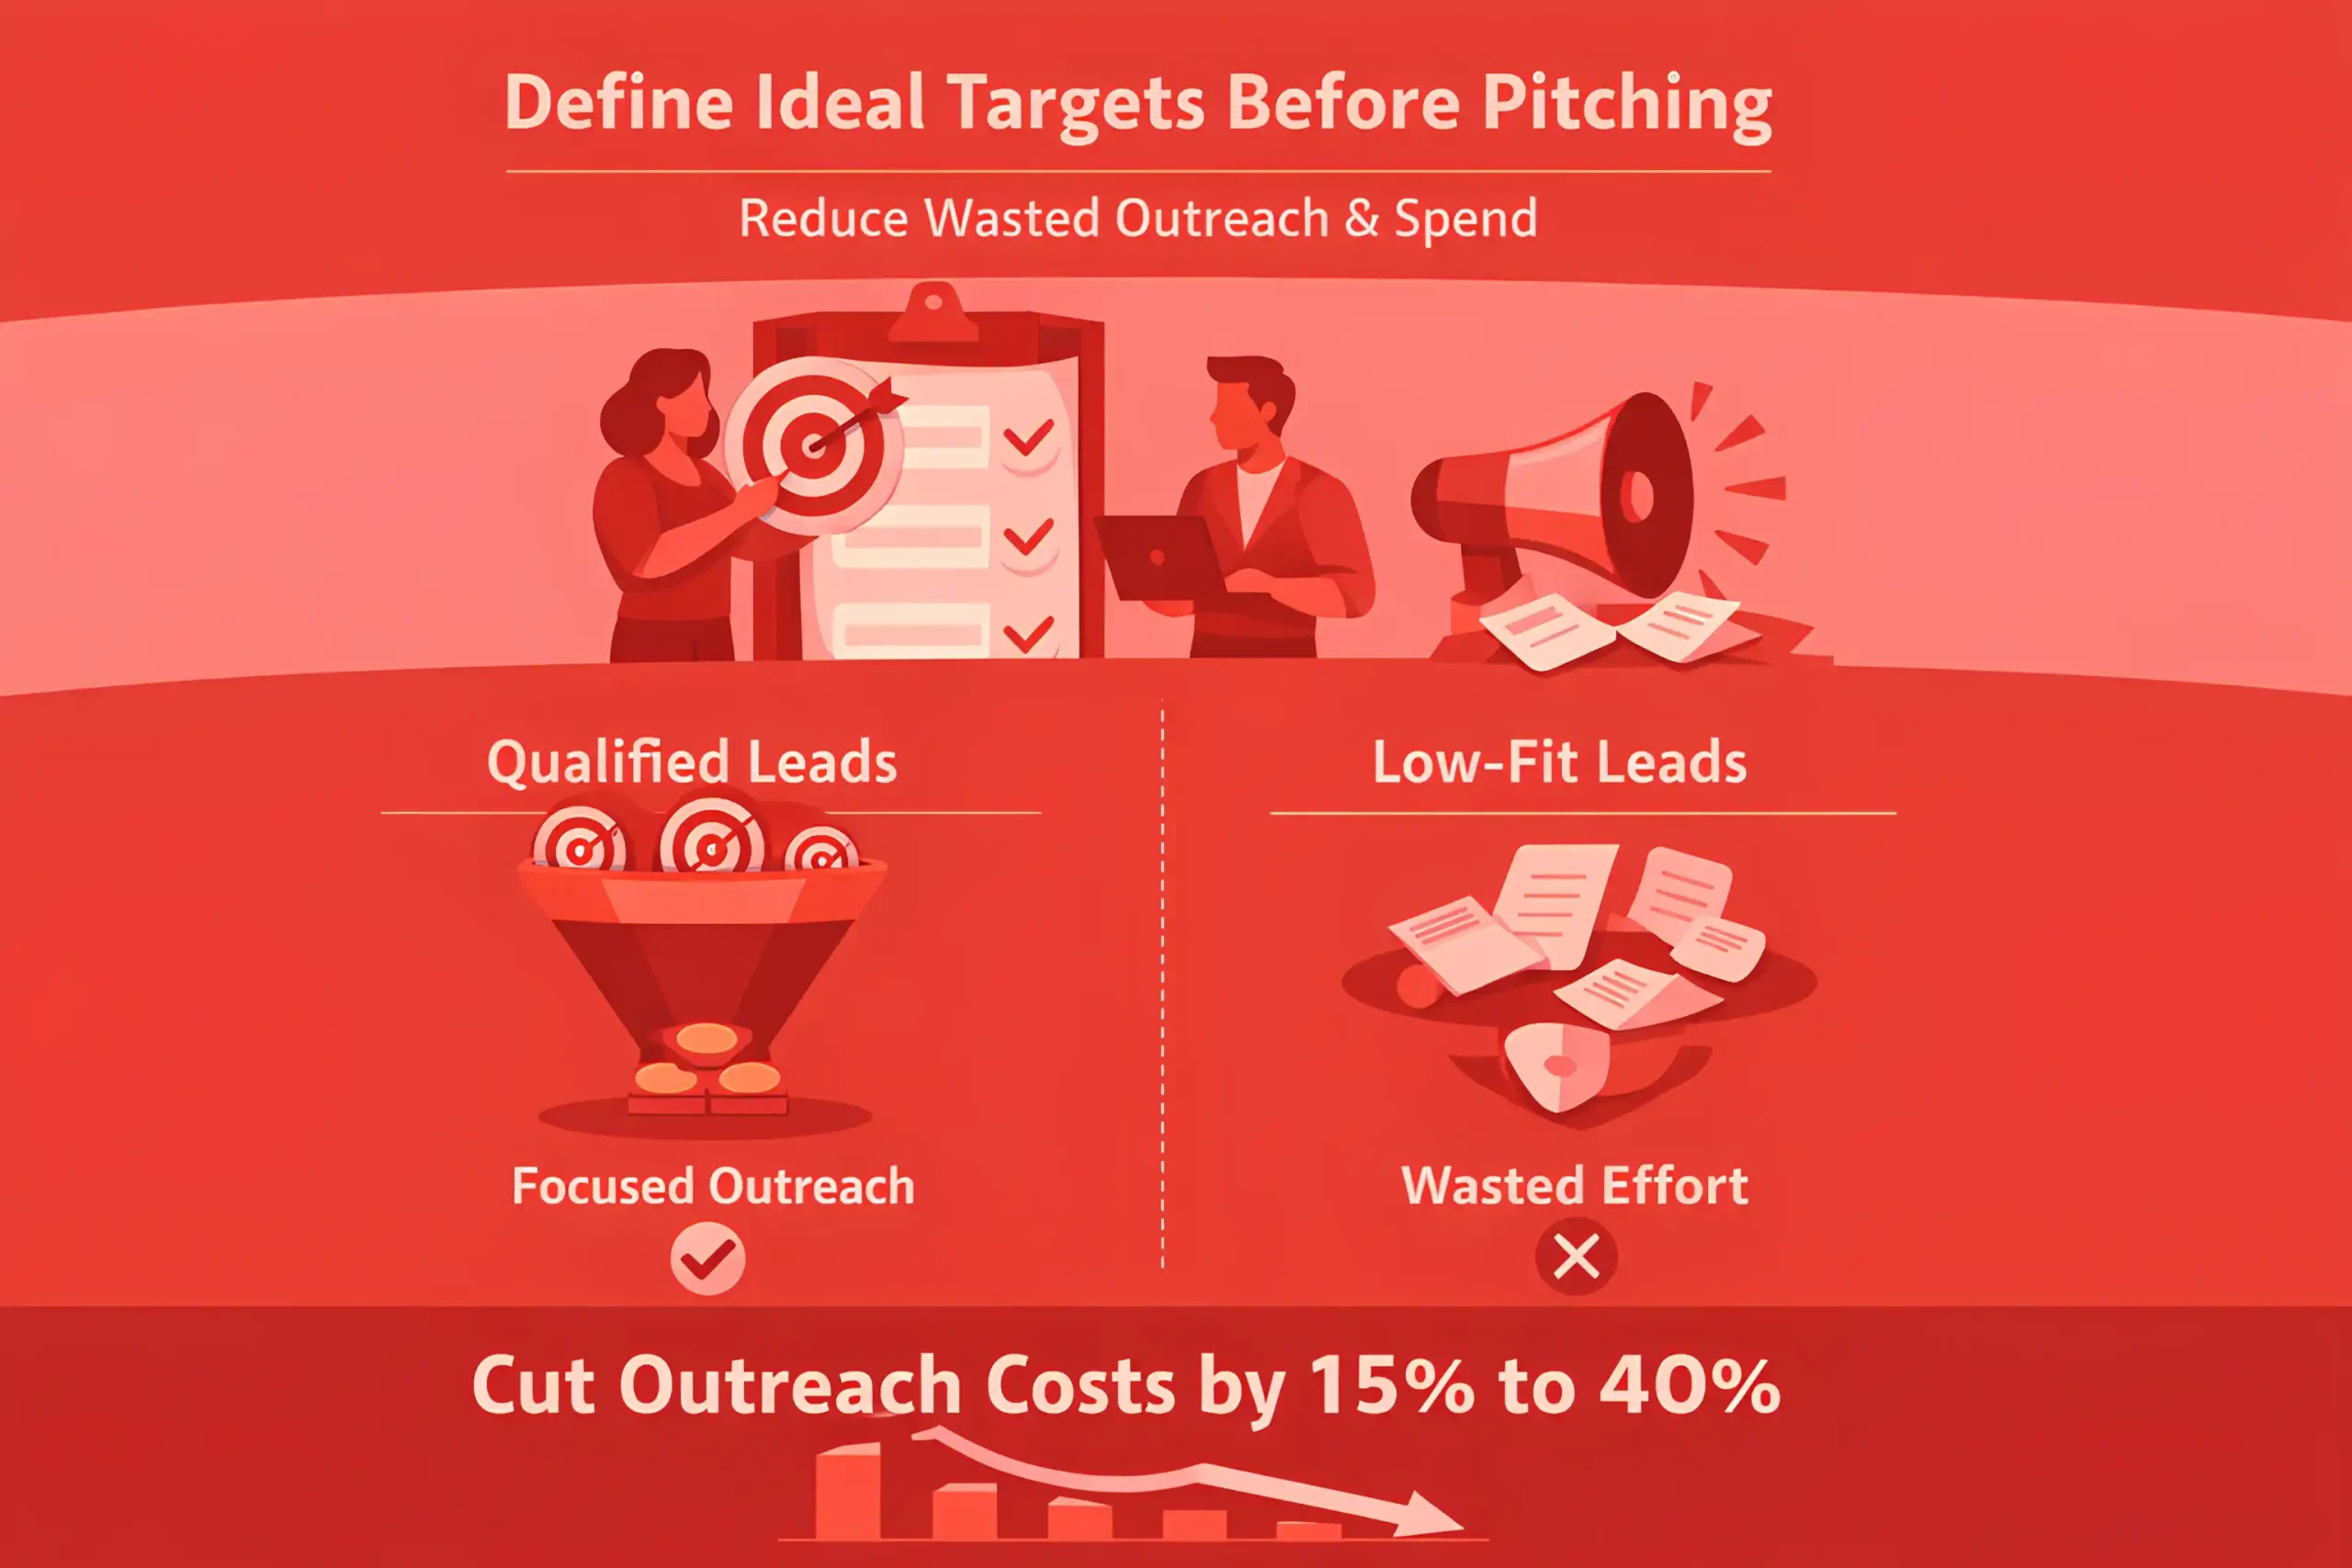
Teams that define success before pitching usually waste less spend, often cutting low-fit outreach by 15% to 40%.
Recommended reading: 100+ Podcast Statistics
The Key Takeaways
Plenty of digital PR campaigns fade out. The angle gets watered down, the pitch list gets bigger, replies slow, and the result is a few mentions that look fine in a report but do not move demand.
Teams getting results in 2026 keep the work tight. One clear story, one piece of proof, and a short list of outlets that already cover the topic. When coverage lands, they do not file it away. They build on it across search, social, and sales follow-up, so the work keeps paying off after the news cycle passes.
The stats in our guide set realistic benchmarks for outreach, pickups, budgets, and outcomes. Use them to plan campaigns with clear expectations and choose ideas that keep earning attention over time.


