B2B SEO rarely fails because teams lack content. It fails because expectations are wrong. Leaders want a predictable pipeline, yet buying cycles stretch, attribution gets messy, and search demand does not move in straight lines.
Meanwhile, AI answers are changing click behavior, and one strong page can outperform a dozen average posts.
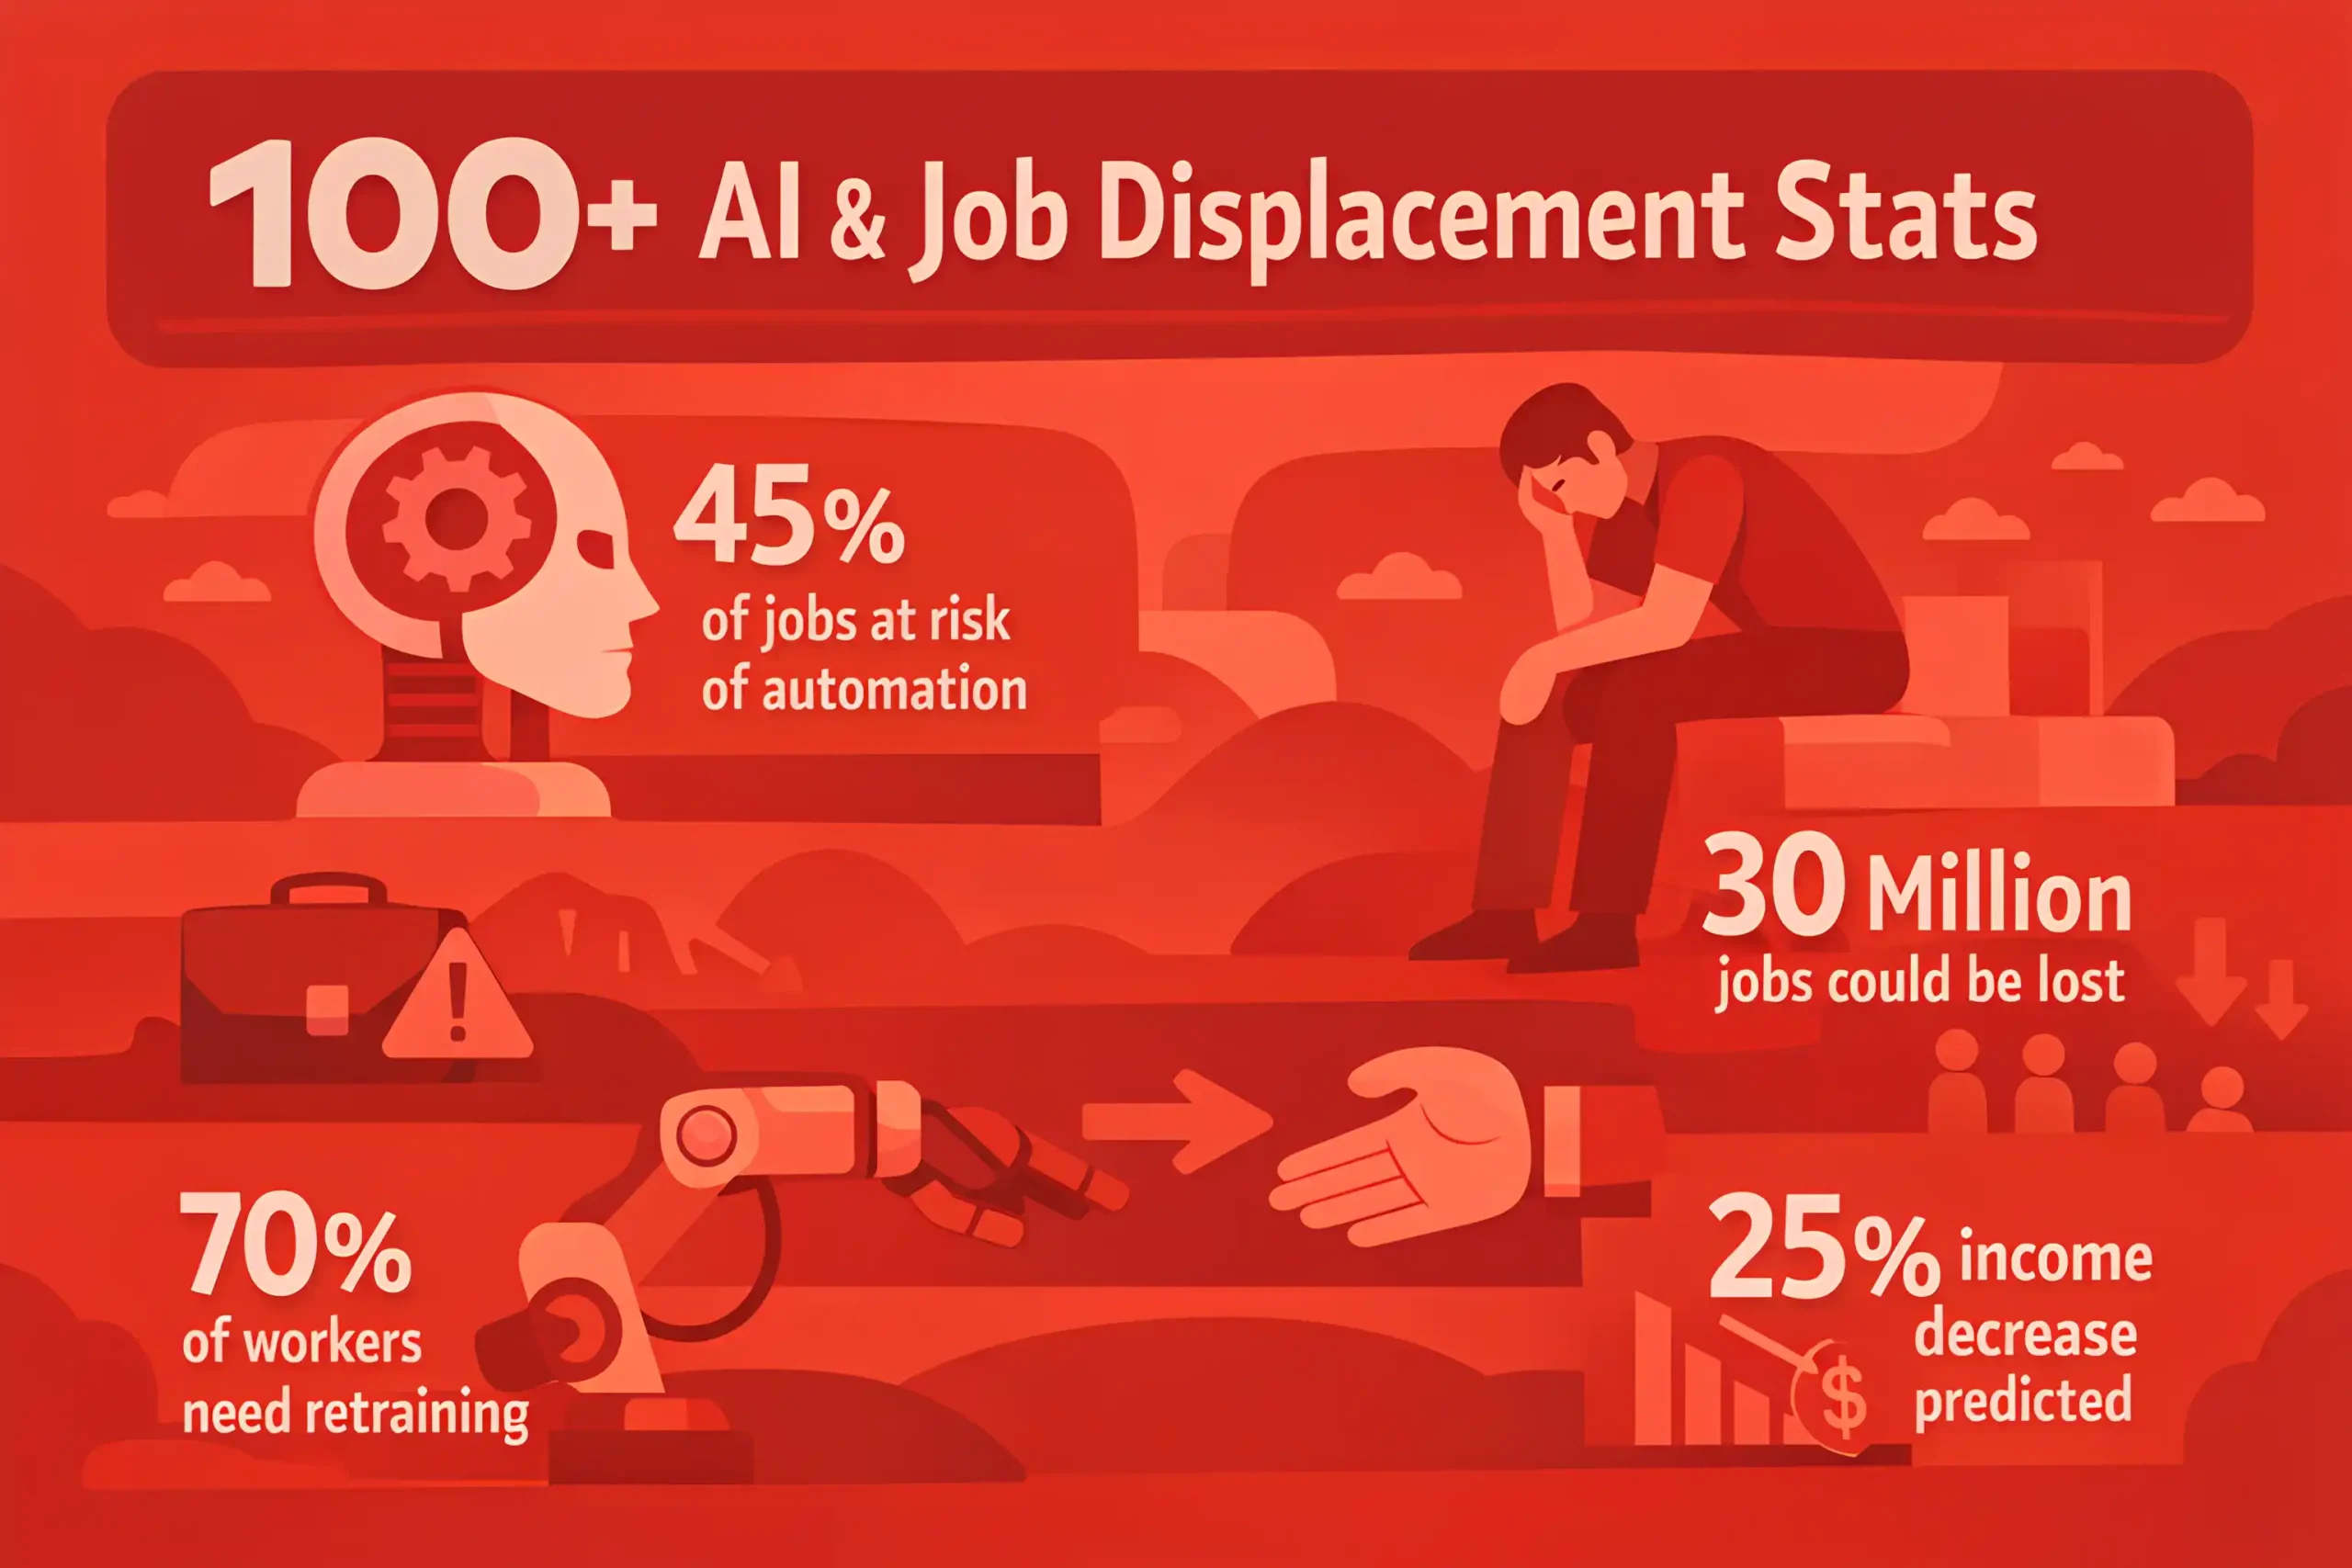
Our updated collection on NEWMEDIA.COM brings together 100+ B2B SEO statistics across buyer behavior, organic visibility, content performance, technical health, link acquisition, and ROI measurement.
In practice, the benchmarks will help you set realistic targets, connect SEO work to revenue outcomes, focus effort on changes that move rankings and qualified demand, and justify investment decisions with data.
B2B Search Demand & Market Trends Statistics
Non-branded B2B search demand often accounts for 60% to 85% of total organic opportunity, which is why most teams start with a focused B2B SEO strategy.
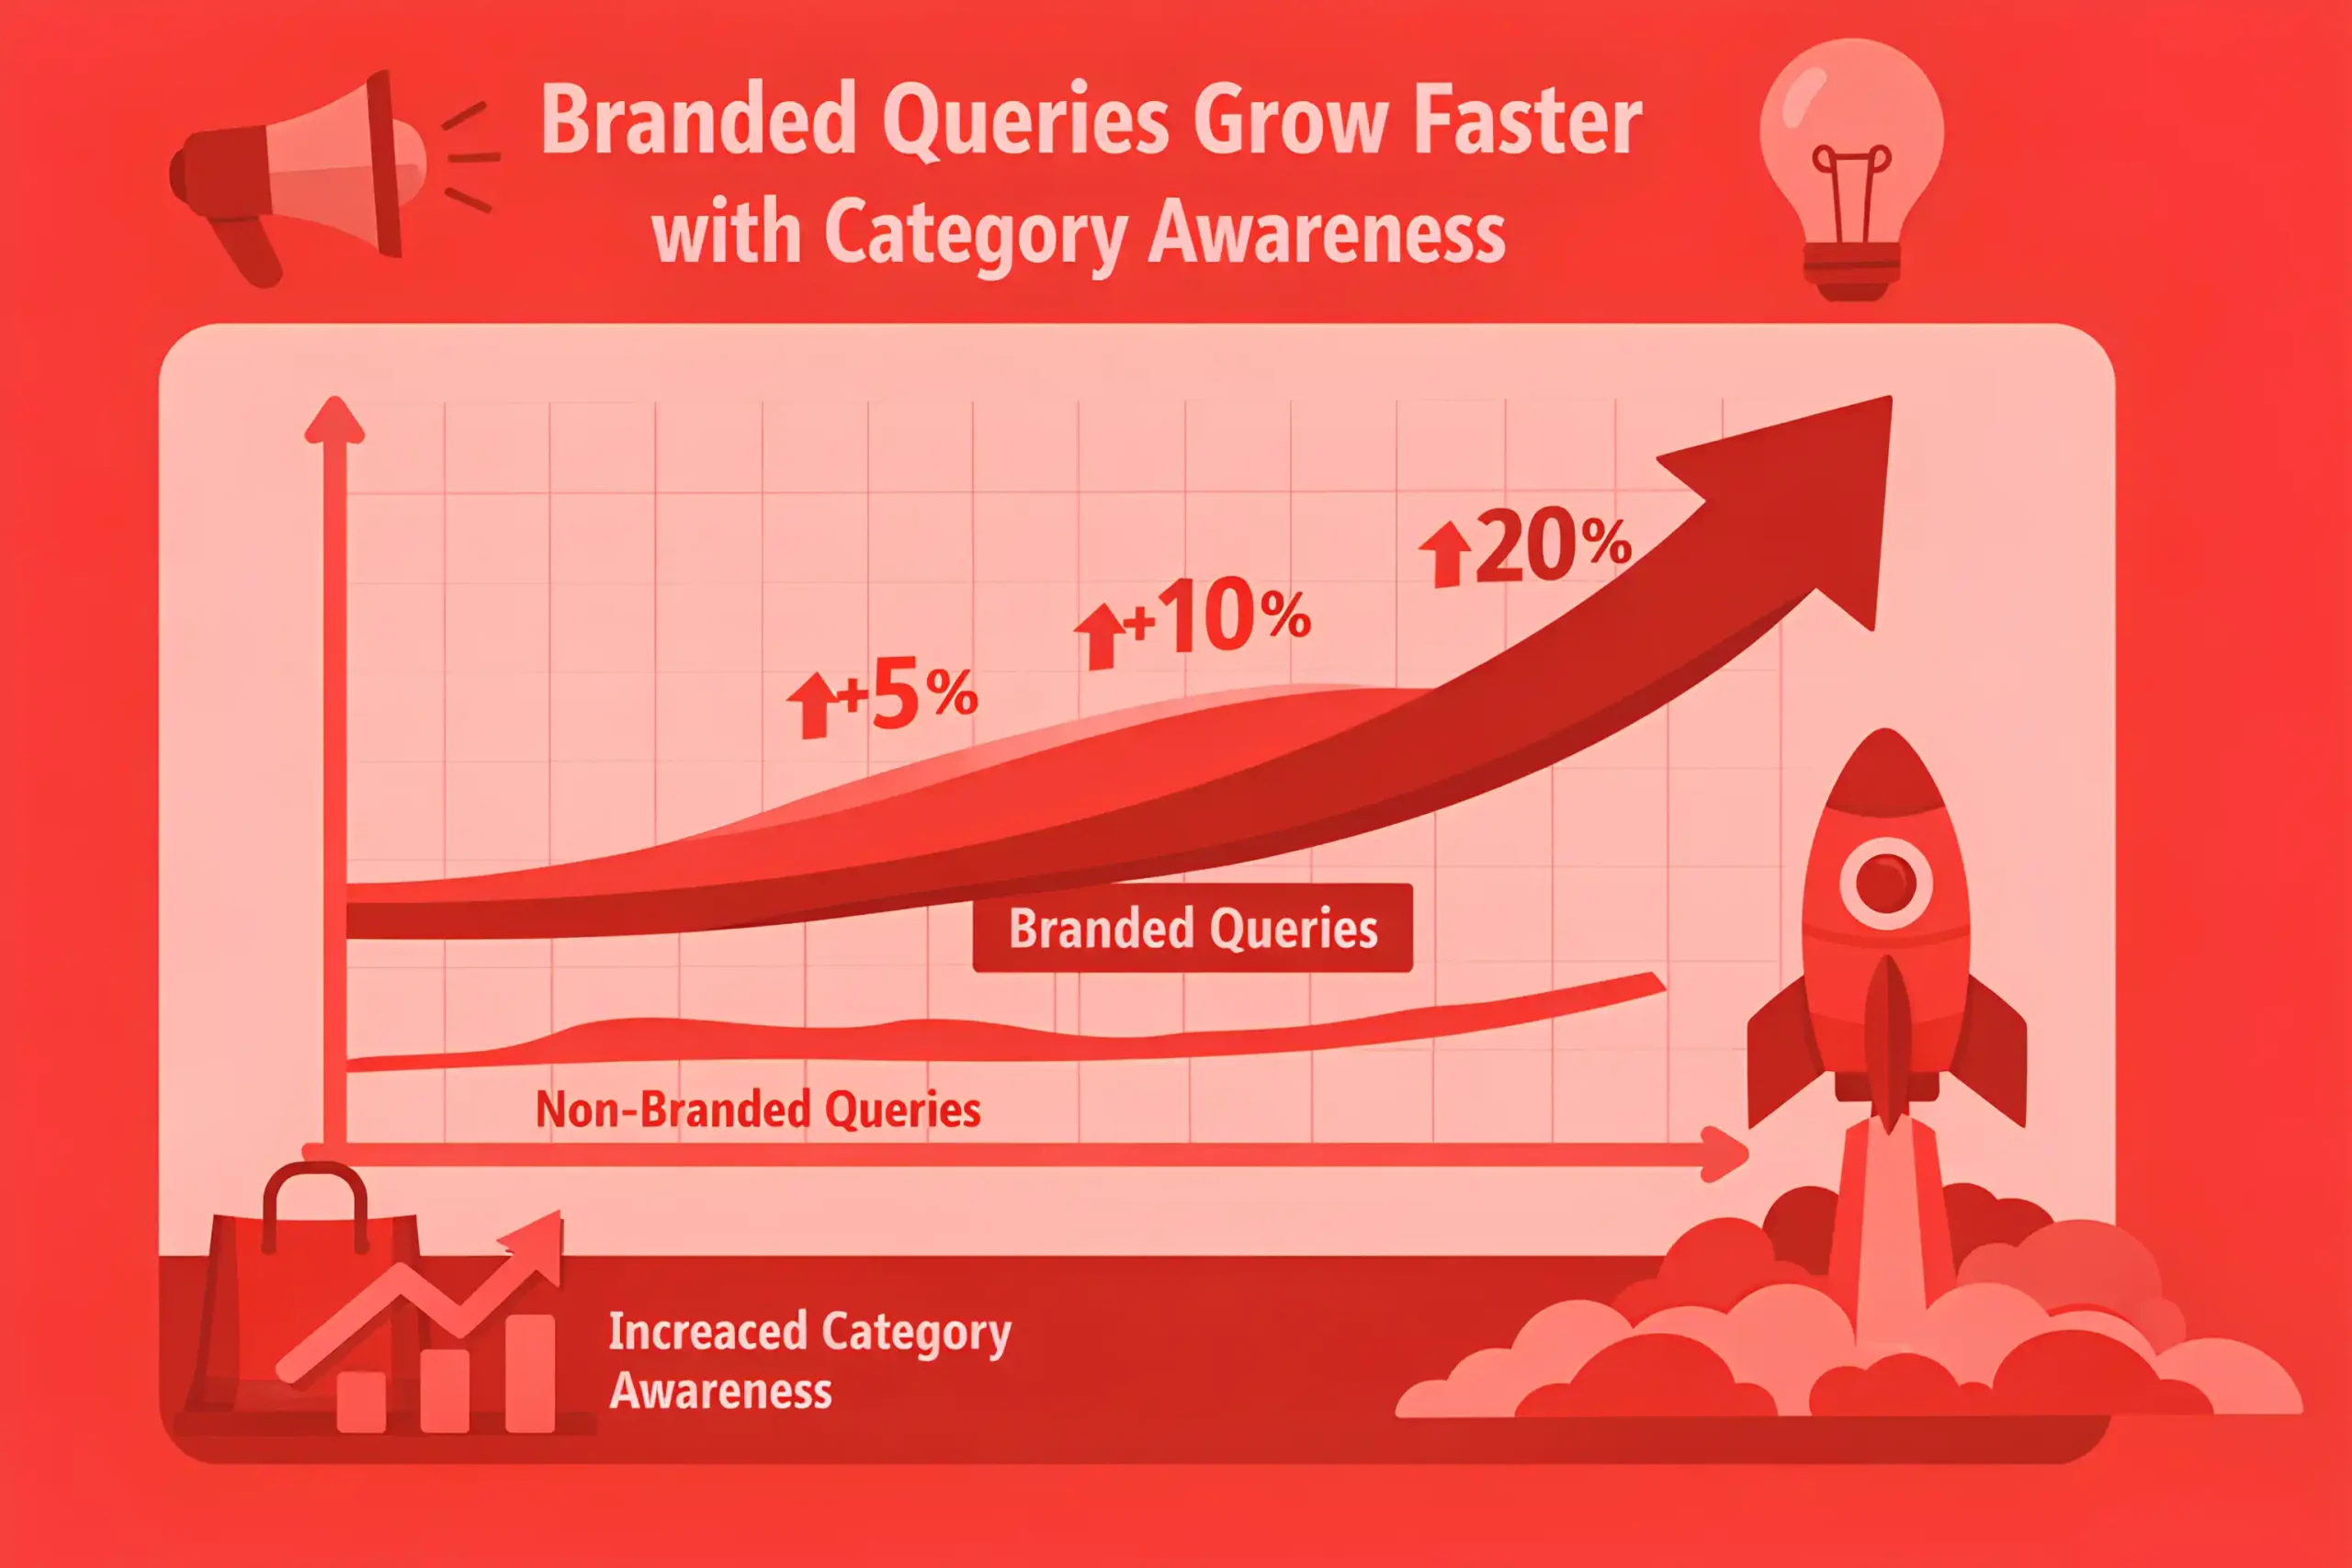
Branded queries often grow faster than non-branded queries by 5% to 20% once category awareness improves.
In many B2B categories, demand is seasonal, and monthly search volume can swing 10% to 35% between peak and trough periods.
Long tail queries commonly represent 50% to 70% of total query breadth, even when head terms get most attention.
High-intent comparison and vendor evaluation queries often rise 15% to 40% during budget planning windows, and capturing that demand depends on strong mid-funnel positioning through enterprise SEO.
Search demand expansion is frequently led by new subcategories, where early keyword sets can grow 2x to 4x over a year.
AI answer surfaces can reduce clicks on generic informational queries by 10% to 35% while leaving high-intent clicks more stable.
Click share tends to concentrate, and top positions often capture 50% to 75% of non-branded clicks for competitive terms.
SERP volatility is higher in software and services markets, with ranking swings of 3 to 10 positions common after major updates.
B2B buyers often search across multiple problem frames, and query themes are usually split across 3 to 6 core jobs to be done.
Solution queries often grow after major product launches, with demand lifts of 5% to 25% over the following quarter.
Local and regional modifiers can represent 10% to 30% of demand in service-led B2B categories.
Industry-specific modifiers often drive higher conversion, even at lower volume, with lead rates commonly 1.2x to 3x higher than general terms.
Search demand for compliance and risk topics can spike 20% to 60% after regulation changes or headline events.
Mobile share of B2B research queries often lands around 35% to 55%, but desktop still dominates deep comparison behavior.
A typical category sees rising mid-funnel demand, and “best” and “alternative” style queries can account for 10% to 25% of trackable opportunity.
Competitor names frequently appear inside non-branded journeys, with “X vs Y” style queries forming 5% to 15% of research demand.
International expansion often changes keyword intent, and localized term sets can differ by 20% to 50% even when products match.
Higher-priced B2B offers usually have longer query paths, with 5 to 12 search sessions before a demo or contact action is common.
The most reliable demand signal is not one keyword, but sustained growth across a cluster, usually 10%+ over 3 to 6 months.
Also explore: 100+ Digital PR Statistics
B2B Buyer Behavior & Decision-Making Statistics
B2B buyers often complete 60% to 80% of research before speaking with sales, especially in software and service categories.
Most buying groups include 3 to 8 stakeholders, and the count rises as contract value increases.
A typical buying cycle spans 6 to 20 weeks, with longer cycles common in enterprise deals and regulated industries.
Buyers often revisit the same shortlist multiple times, with 2 to 5 evaluation rounds before a final decision.
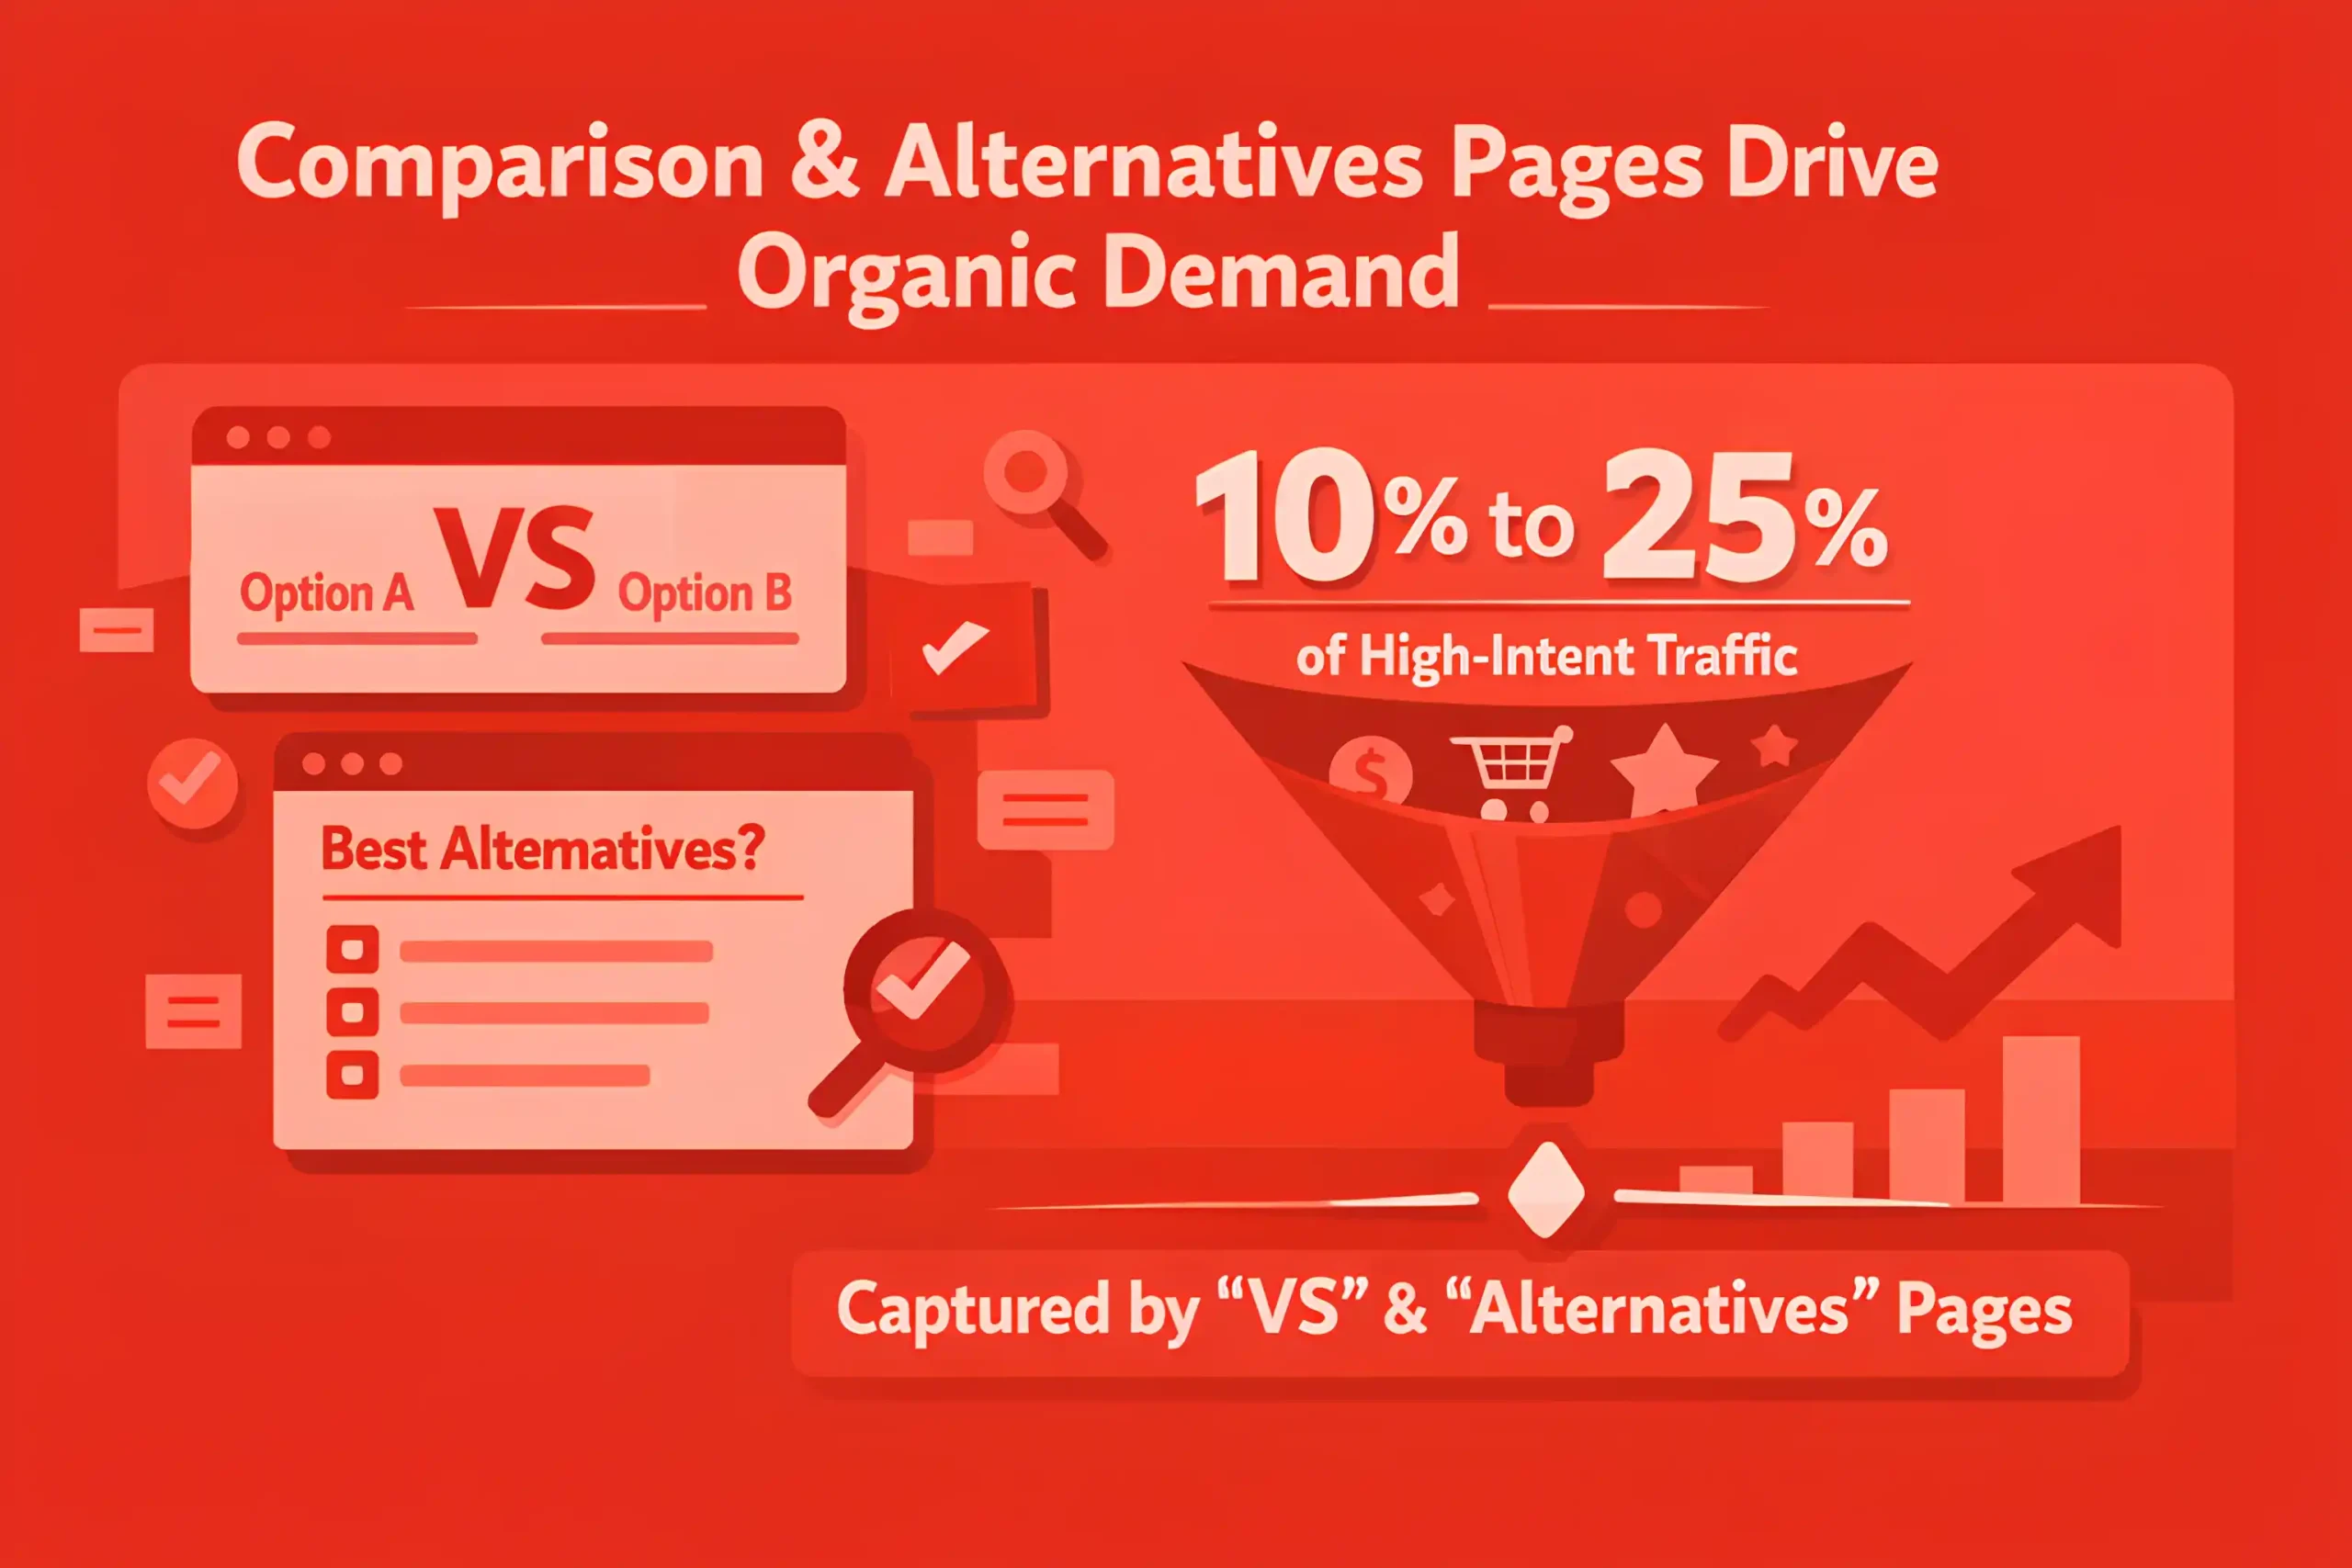
Comparison behavior is the norm, and “vs” and “alternatives” pages often capture 10% to 25% of high-intent organic demand.
Trust signals heavily influence decisions, and buyers frequently look for proof within the first 2 to 4 minutes on a page, so many teams improve credibility and clarity through enterprise web design.
Case studies and customer stories often rank among the top conversion assists, contributing to 15% to 35% of demo journeys, which is why strong narratives are built into content writing.
Pricing and implementation content tends to drive high intent actions, with conversion rates often 1.5x to 3x higher than top funnel pages.
Buyers usually check multiple channels, and 3 to 6 touchpoints across organic, paid, email, and referrals are common before conversion.
Repeat visits are a strong indicator, and high-intent users often visit 2 to 6 pages per session during evaluation.
Mobile research starts are common, but final form fills still skew desktop, with 55% to 75% of conversions happening on desktop.
In complex purchases, internal approval adds delay, and procurement steps can extend cycle length by 10% to 30%.
Security, compliance, and data questions often become deal blockers, and complex buying paths convert better when the site infrastructure is clean and scalable through B2B website development.
Buyers often scan for fit fast, and bounce risk rises when the page fails to confirm relevance within 10 to 20 seconds.
Peer recommendations remain influential, and referral leads often convert 20% to 50% higher than cold organic leads.
Switching risk is a top concern, and buyers commonly evaluate migration effort, with 40% to 70% seeking implementation details.
Content depth matters, and long-form guides often hold attention longer, with time on page 20% to 60% higher than short posts.
Decision makers often prioritize ROI clarity, and 50%+ of buyers expect a clear business case before booking a call.
The final decision often comes down to confidence, and brands with consistent proof across multiple pages usually see 10% to 25% higher close rates.
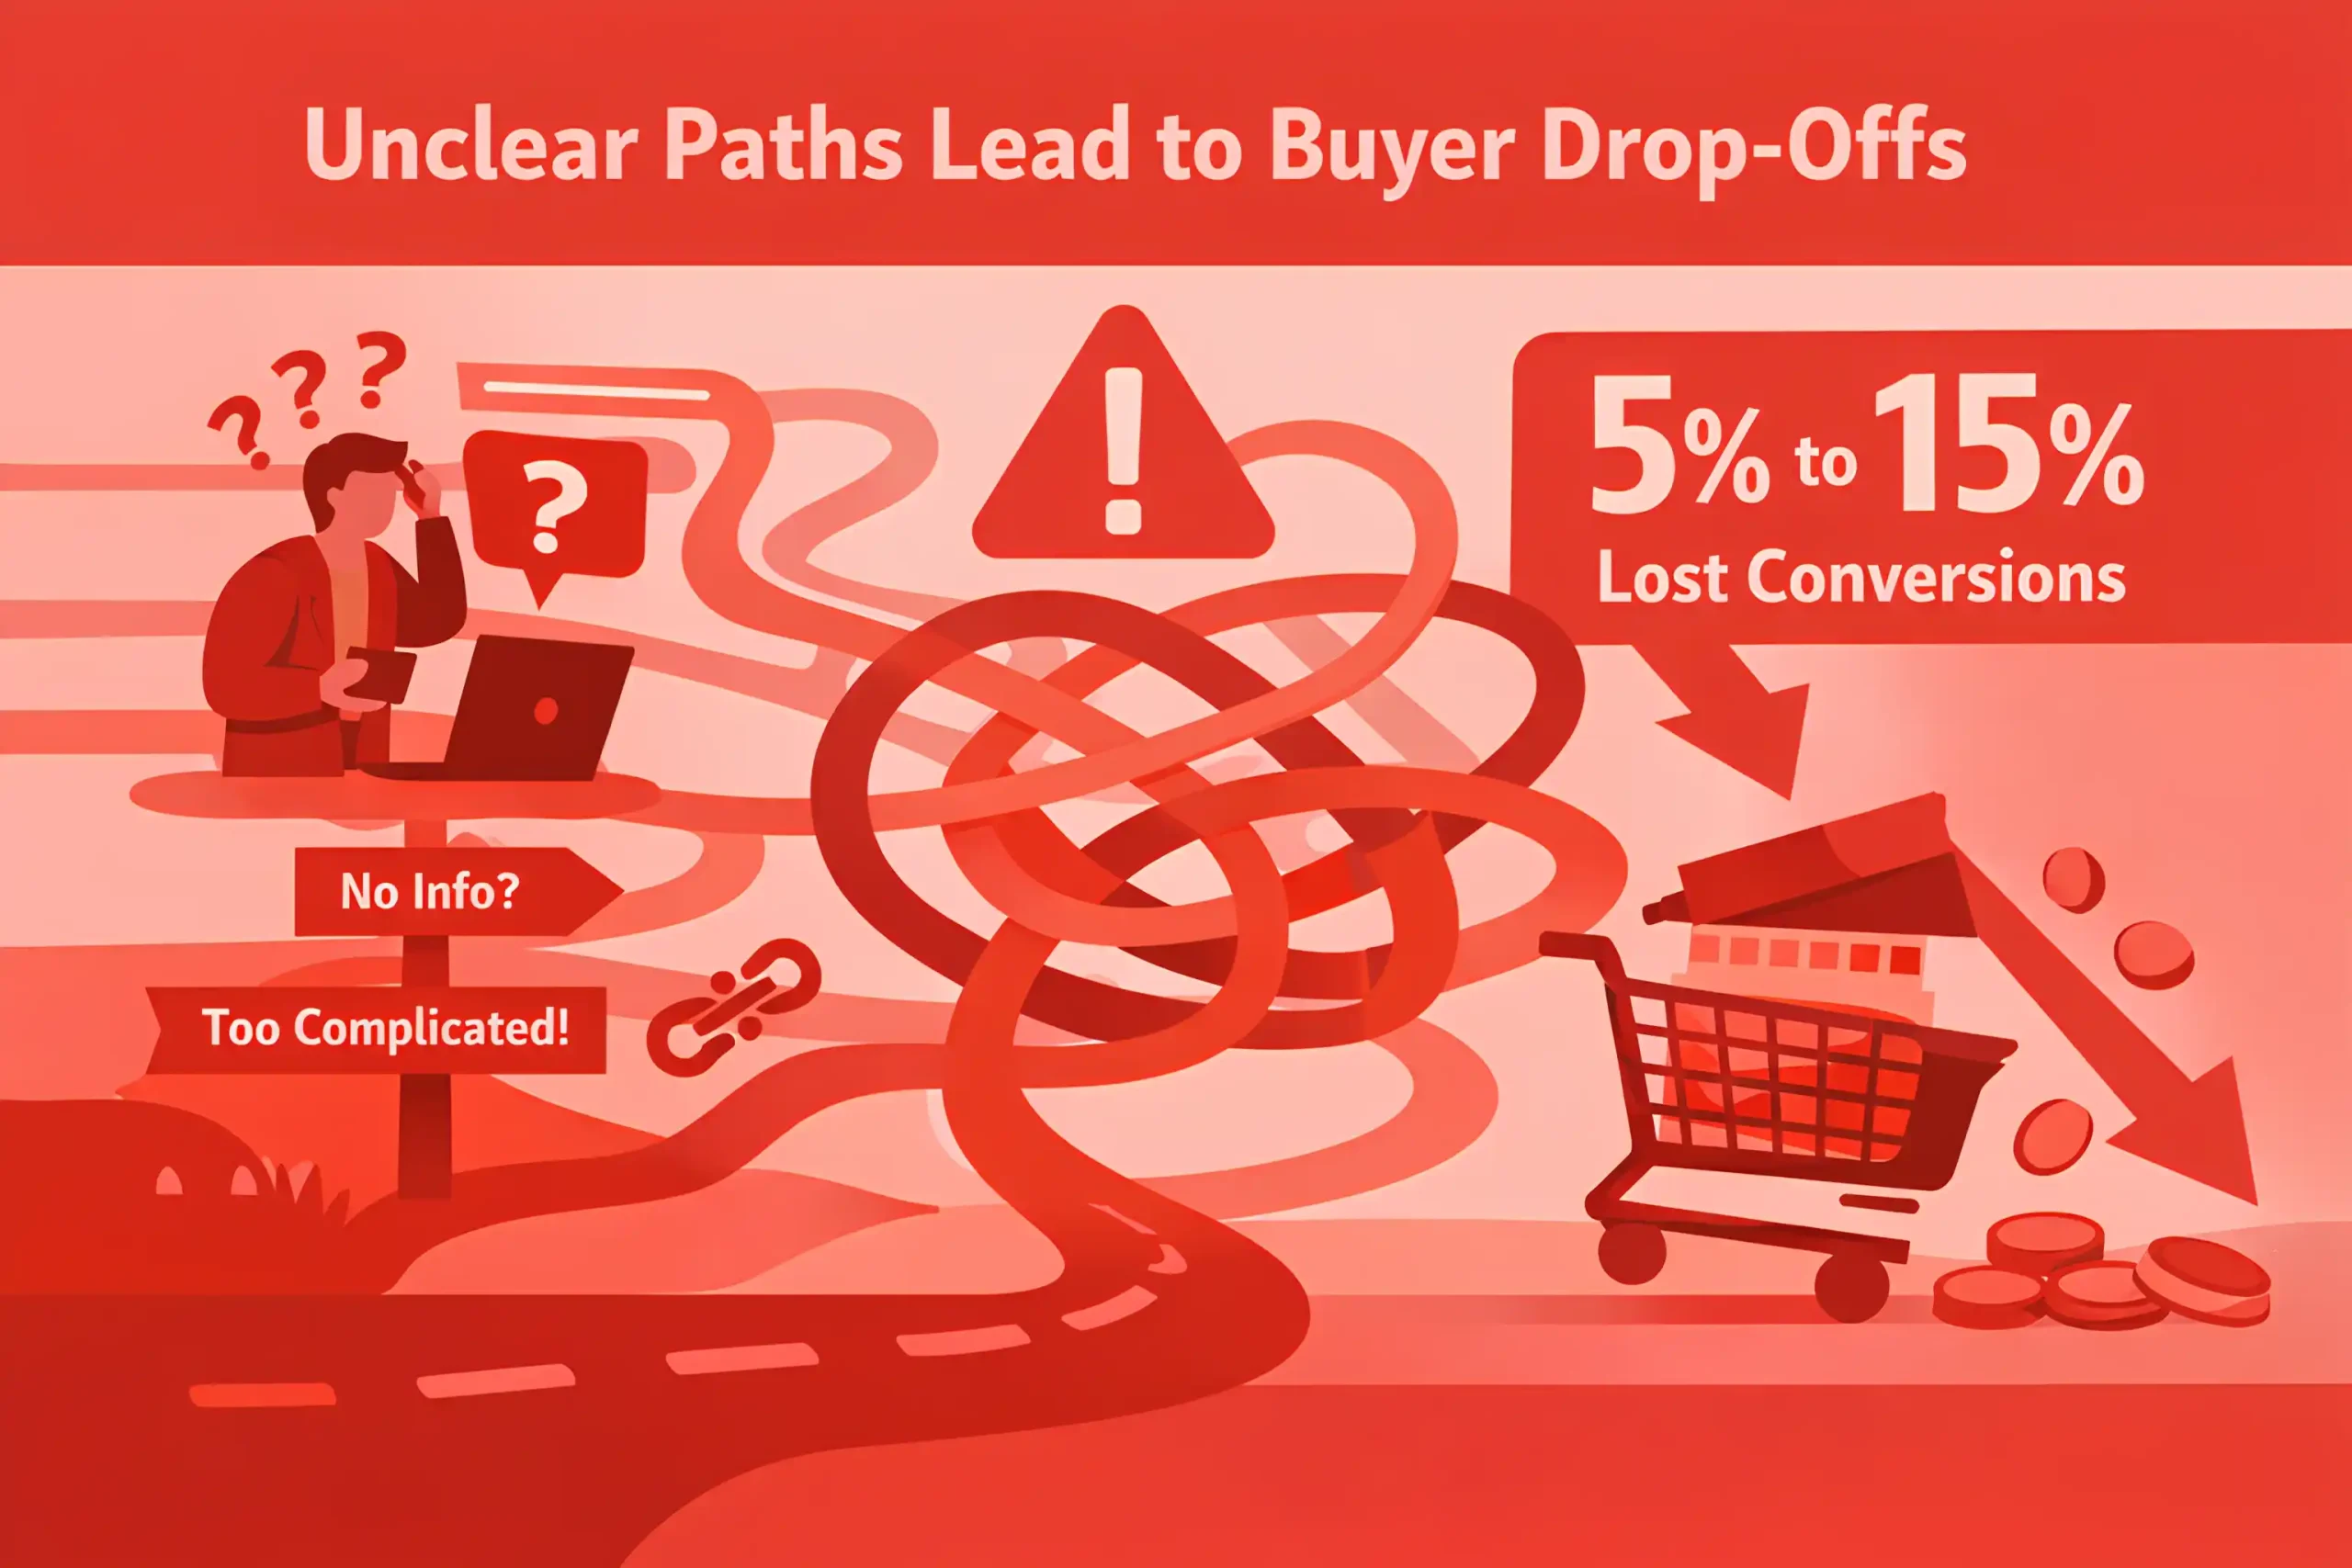
When buyers cannot find direct answers, drop-out increases, and those leaks are typically fixed fastest through conversion rate optimization.
You might find it interesting to read: 100+ Reputation Management Statistics
Content Marketing Performance for B2B SEO Statistics
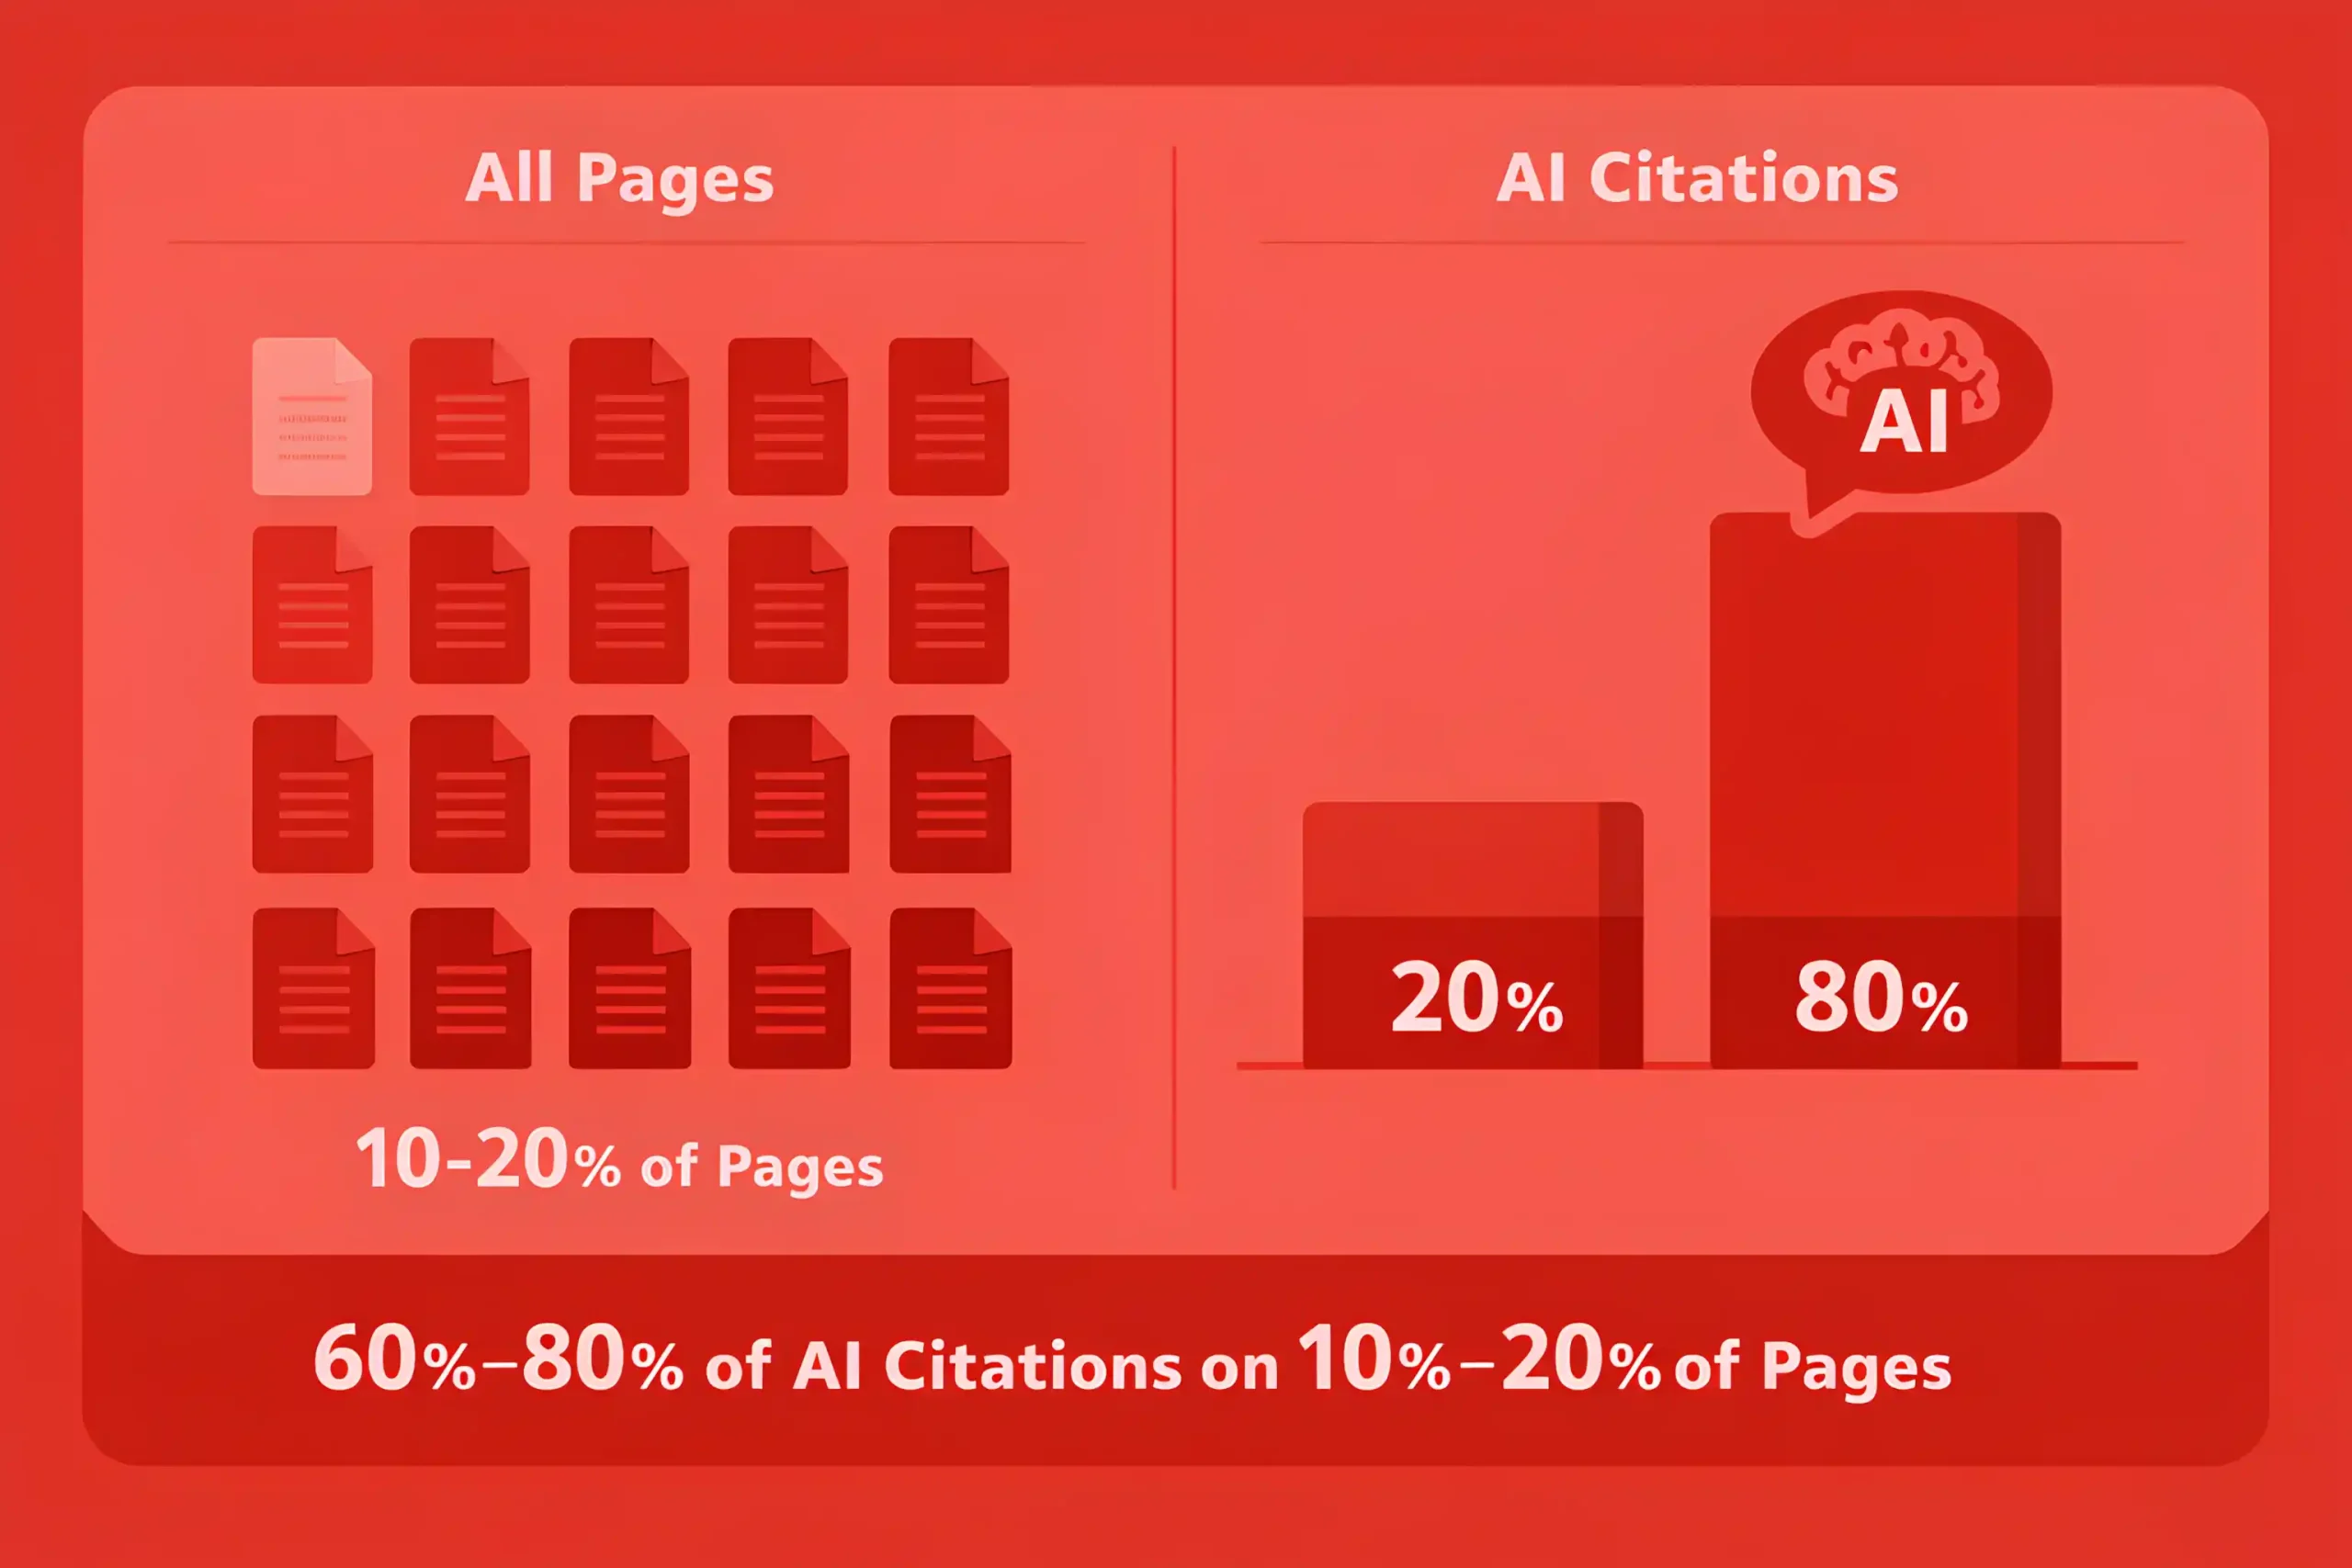
B2B SEO programs often see 60% to 80% of organic leads come from 10% to 20% of pages.
New content commonly takes 3 to 6 months to reach stable rankings and 6 to 12 months to become a consistent lead driver in competitive spaces.
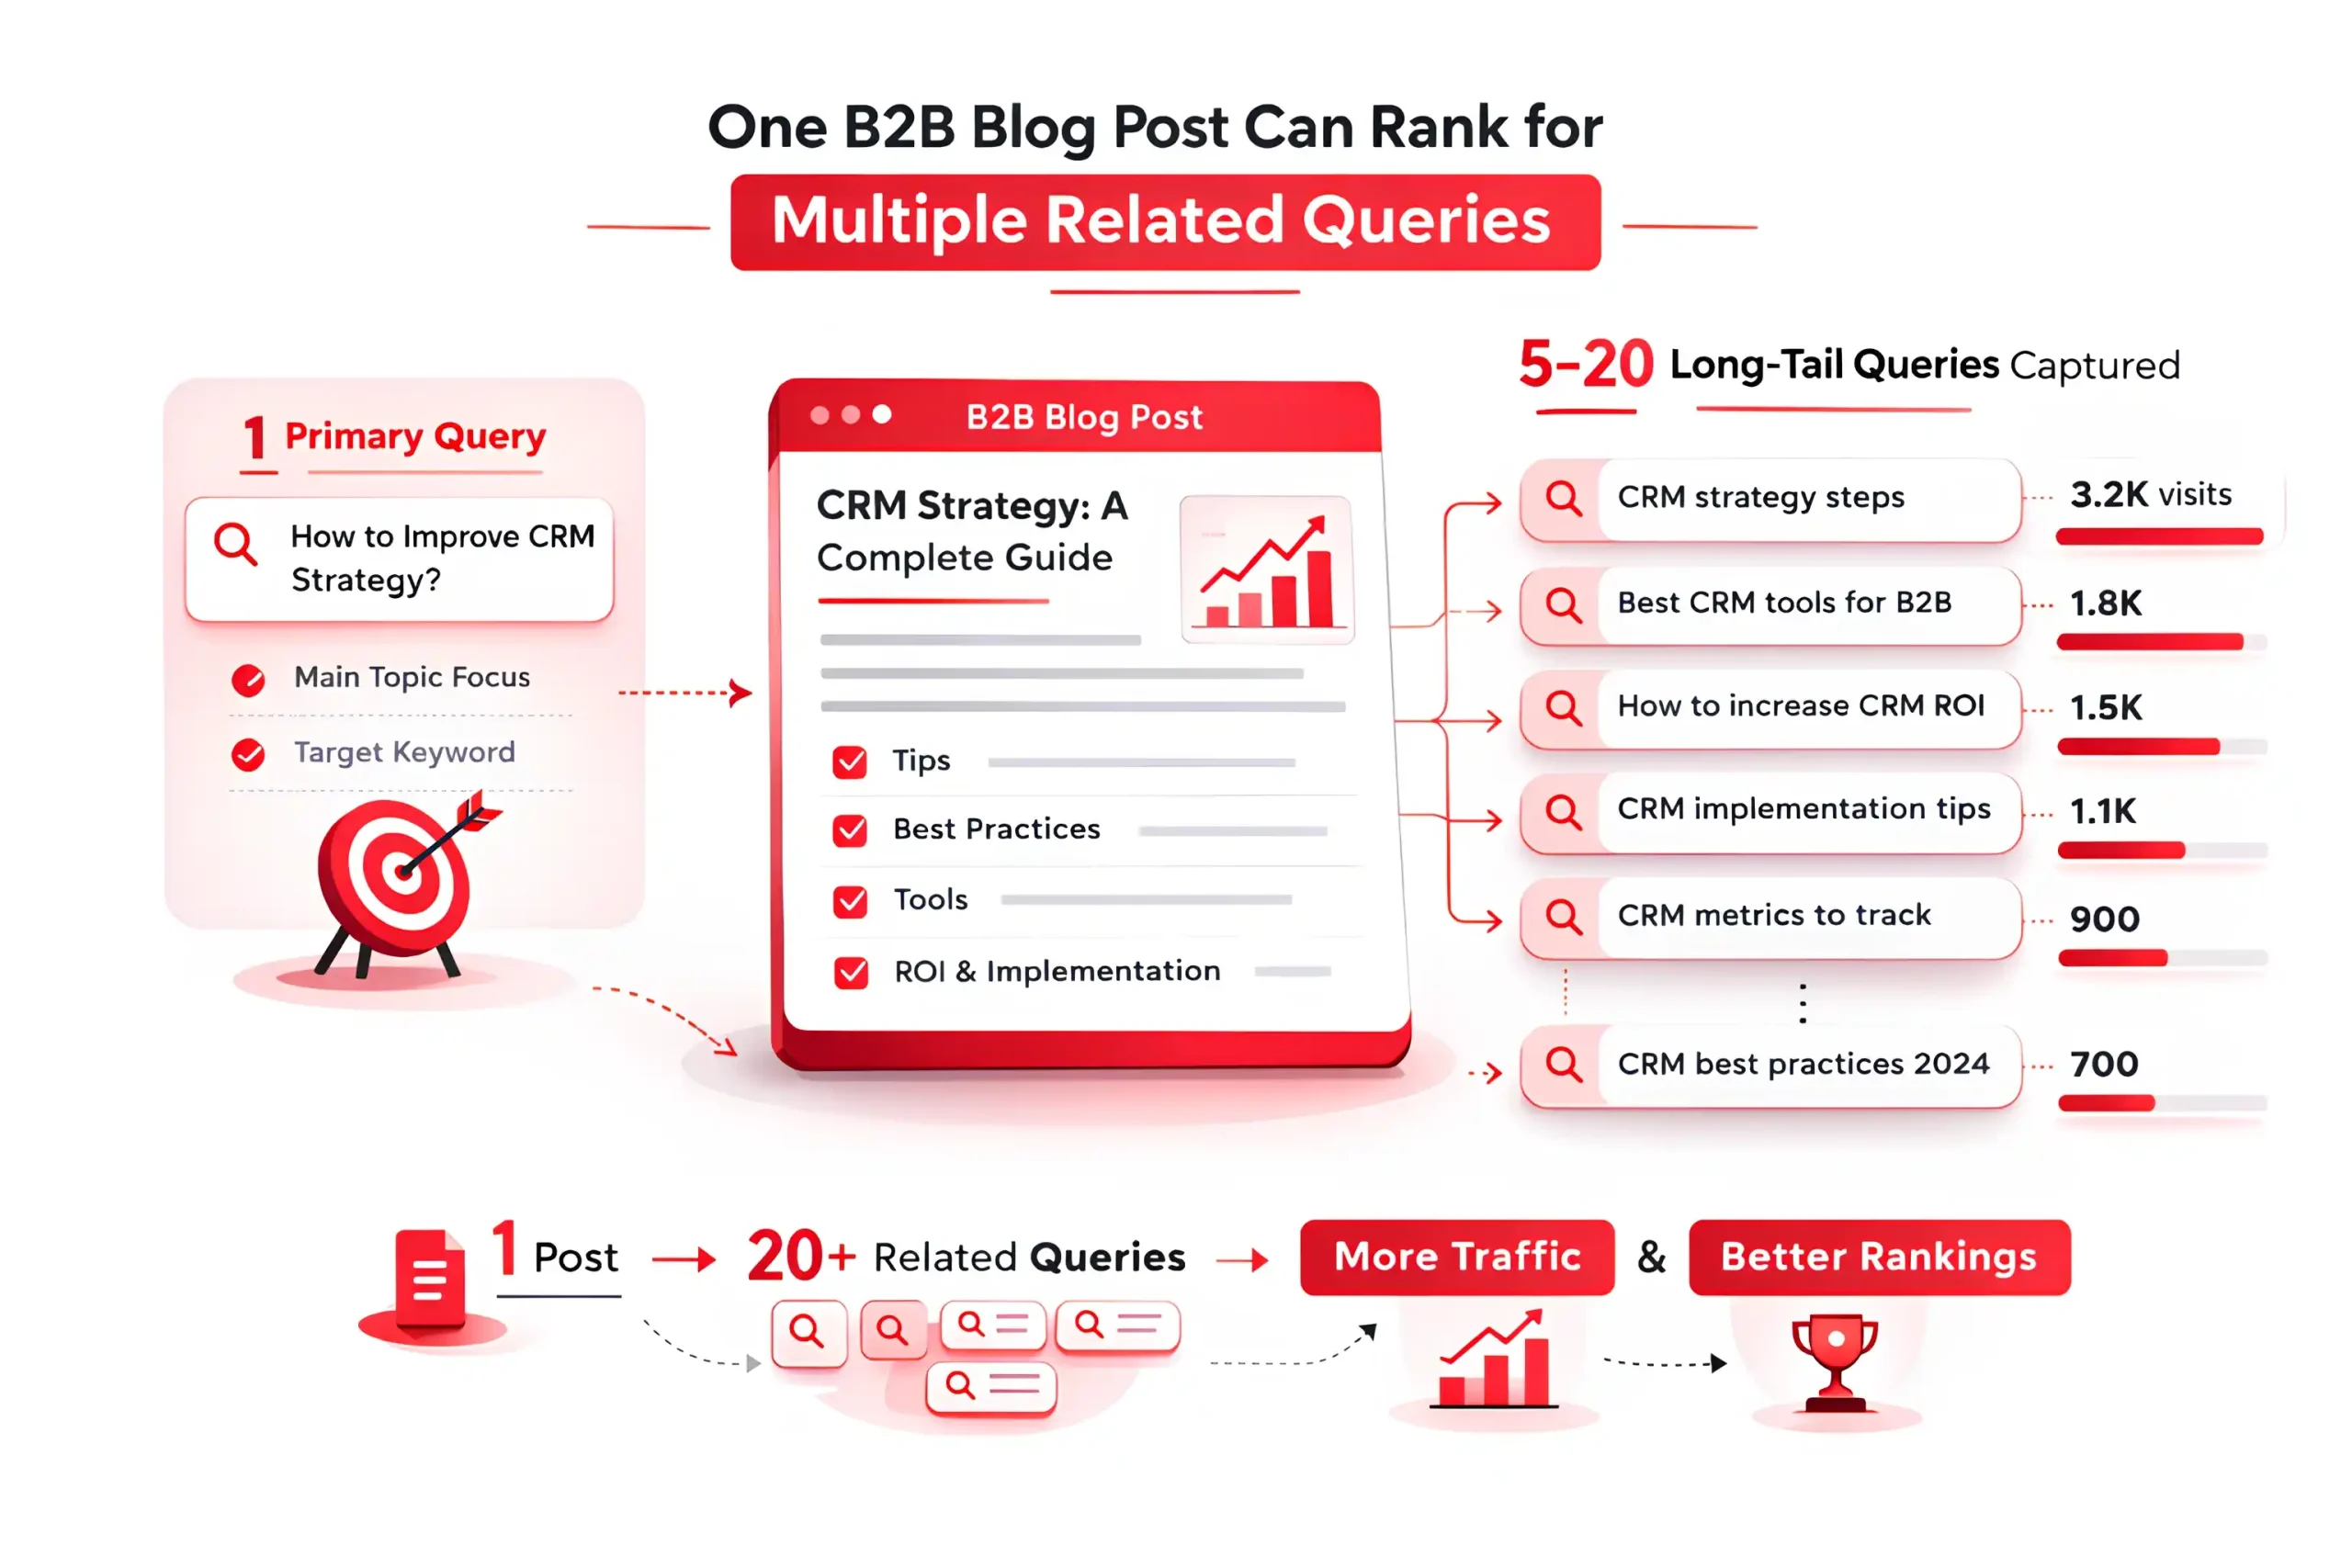
A typical B2B blog post targets 1 primary query theme, but high-performing posts often capture 5 to 20 related long tail queries.
Refreshes often outperform net new posts on ROI, with updated pages lifting organic traffic by 10% to 40% within 30 to 90 days, especially when paired with ongoing SEO services.
Content that matches evaluation intent, like comparisons and alternatives, often converts 1.5x to 3x higher than top funnel explainers.
Implementation, pricing, and integration pages often deliver the highest demo intent, with conversion rates 2x to 4x higher than informational content.
Topic clusters tend to lift internal pages, and a strong pillar plus supporting articles can raise total cluster traffic by 10% to 35% over a quarter.
Internal linking improvements often produce ranking lift within 2 to 8 weeks, especially for pages stuck in positions 6 to 20, and technical cleanup behind those gains is handled through technical SEO.
Content velocity has diminishing returns without quality, and publishing more can increase traffic 10% to 30%, but only when topical depth is built.
SERP features can suppress clicks, and click-through rates on informational queries often drop 10% to 35% when answer boxes or AI summaries appear.
Long-form B2B content often earns more backlinks, with link acquisition rates 1.5x to 3x higher than short posts in the same niche.
Original data and benchmarks often attract links, generating 2x to 6x more referring domains than generic advice posts, which is why linkable research is often distributed via a digital PR agency.
Case studies can support SEO indirectly, and organic-assisted conversion often rises 10% to 25% when stories are linked from key pages.
On-page clarity impacts outcomes, and pages that confirm audience fit early often reduce bounce by 5% to 15%.
Strong headers and scannable formatting often improve engagement, increasing time on page by 10% to 30% and scroll depth by 5% to 20%.
Featured snippet wins can boost clicks, and top pages often see 5% to 20% incremental traffic after snippet capture.
Email capture on high-traffic content can convert 0.5% to 2% of visitors into subscribers, depending on offer strength.
Organic visitors typically show higher intent than social, and conversion rates can be 10% to 40% higher on SEO sourced traffic.
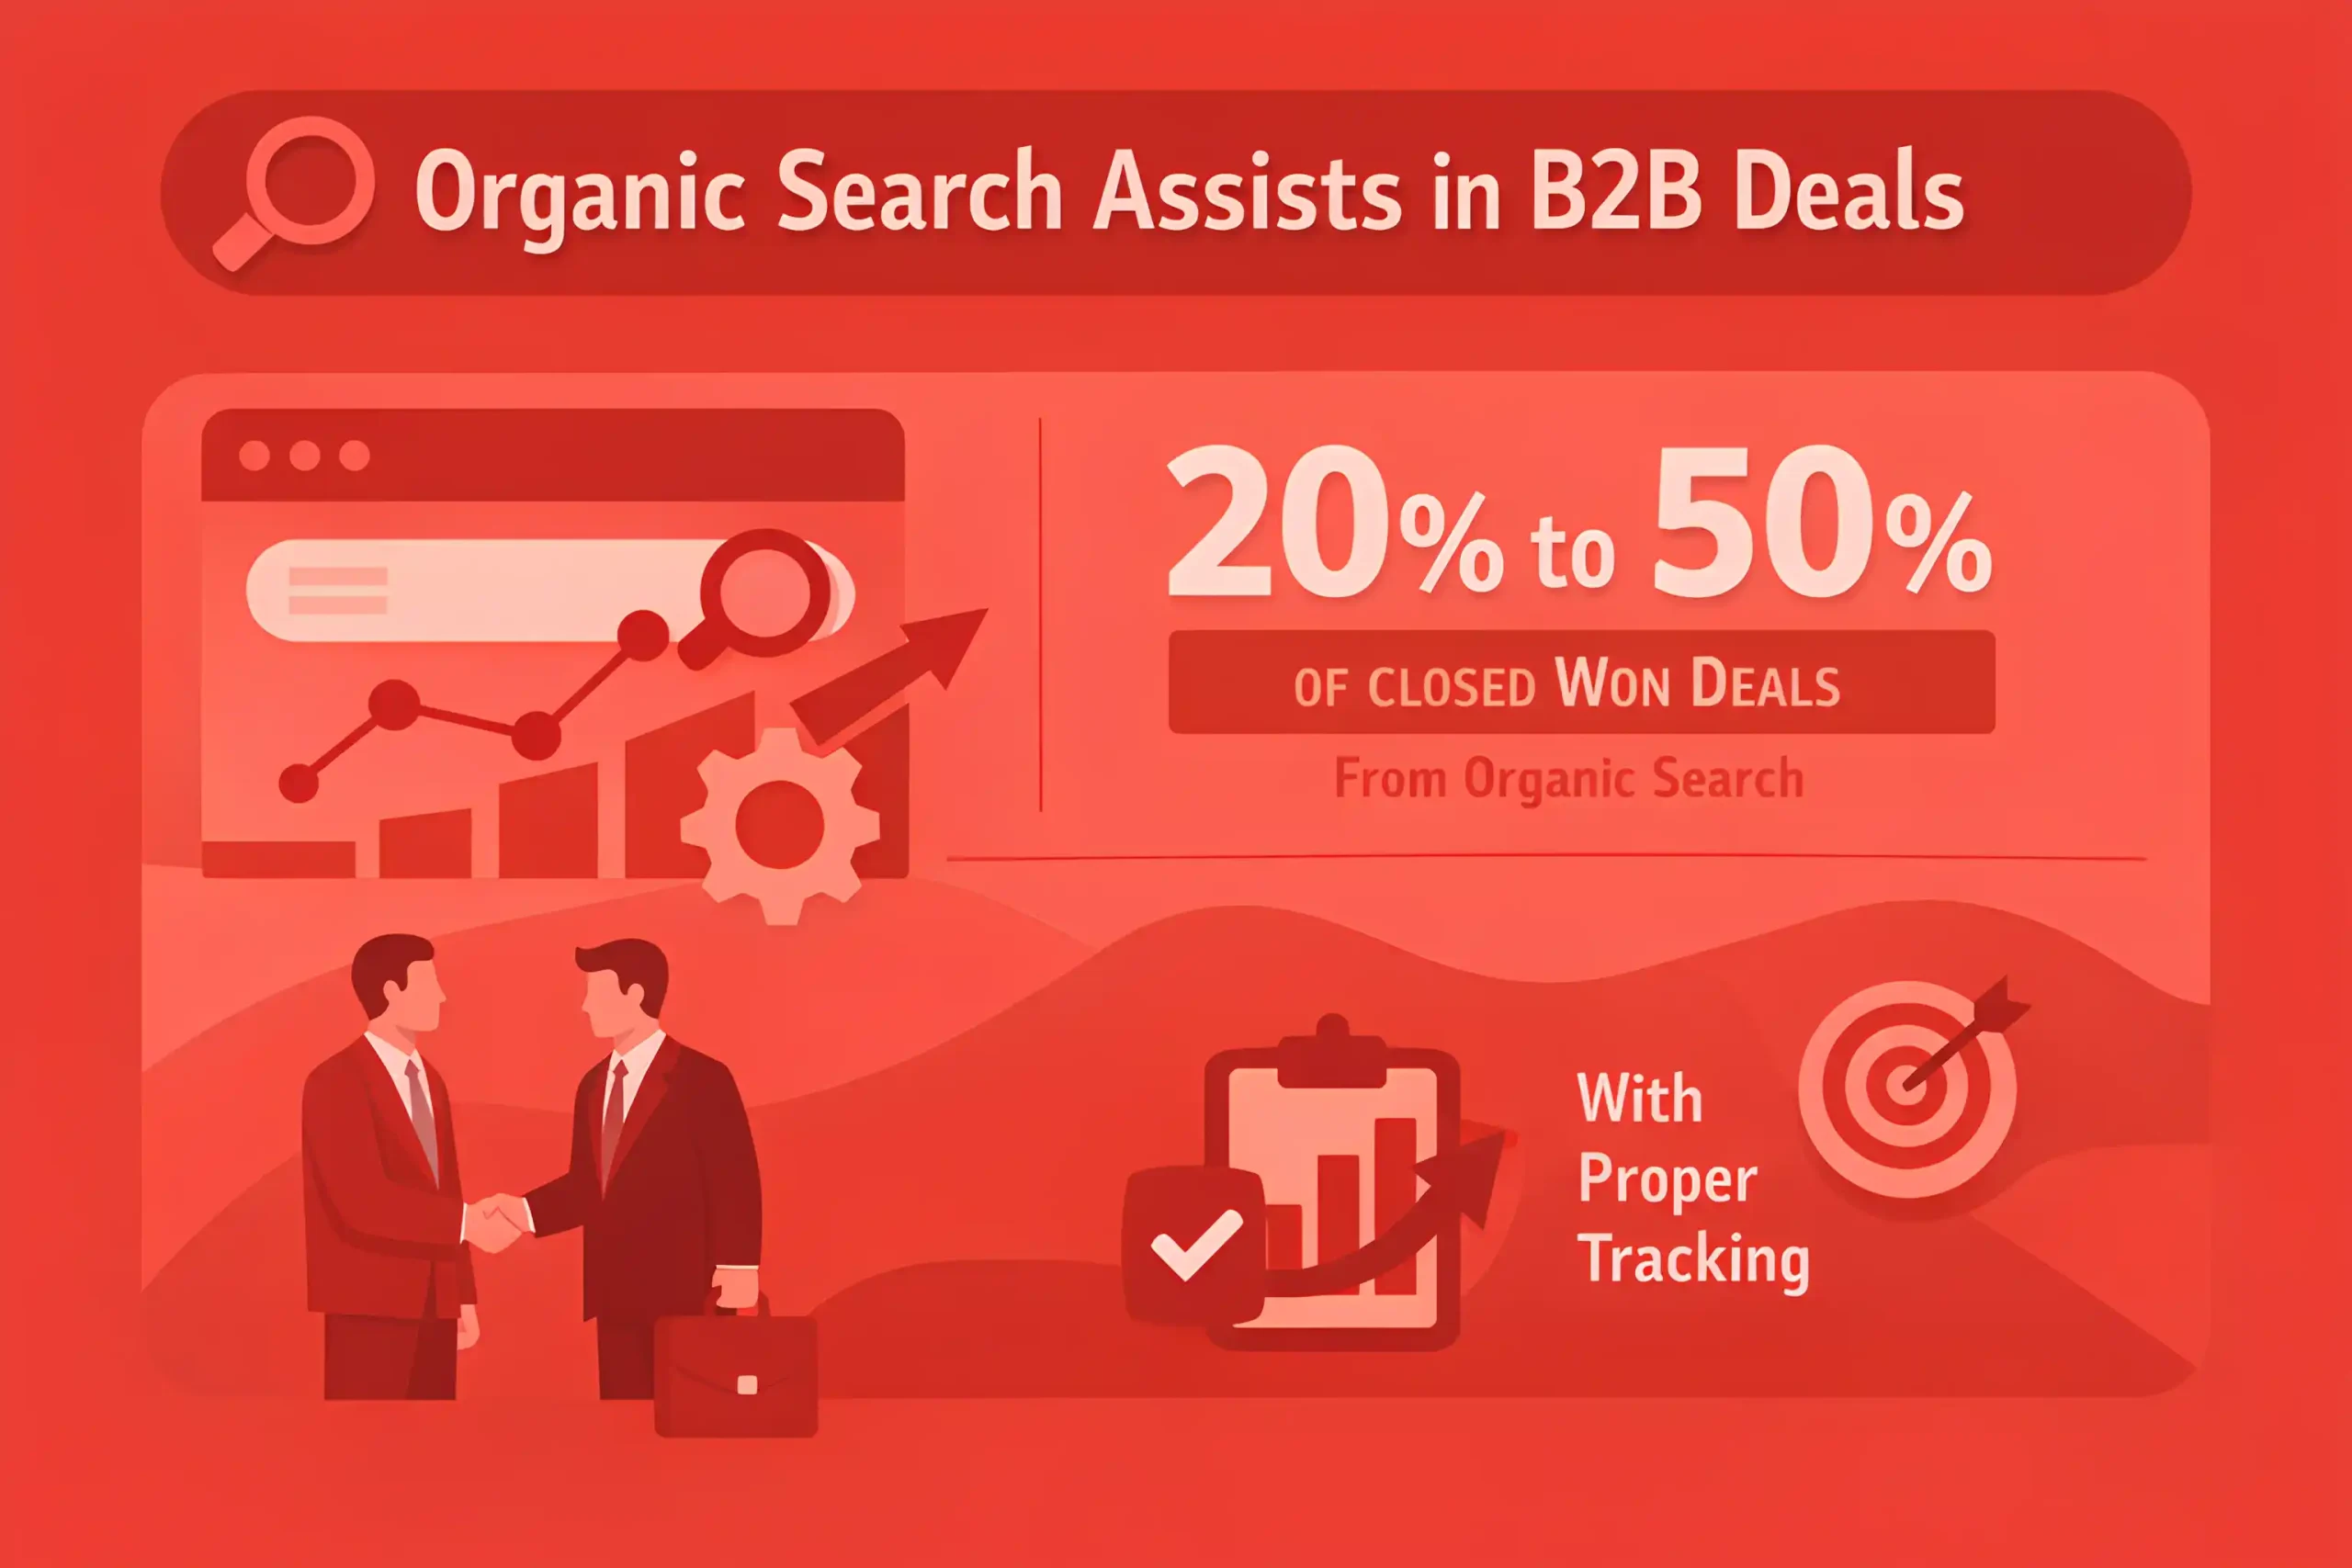
In many B2B programs, organic assists 20% to 50% of closed won deals when tracking is set up well.
The strongest compounding results come from fewer, deeper assets, and many teams see better outcomes by building 20 to 50 core pages instead of hundreds of thin posts.
Recommended reading: 100+ Content Marketing Statistics
AI SEO, AI Overviews & LLM Visibility Statistics
AI answer surfaces often appear on 10% to 40% of informational queries in categories with heavy “how-to” demand.
When an AI answer shows, organic click share for non-brand results often falls 10% to 35%.
Top positions usually lose less than mid-page results, and positions outside the top set can drop 15% to 50% in clicks.
Branded queries tend to stay more stable, with click changes often limited to 0% to 15%.
Citation links inside AI answers often send fewer clicks per impression, commonly 30% to 70% lower than classic blue links.
Pages cited by AI answers still win visibility, and conversion rates on resulting visits often run 10% to 30% higher due to stronger intent.
For many sites, AI-driven referral traffic lands as a small slice, often 1% to 8% of organic sessions, but grows fastest on Q&A-style content.
Coverage is uneven across a site, with 10% to 20% of pages capturing 60% to 80% of AI citations.
Content that answers the query in 2 to 6 tight paragraphs often earns more inclusion than long lead-ins.
Lists without a clear method often underperform, and adding criteria can lift citation likelihood by 10% to 25%.
Original research pages often earn 2x to 5x more AI citations than generic summaries, and those assets compound faster when distributed through digital PR campaigns.
Freshness matters more on fast-changing topics, and updates every 30 to 90 days often stabilize inclusion.
Entity clarity improves selection odds, and consistent naming plus topical focus can lift visibility by 10% to 30%.
Internal linking that reinforces clusters often increases citation share by 10% to 25% across related pages, which is a core outcome of a well-built content marketing program.
Structured data rarely guarantees inclusion, but clean markup plus strong on-page answers can raise odds by 5% to 15%.
Thin pages tend to lose out, and consolidation can improve performance, with traffic up 10% to 35% after pruning and merging.
Sites tracking “answer presence” often see week-to-week volatility of 15% to 40%, even when rankings look steady.
Click-through declines are most common on definition queries, while comparison and pricing queries often remain more resilient.
High authority domains keep an advantage, but smaller sites can break through with narrow expertise, earning citations in 1 to 3 focused subtopics.
The most reliable hedge is depth plus proof, since strong pages usually keep winning visibility even as clicks shift.
Related article: 200+ Social Media Marketing Statistics
ROI, Budget, Attribution & Pipeline Impact Statistics
B2B SEO budget allocation often lands around 10% to 25% of total marketing spend in teams treating organic as a core pipeline channel.
Monthly SEO program costs commonly range from $5K to $30K for mid-market teams once content, tech, and links are included.
Enterprise programs often run $30K to $150K+ per month when multiple markets, technical work, and production scale are involved.
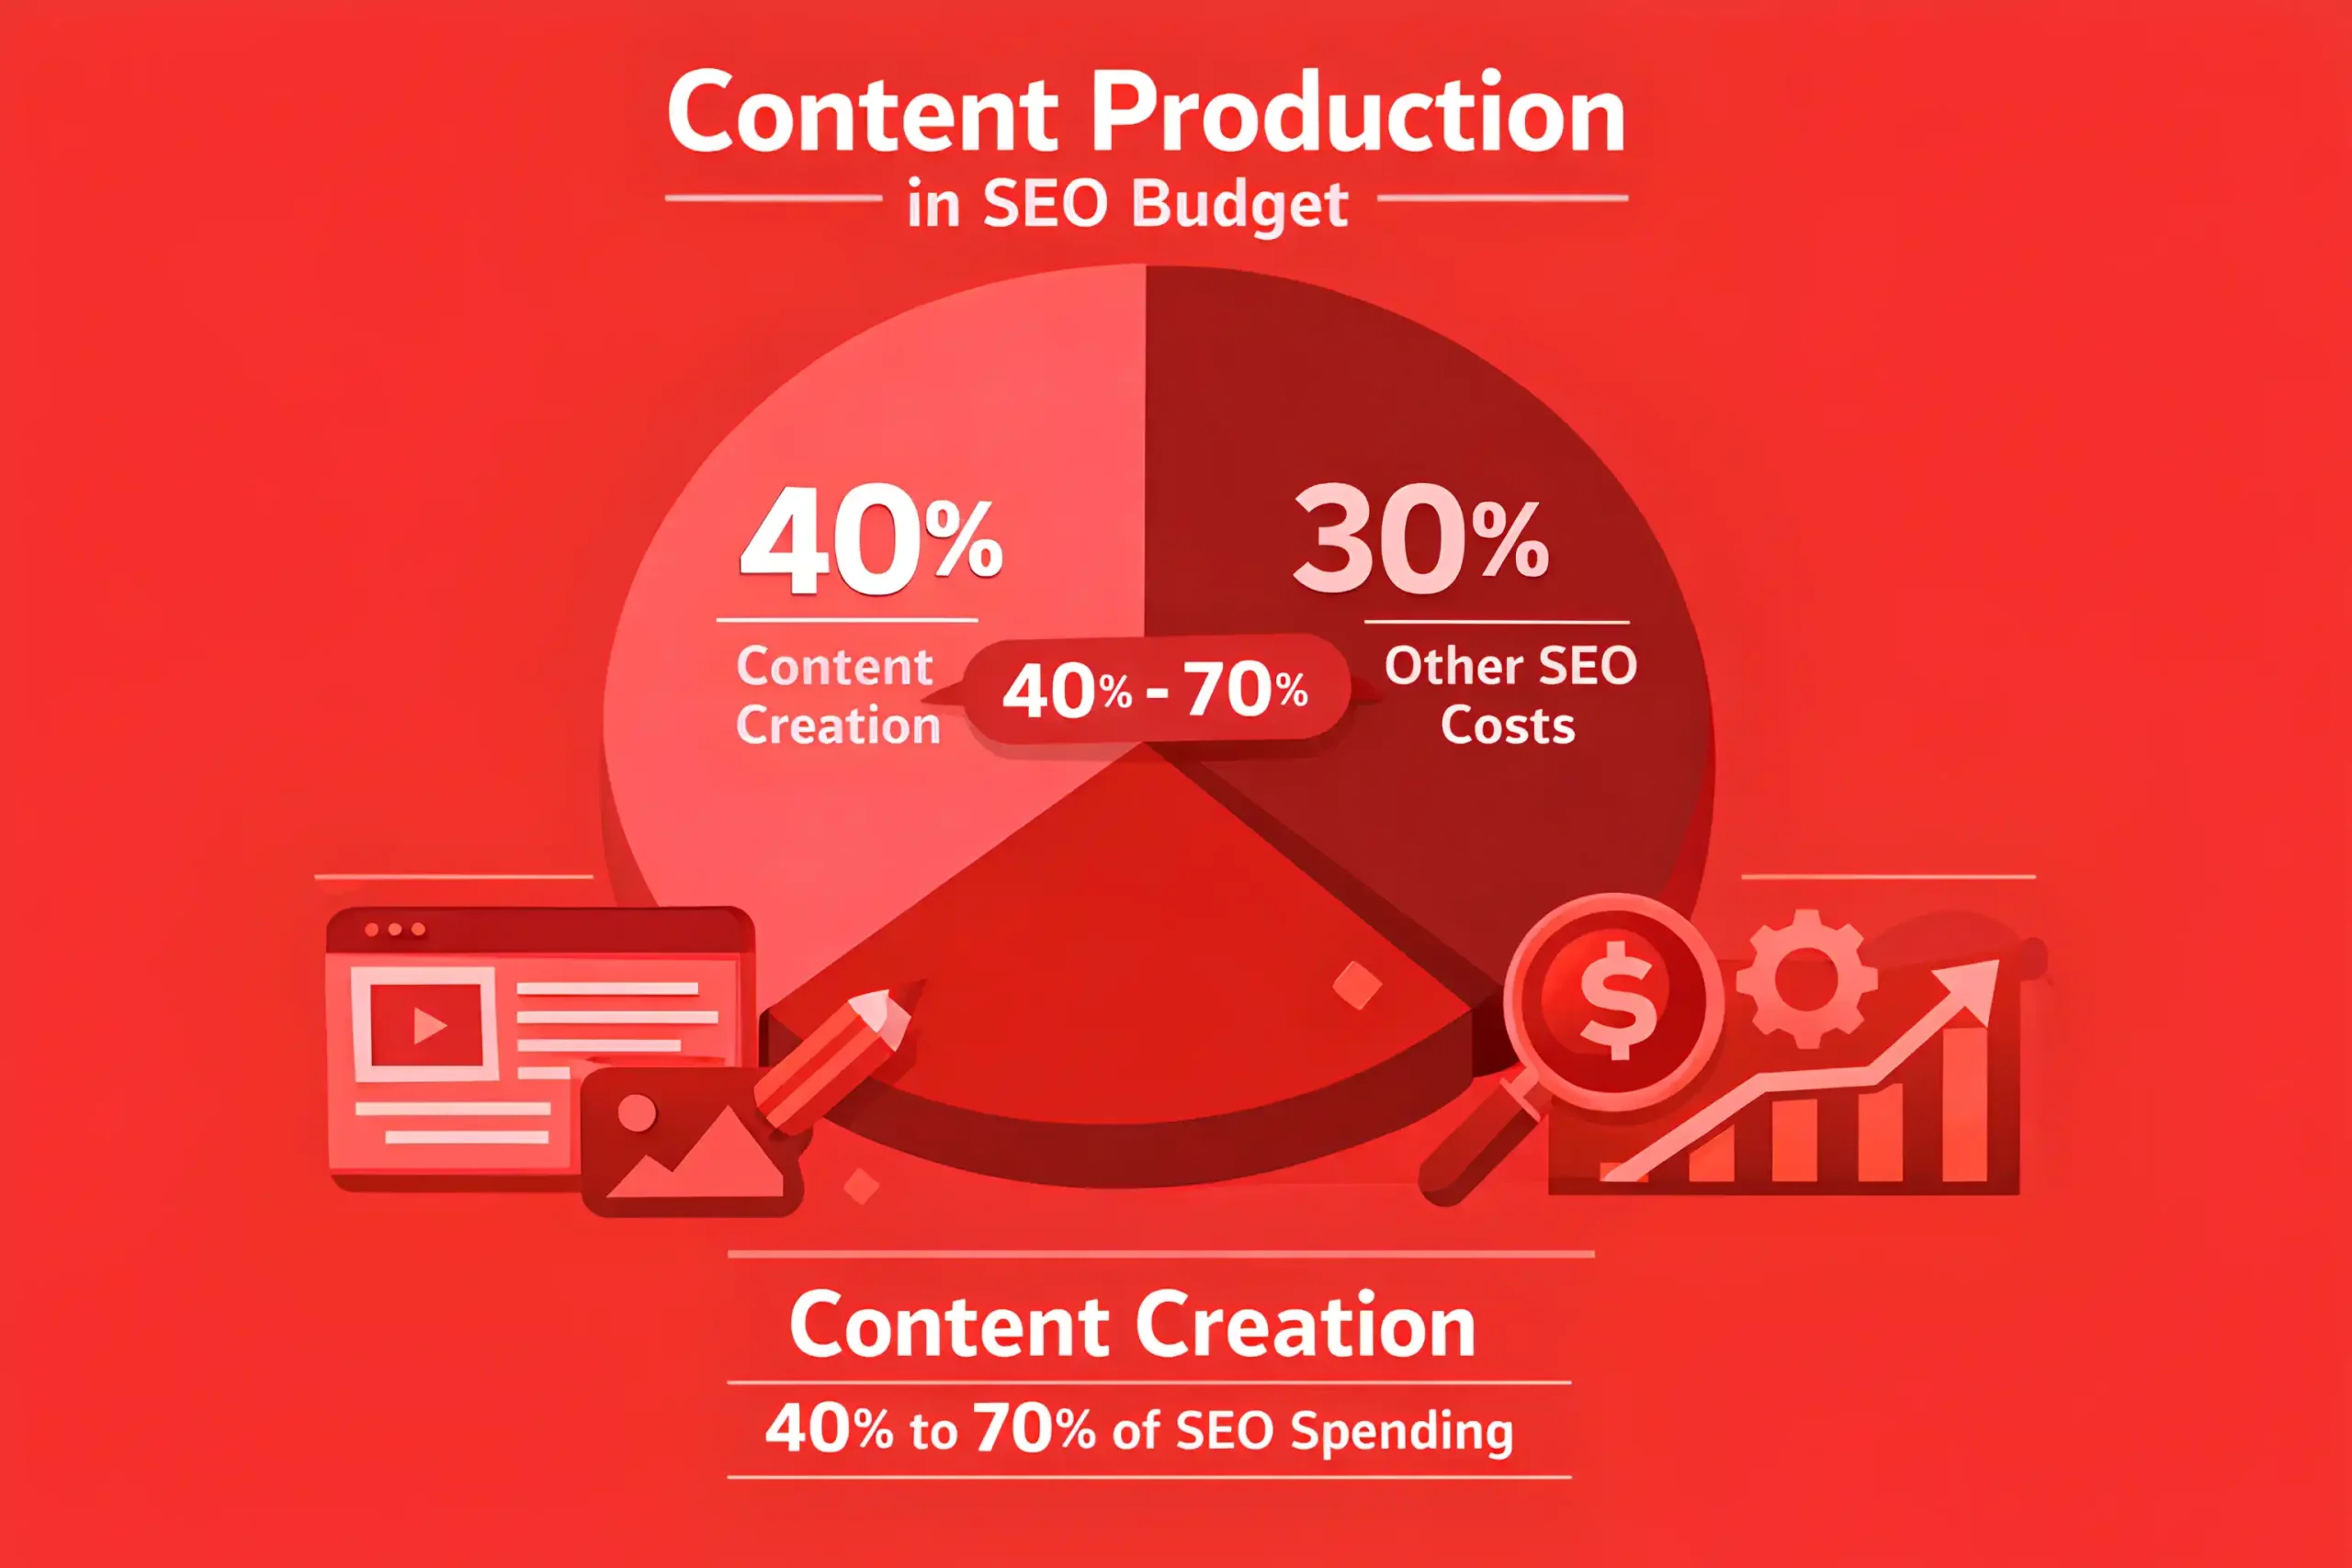
Content production usually represents 40% to 70% of total SEO spend in content strategies.
Technical SEO often accounts for 10% to 30% of spend, and spikes higher during migrations and platform changes.
Link acquisition and digital PR commonly take 10% to 35% of SEO budget in competitive categories.
A realistic payback window for SEO is often 6 to 12 months, with faster returns in niche markets and longer timelines in enterprise.
In many programs, organic sourced leads convert 10% to 40% higher than paid leads because intent is self-selected.
SEO often assists more pipeline than it directly sources, with assisted influence commonly 20% to 50% of closed won deals.
Attribution models frequently undercount organic, and the last click often captures only 30% to 60% of SEO influenced conversions.
Multi-touch attribution can increase reported SEO contribution by 20% to 80% compared to the last click.
Pipeline impact usually shows in stages, with early indicators moving in 30 to 90 days, and revenue impact following in 2 to 4 quarters.
Branded search growth is a leading signal, and many teams look for 10% to 30% uplift as organic visibility expands.
Organic traffic growth does not guarantee pipeline growth, and conversion rate changes of 5% to 20% often decide outcomes.
Improving a handful of high-intent pages can drive outsized results, with 5 to 15 pages influencing 30% to 60% of the SEO pipeline.
Conversion rate optimization on organic landing pages often lifts lead volume by 10% to 35% without traffic growth, which is exactly the goal of conversion rate optimization.
SEO plus retargeting frequently compounds impact, and blended CAC can drop, which is why many programs pair organic with B2B PPC.
In ABM motions, organic content often plays a supporting role, contributing to 15% to 40% of account engagement journeys.
Teams that report SEO in business terms often win budget more consistently, and renewals are 10% to 25% higher when pipeline reporting is clear.
The strongest ROI usually comes from fewer, higher-intent assets and consistent technical maintenance, not a high-volume publishing treadmill.
The Key Takeaways
B2B SEO looks simple from the outside. Publish content, earn rankings, collect leads. In practice, most teams spend months doing “SEO work” and still cannot explain what is driving the pipeline. Traffic increases in one area, conversions stagnate in another, and reporting becomes a debate about attribution.
The teams that win treat SEO like a revenue program. They map topics to buying stages, build a small set of pages that answer real evaluation questions, and keep technical issues from quietly throttling performance.
As AI-generated answers take up more space on the results page, they also emphasize the basics: clear first paragraphs, stronger proof, and content that earns citations because it conveys something specific.