
A year ago, AI was still treated like a test. One person tried it for ideas, another used it to speed up drafts, and most work still ran the usual way. Now AI sits inside the marketing stack. It touches planning, creative production, paid media, lifecycle messaging, analytics, and customer support.
As the tools spread, a real problem appears fast: decisions move quickly, but claims about results move even quicker.
At NEWMEDIA.COM, our 2026 updated collection brings together more than 100+ AI marketing statistics across adoption, budget shifts, use cases, performance impact, and governance. Use the numbers to set expectations across the team, decide where AI belongs in the workflow, and back priorities with data instead of opinions.
AI Adoption & Usage in Marketing Teams
Marketing teams reporting active AI use often land in the 55% to 85% range.
Weekly AI usage among marketers commonly sits around 60% to 80% once basic access is rolled out.
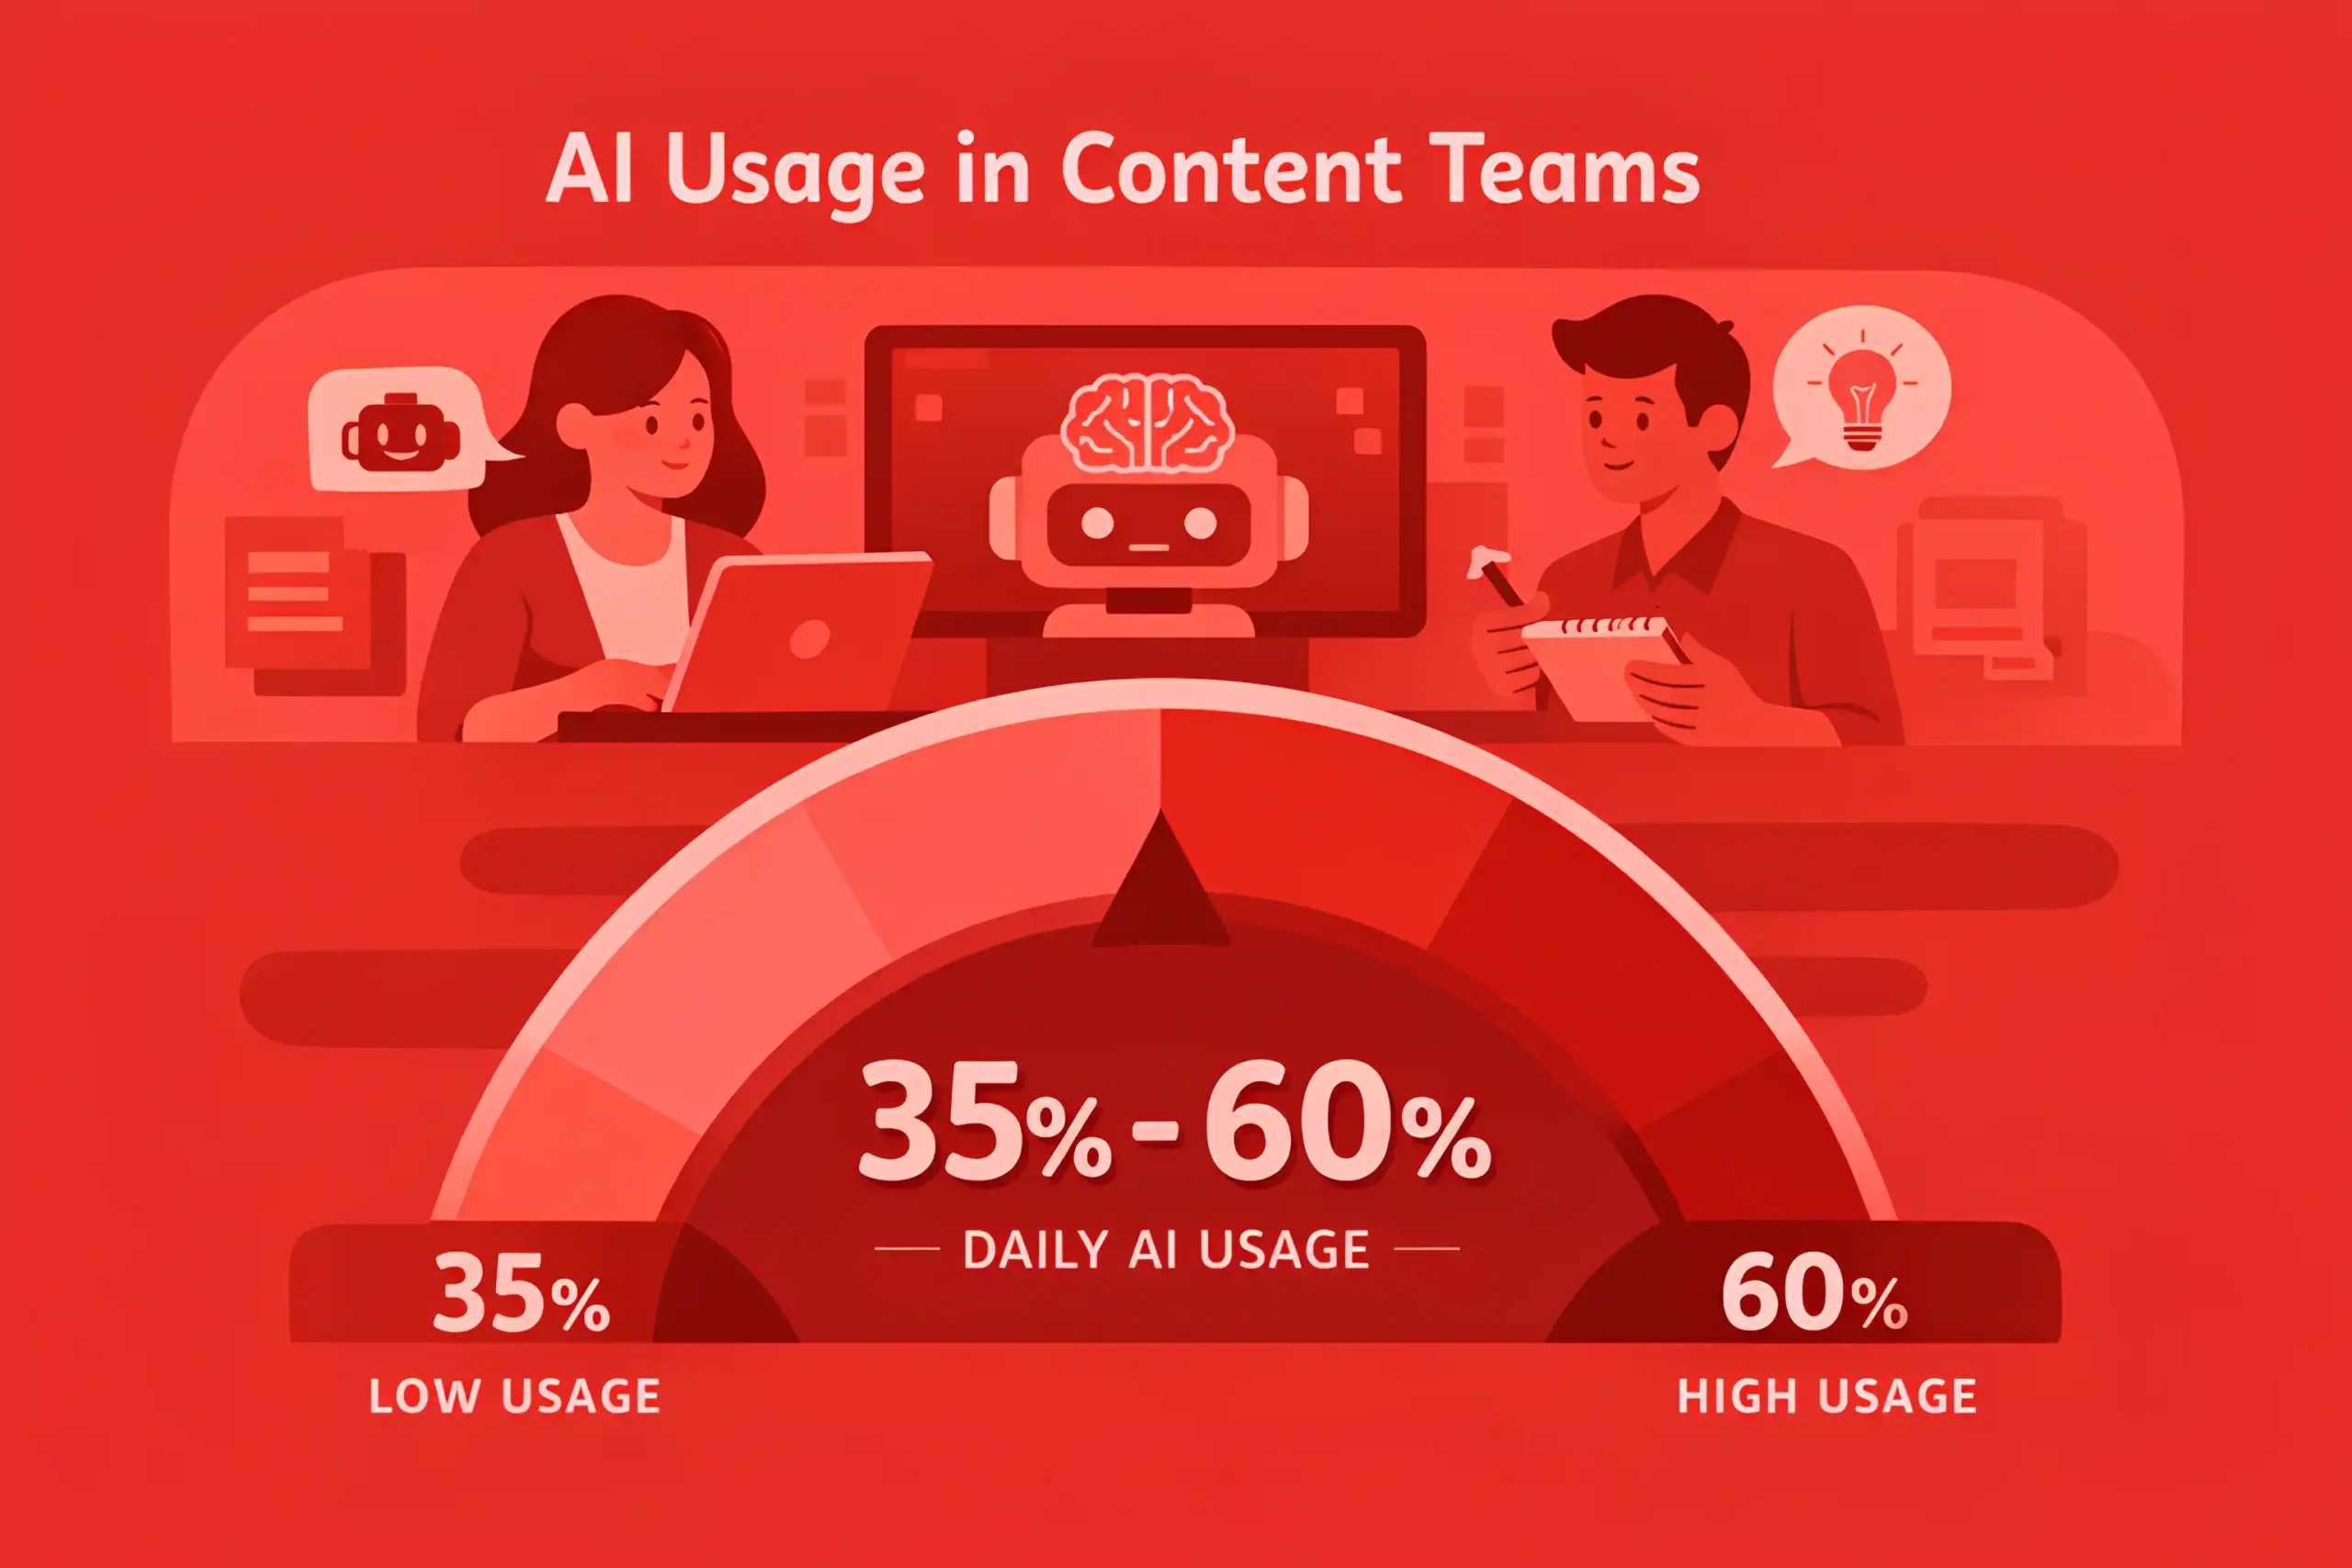
Daily AI usage inside content-heavy teams often reaches 35% to 60%.
The share of marketers using AI for research and outlining is often 50% to 75%.
Use for first draft copy and variations commonly falls around 40% to 70%.
Use for ad creative iterations and paid media testing support often sits around 30% to 55%.
Use for email subject lines, segmentation ideas, and lifecycle content commonly lands in the 35% to 60% range.
Use for SEO tasks like clustering, SERP patterning, and internal linking support often reaches 40% to 65%, which is a core part of AI SEO.
Teams typically run 2 to 5 AI tools in parallel when usage matures beyond experimentation.
Most teams start with individual use, then shift to shared workflows within 6 to 12 weeks.
Time saved claims are usually highest in drafting and repurposing, commonly 20% to 40% per asset.
The use for ad creative iterations and paid media testing support often sits around 30% to 55%.
Time saved in research and synthesis often lands around 15% to 35%, depending on review standards.
Quality gains show up later than speed gains, with meaningful uplift often taking 8 to 16 weeks of prompt and process tuning.
A working governance layer usually includes policy, examples, and approvals, and adoption often reaches only 30% to 50% without it.
Teams with lightweight guidelines and QA steps often reduce rework by 10% to 25% compared to ad hoc usage.
Training tends to be uneven, and 40% to 70% of users rely on self-taught habits without a shared playbook.
Brand voice drift is a common early issue, with 20% to 40% of AI-assisted drafts needing heavy rewriting until guardrails are set.
Human review remains the norm for publishable work, with 80% to 95% of teams keeping final approval with a senior marketer or editor.
Teams that treat AI as a workflow organizer often increase output without increasing headcount by 10% to 30%, and many quantify baseline visibility through a RankOS™ audit.
You might also find interesting: 100+ Content Marketing Statistics
Budgets, Spend, and ROI of AI Marketing
AI tooling spend is often a small slice of the marketing budget, commonly 1% to 5%, but rising fastest inside content and performance teams that already run structured digital marketing.
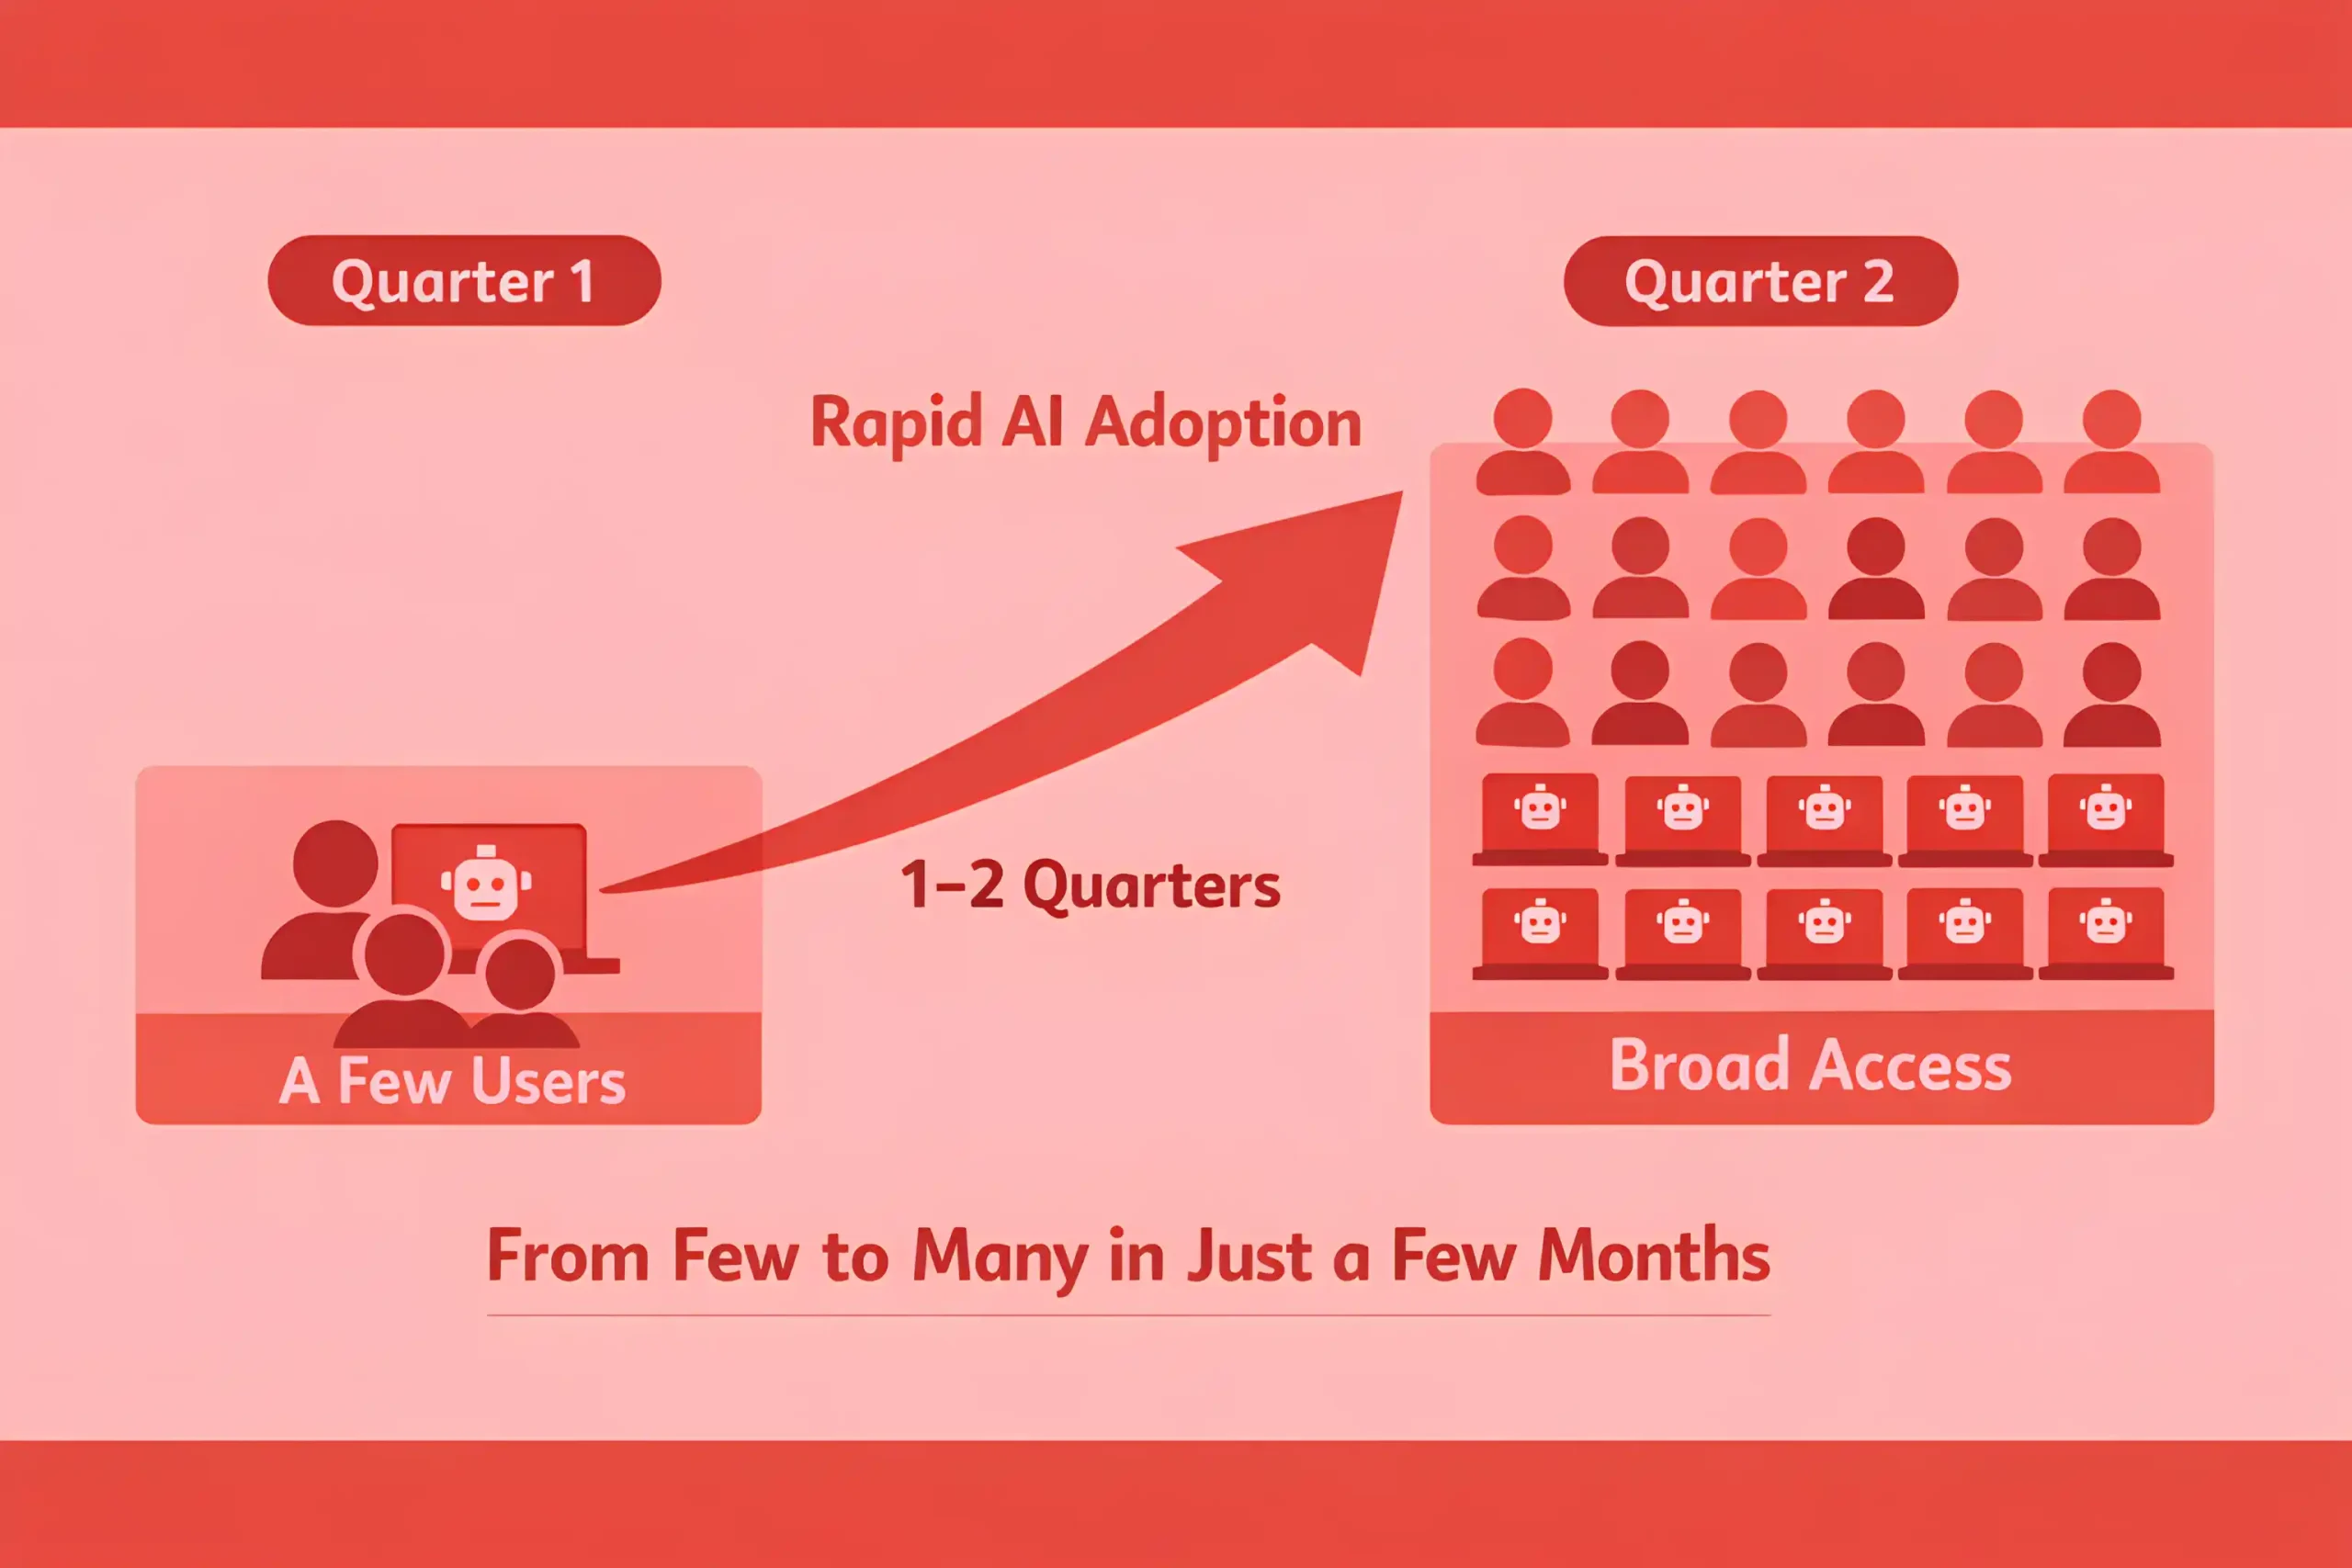
Teams that commit to AI typically move from a few seats to broad access within 1 to 2 quarters.
Per user AI software cost often lands around $20 to $80 per month, before add-ons for enterprise controls.
Enterprise plans with security and governance commonly range from $50 to $200 per user per month.
Total annual AI marketing spend often clusters between $5,000 and $50,000 for small to mid-sized teams, depending on headcount and tooling depth.
Larger teams often run $50,000 to $250,000 per year once data access and approvals are included.
The fastest early ROI is usually time saved, with productivity gains commonly estimated at 10% to 30% across content workflows.
Teams that standardize prompts and QA often push time saved to 25% to 45% for drafting and repurposing work.
Paid media teams often report faster testing cycles, with iteration speed improving 15% to 35% when AI generates variations, which fits naturally inside PPC management.
ROI from personalization tends to show up as lift, often 5% to 20% on click or conversion when targeting is already solid.
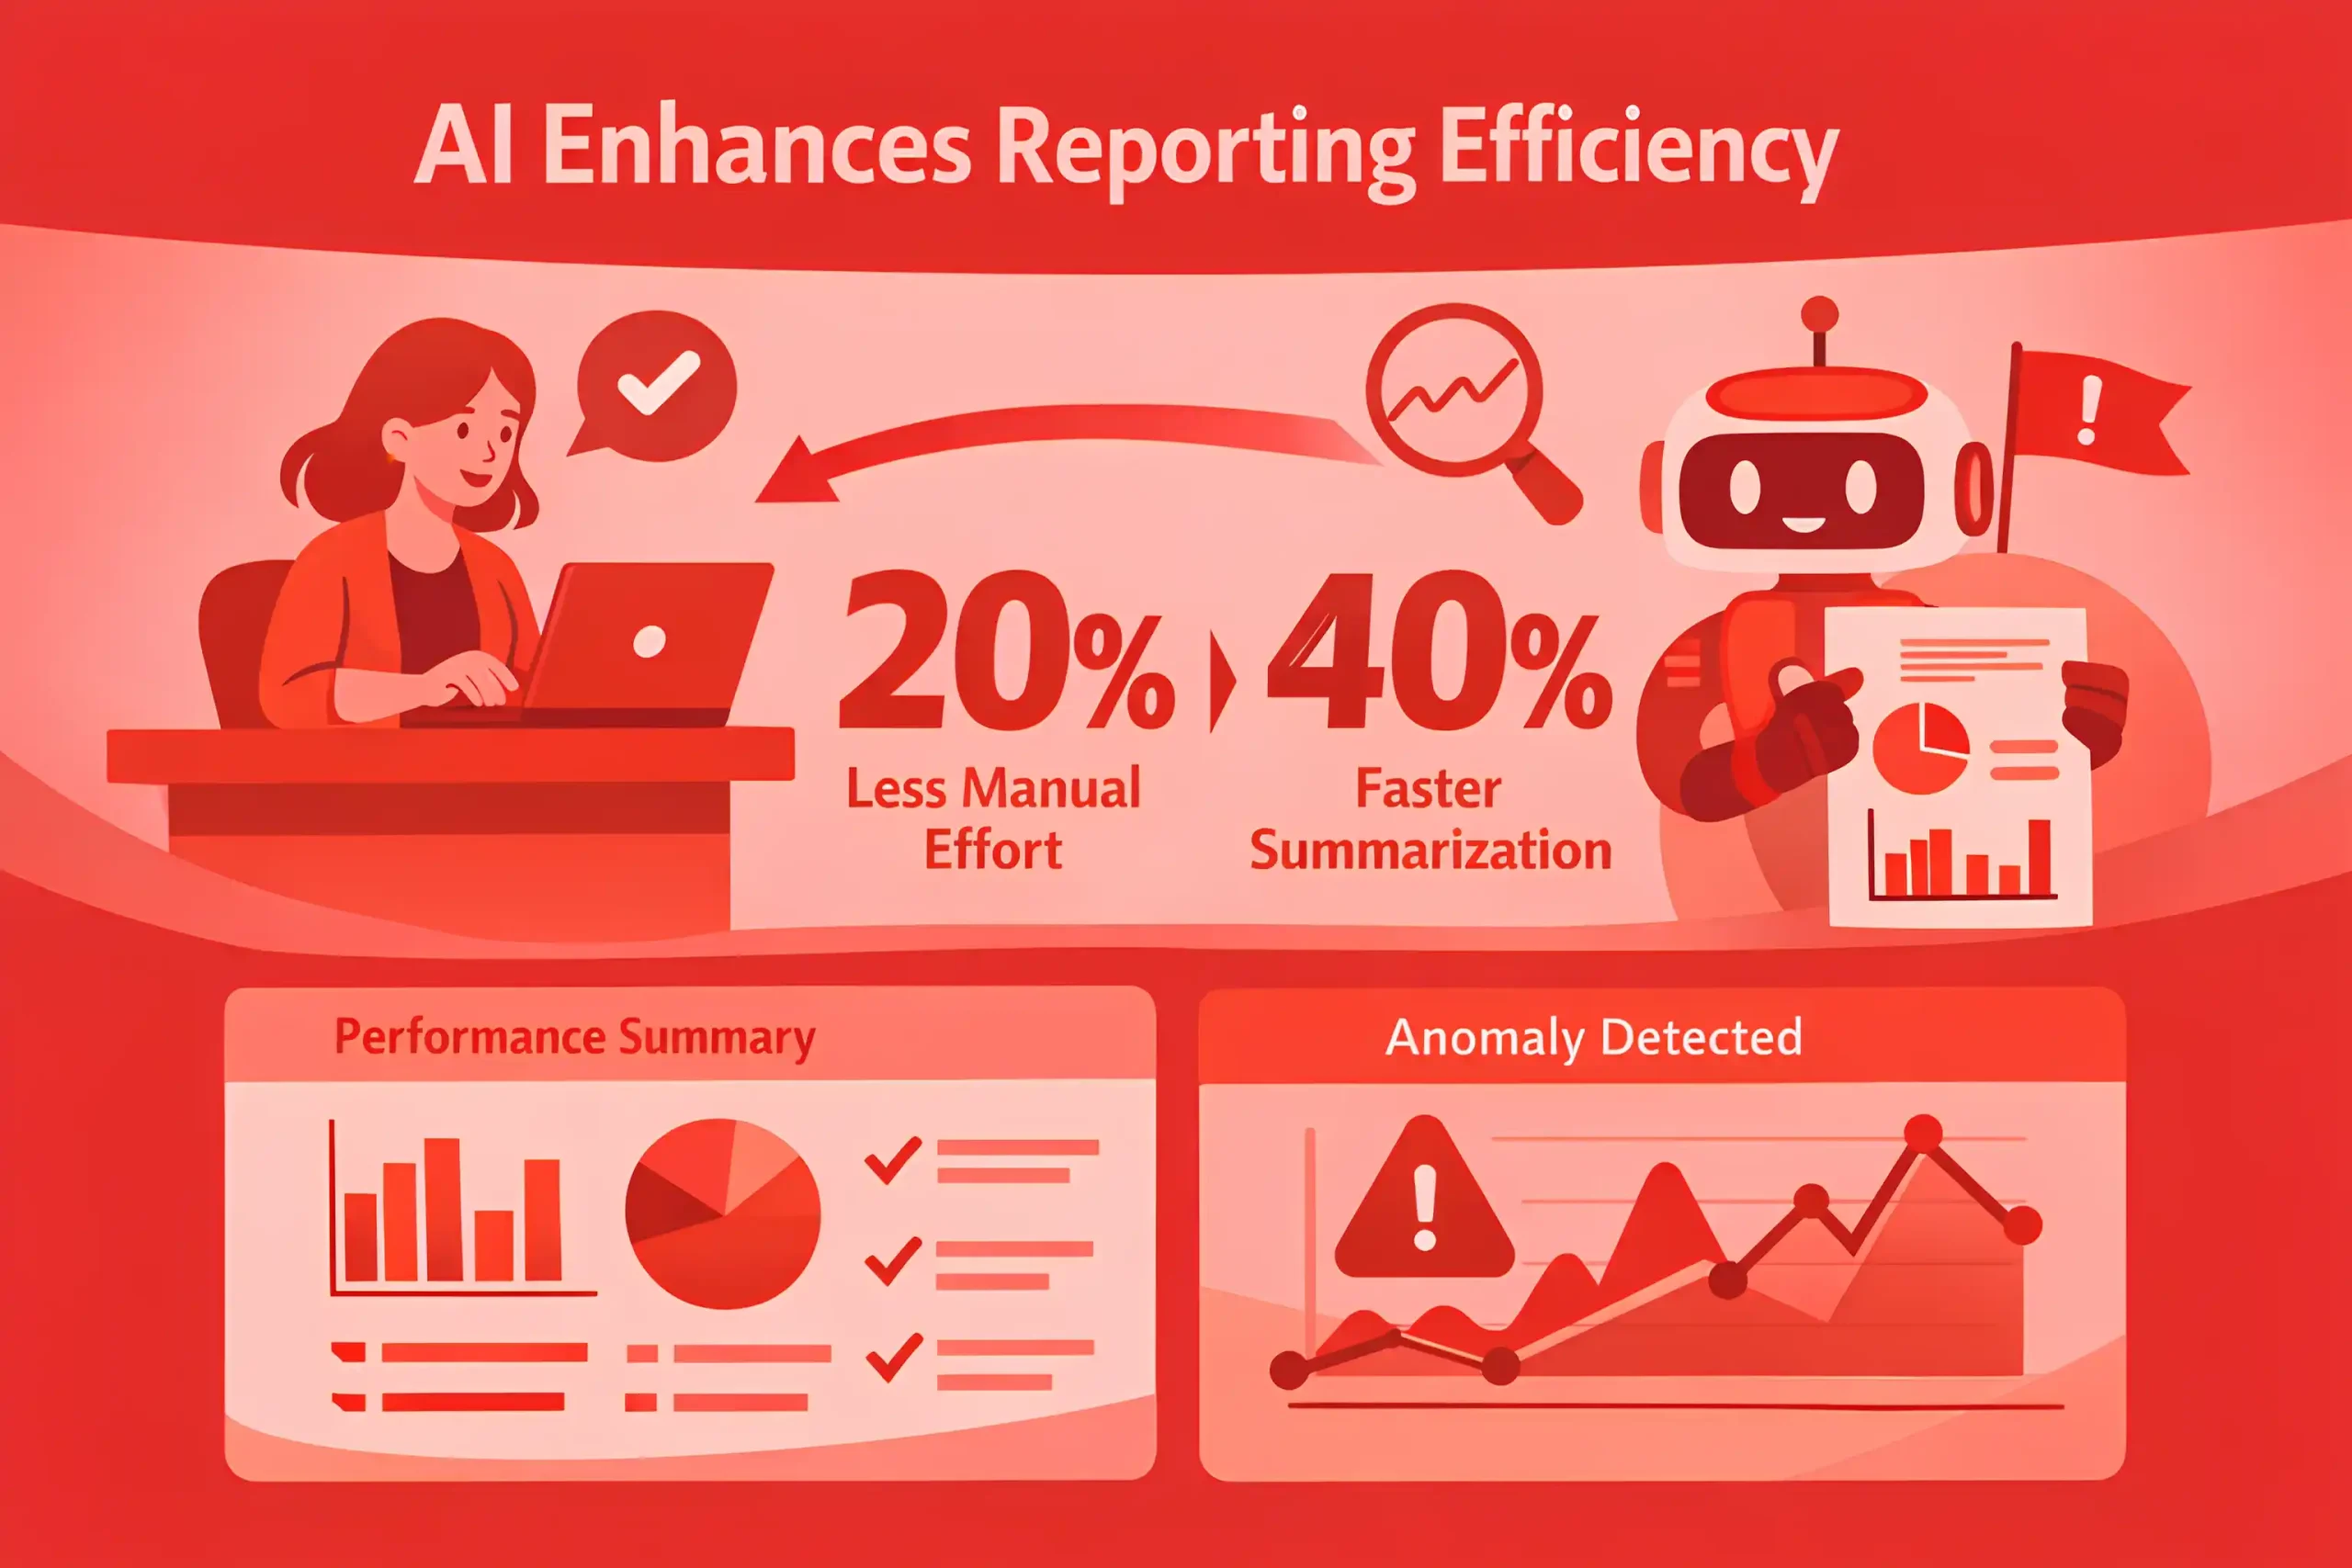
Analytics and reporting use often reduces manual effort by 20% to 40% when dashboards and summaries are automated, especially in programs managed through programmatic advertising.
The payback window for basic AI tooling is often 30 to 90 days when it replaces freelancer or contractor hours.
If AI spend is layered on top of existing costs without a process change, realized ROI often falls below 10%.
Governance and QA add overhead, commonly 5% to 15% of total workflow time, but protect brand and compliance risk.
Teams that invest in enablement often spend 5% to 10% of the AI budget on training and playbooks.
Budget justification is easiest when tied to throughput, with many teams targeting 10% to 25% more output at similar headcount, a common KPI framework in marketing strategy.
A common benchmark is to reallocate 5% to 15% of agency or contractor spend into AI tools and internal capability.
Costs rise sharply when proprietary data is connected, often adding 20% to 60% to the total tool stack.
The most consistent ROI shows up when AI is used in repeatable workflows, not one-off experiments, which is the core operating model behind performance marketing.
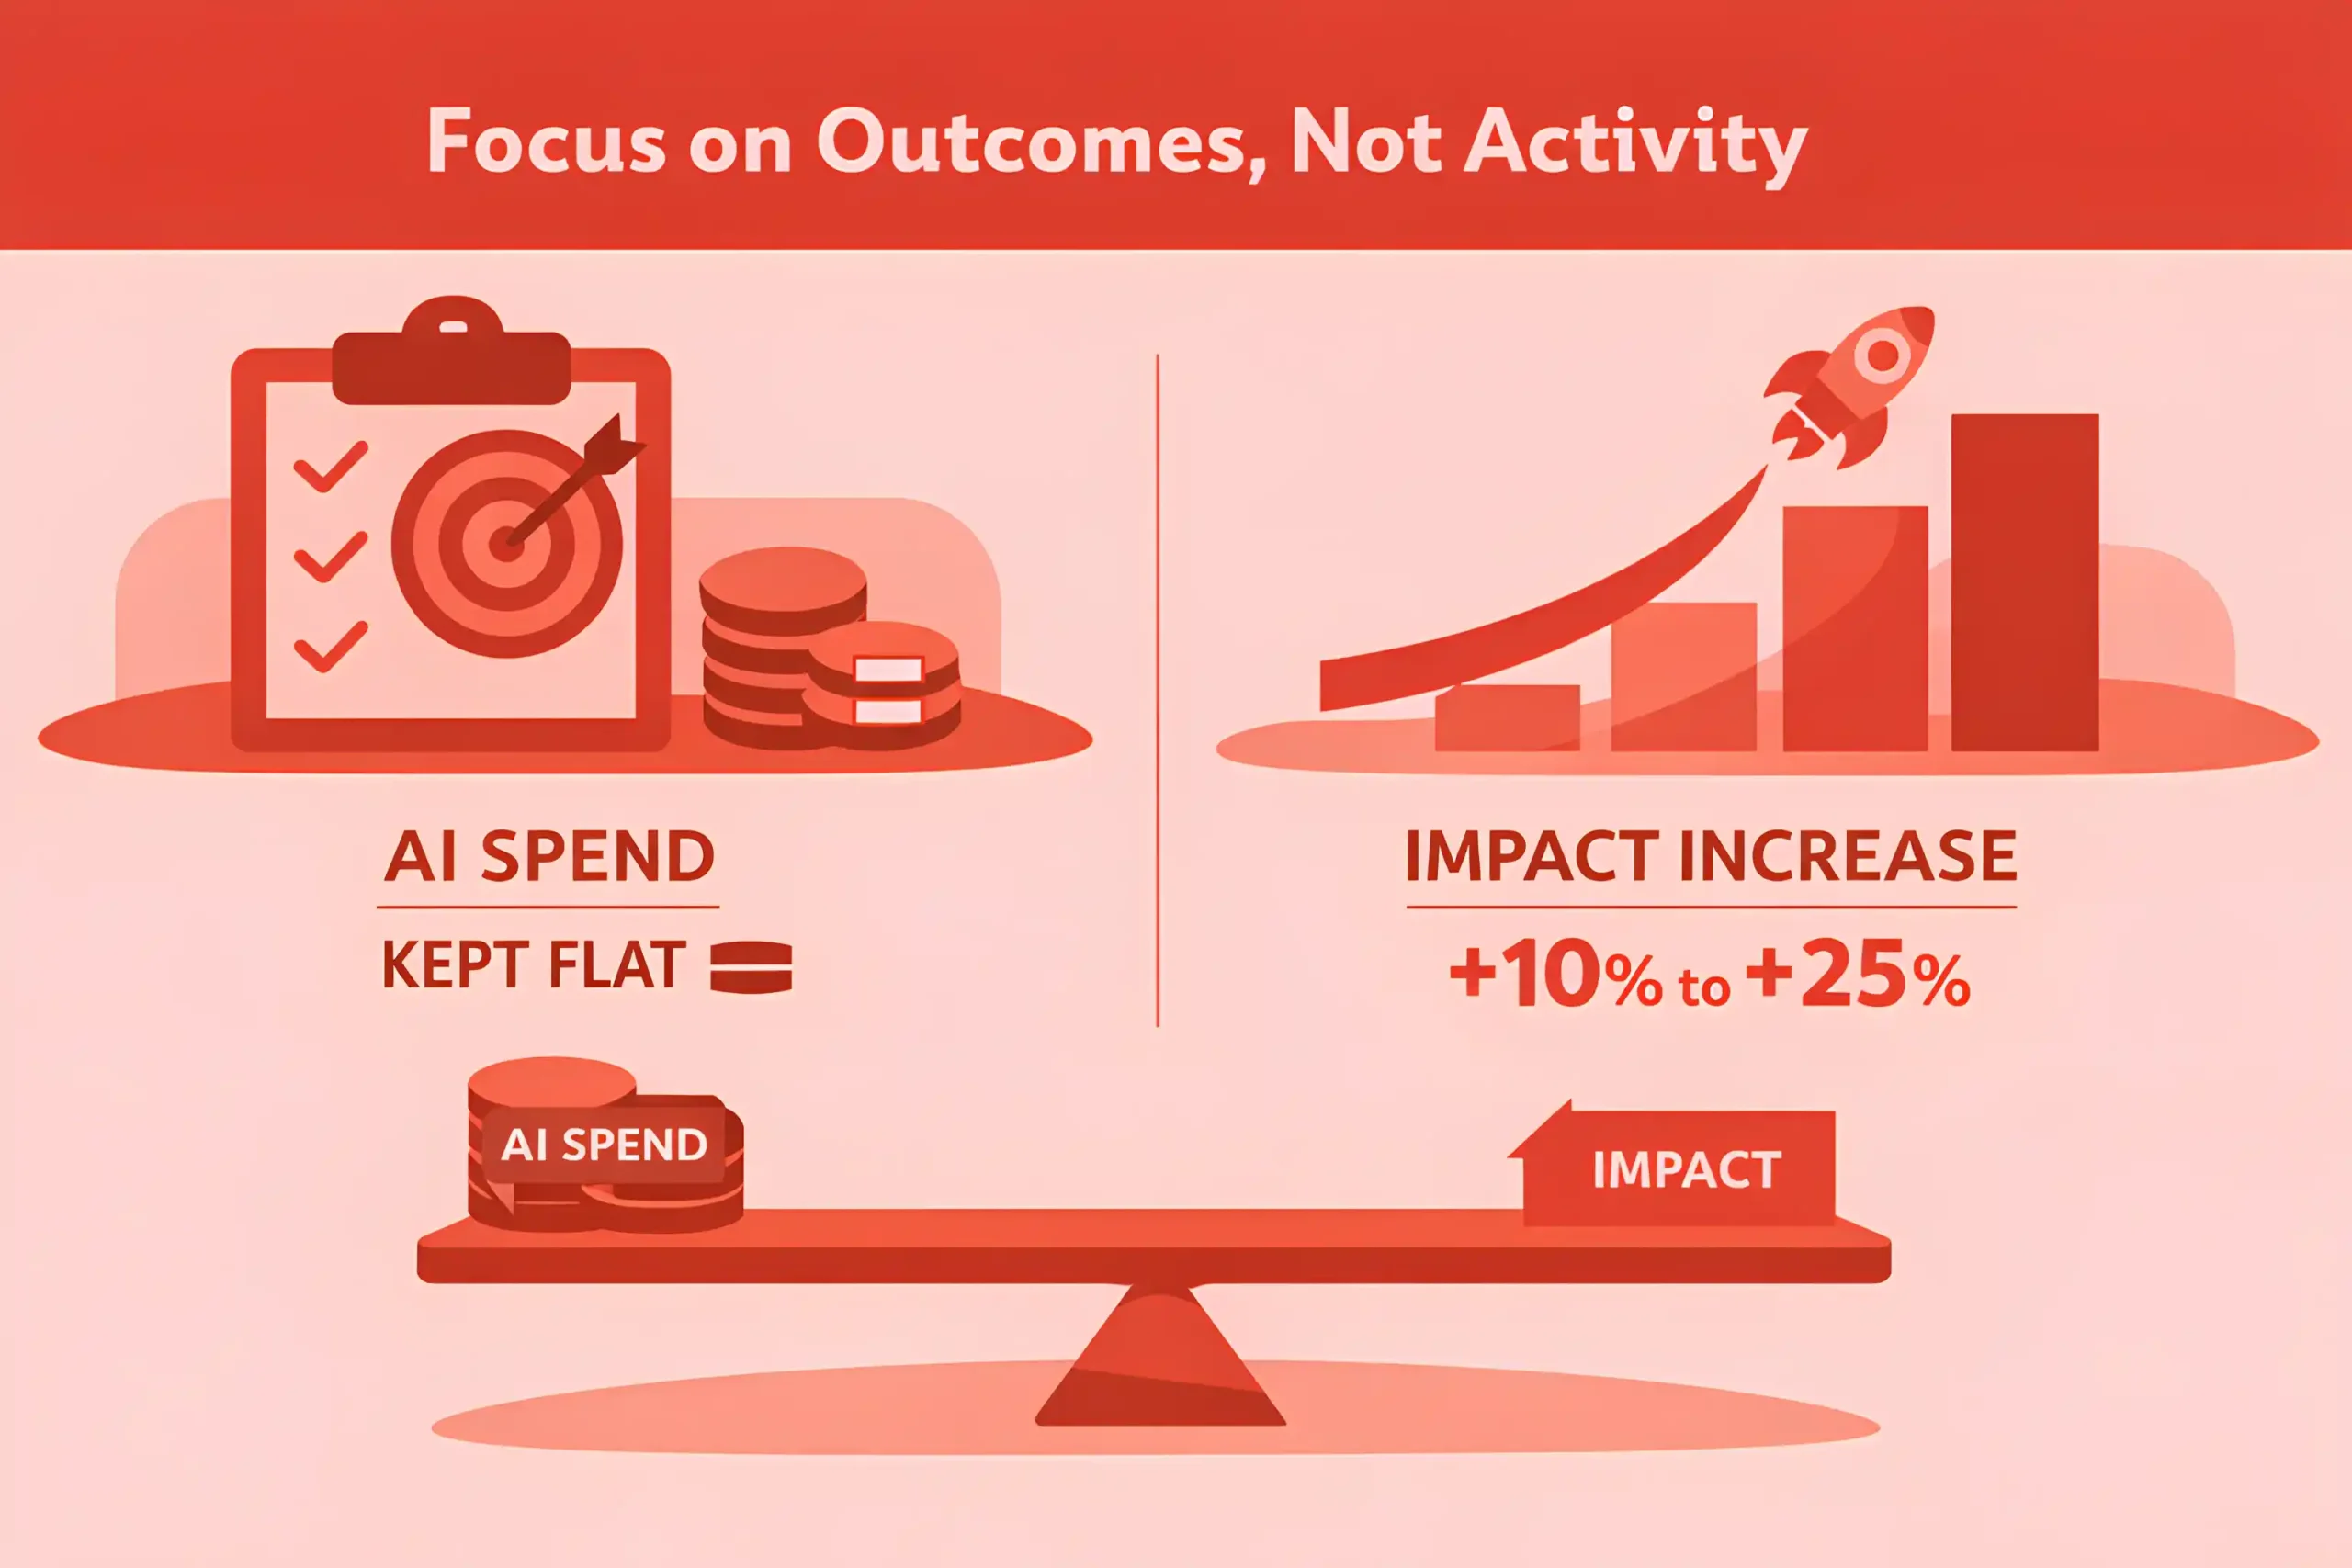
Teams that measure outcomes, not activity, often keep AI spend flat while increasing impact by 10% to 25% through tighter use cases.
Related article: 100+ Reputation Management Statistics
AI Content Production, Speed, and Cost Efficiency
AI-assisted drafting commonly reduces time to first draft by 30% to 60% for blog, landing page, and email copy, which is increasingly into content writing.
Teams that use structured briefs and templates often cut total production time per asset by 20% to 45%, even with human editing.
Pure speed gains are highest on repeatable formats, where output volume can rise 25% to 50% without adding headcount.
Editing and QA often become the bottleneck, and review time can grow to 40% to 60% of the full workflow once AI is used widely.
Short-form assets like ad variants and subject lines often see the biggest acceleration, with turnaround times dropping 50% to 80%.
Repurposing one long-form asset into multiple cuts often improves efficiency by 2x to 5x versus creating each piece from scratch.
Teams using AI for outlines, examples, and restructuring often reduce revision rounds by 10% to 25% after the workflow stabilizes.
In early rollout, 20% to 40% of AI-assisted drafts still require heavy rewriting to match brand voice and accuracy standards.
With guardrails, heavy rewrite rates often drop to 10% to 25% over 6 to 12 weeks.
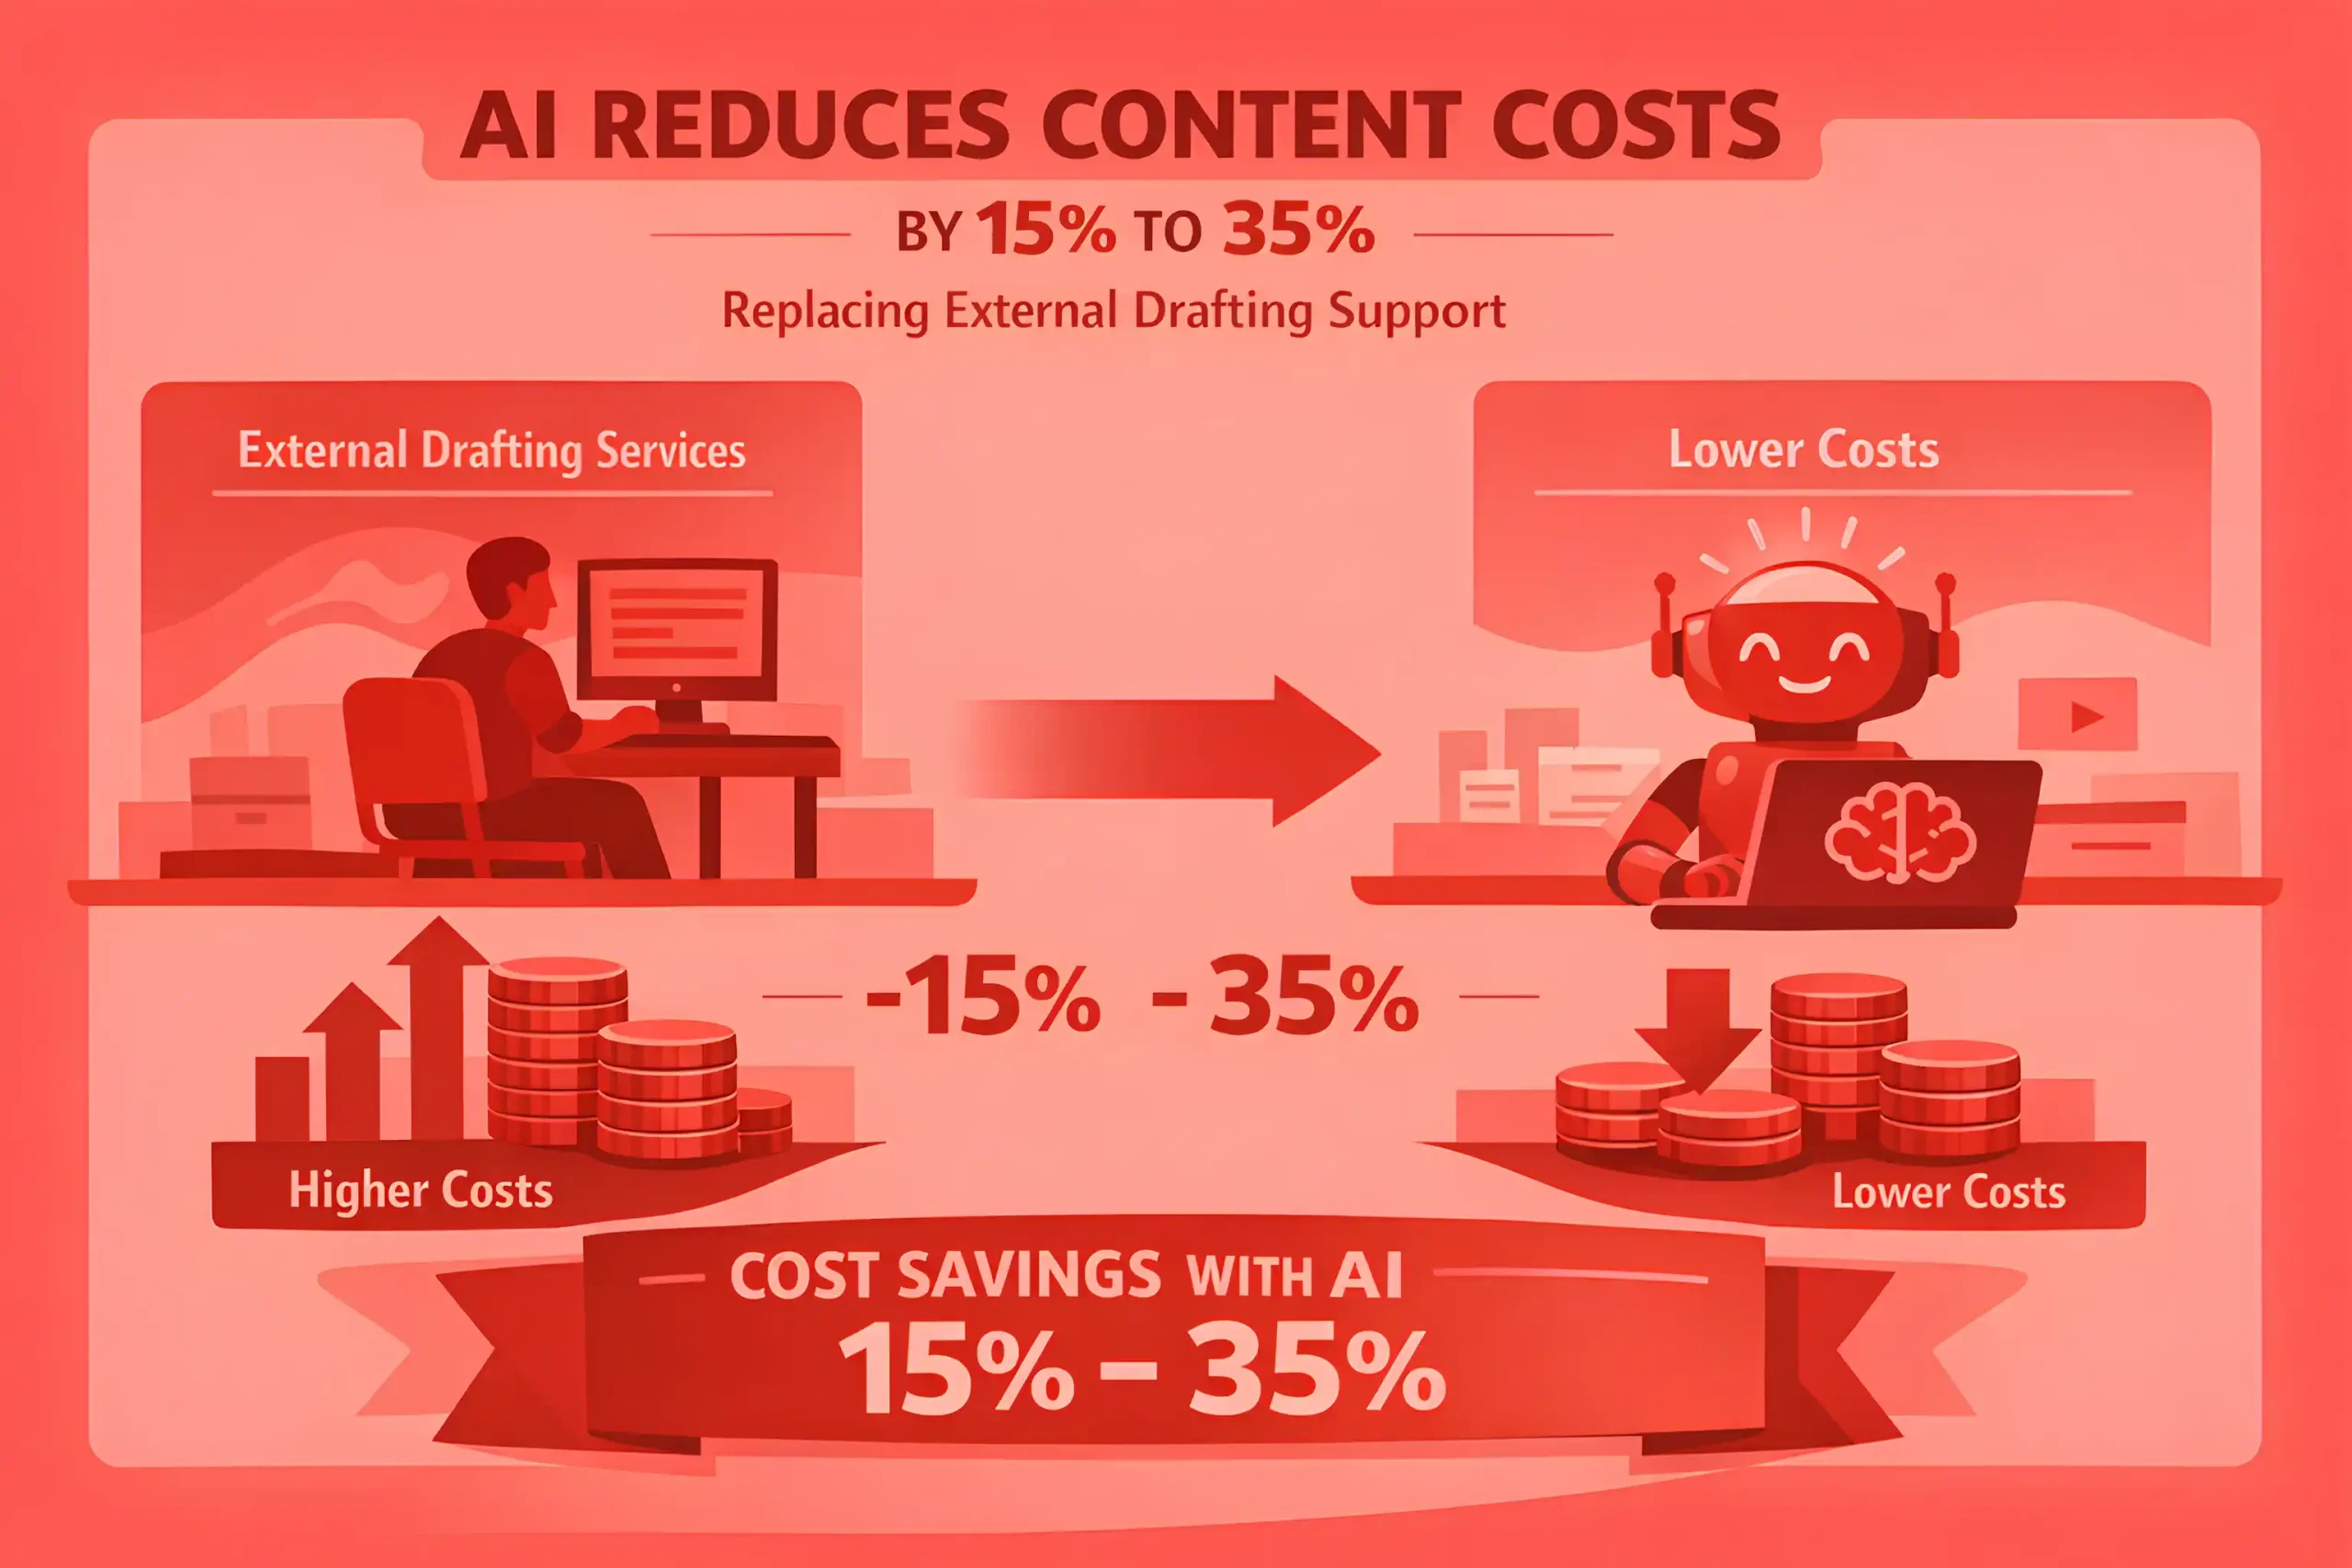
AI use often lowers variable content costs by 15% to 35% when it replaces external drafting support.
Cost per produced asset can fall 10% to 30% in mixed teams where editors stay constant, and drafts accelerate.
When teams skip research discipline, error rates rise, and rework can erase 30% to 70% of the time saved.
Standardized prompt libraries and examples often improve consistency by 10% to 20% and reduce back-and-forth edits.
On SEO led content, AI can speed up topic clustering and brief creation by 20% to 40%.
First-pass metadata creation often becomes 3x to 6x faster, but still needs review for intent and uniqueness, which is where experienced SEO services stay critical.
Email production cycles can shrink by 15% to 35% when AI supports variations, personalization blocks, and testing plans.
Localization and variant creation often become 2x to 4x faster, especially for short pages and ad copy.
Workflow maturity matters, and measurable efficiency gains usually appear after 4 to 8 weeks of consistent use, especially when teams follow a clear digital marketing strategy.
Teams that treat AI output as a starting point, not finished work, tend to keep quality stable while improving speed 20% to 40%.
High-performing teams often cap AI use on high-risk pages, keeping authored sections at 50% to 80% of the final copy.
Read also: 200+ Social Media Marketing Statistics
Personalization, Segmentation, and Customer Experience with AI
AI-driven personalization most often starts with product or content recommendations, and adoption commonly lands around 25% to 55% in teams already running lifecycle marketing.
When AI is added to segmentation, many teams report faster audience building, with segment creation time dropping 30% to 60%.
Predictive segments often improve targeting efficiency, with click or conversion lift commonly in the 5% to 20% range when data quality is solid.
Personalized blocks in email or onsite experiences often increase click rates by 5% to 20%, and sometimes 20% to 40% in large catalogs.
AI-generated subject line variants usually deliver small lifts, often 0% to 10%, unless combined with stronger segmentation.
Send time optimization often improves engagement by 5% to 15% when audience behavior is stable.
Next best action messaging can reduce churn risk, with retention lift commonly 2% to 8% over a quarter in subscription models.
Customer journey orchestration often reduces wasted touches, cutting total sends by 10% to 25% while keeping conversions steady.
Better targeting typically lowers opt-outs, with unsubscribe rates dropping 5% to 20% when irrelevant sends are suppressed.
Complaint rates often fall as relevance improves, commonly by 10% to 30% in high-frequency programs.
AI-assisted customer support and chat deflection can reduce ticket volume by 10% to 35% when knowledge bases are clean.
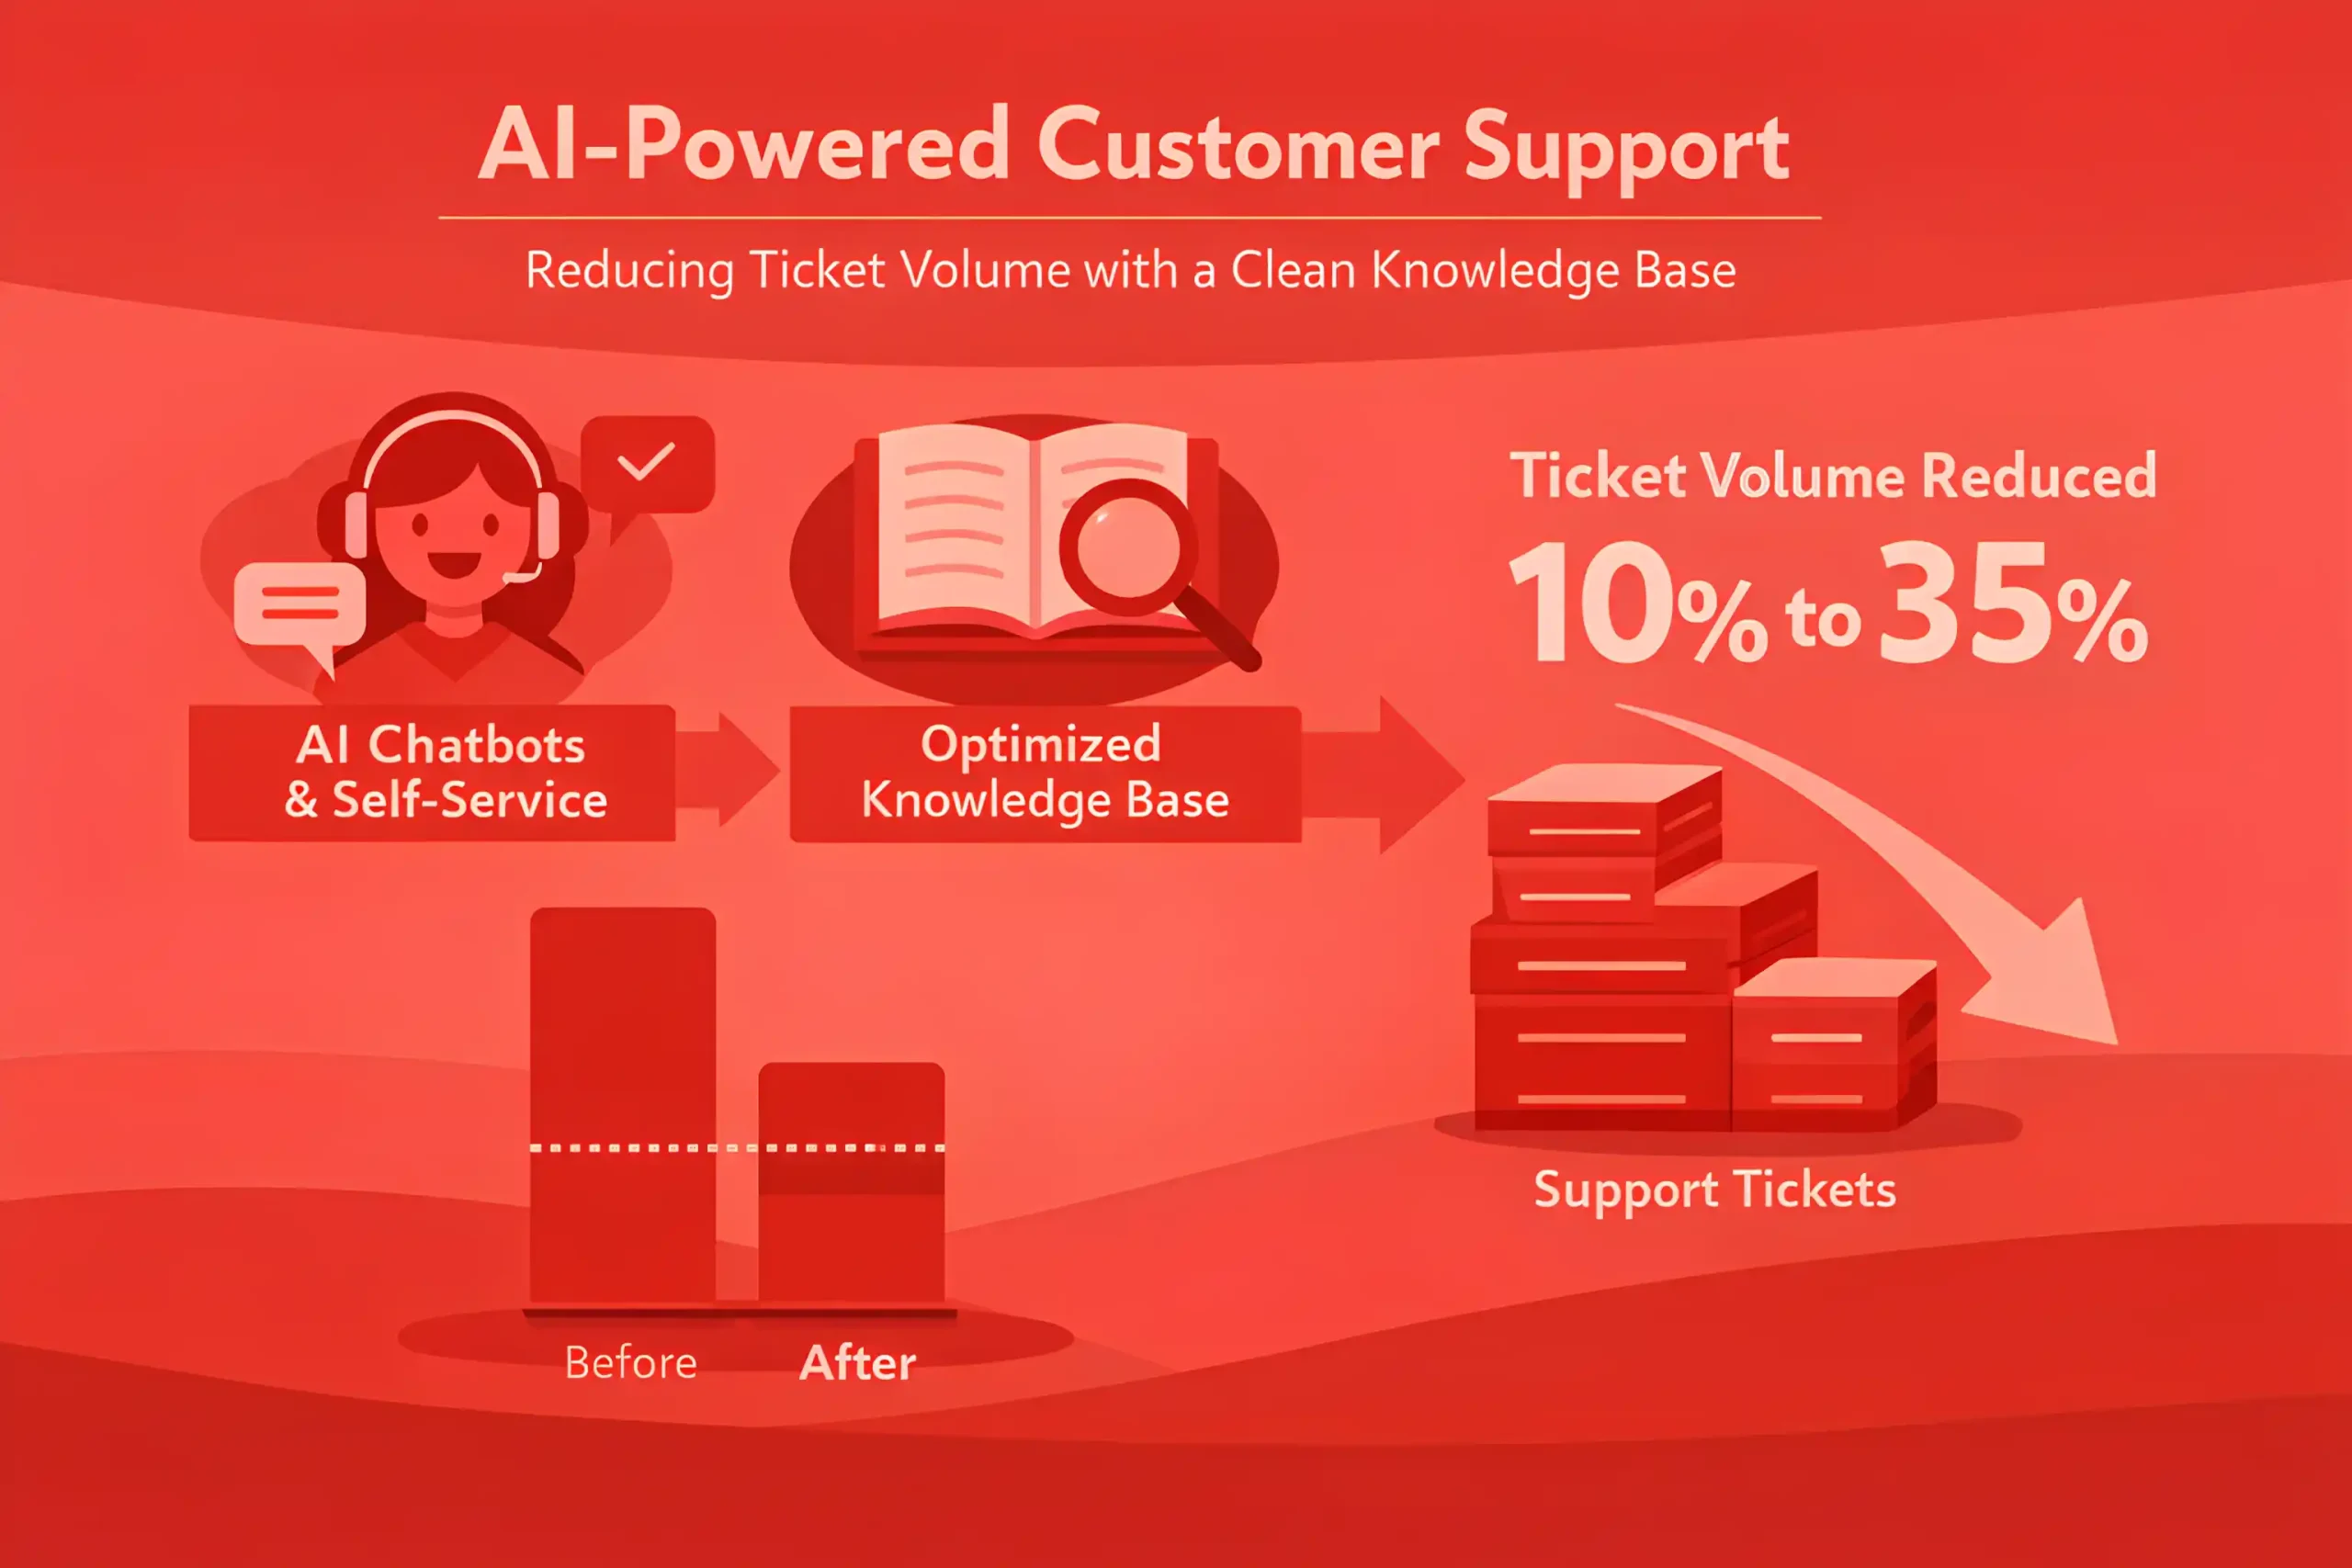
Resolution time often improves 15% to 40% when AI drafts responses and surfaces relevant articles.
Personalized onsite experiences often lift conversion rate by 3% to 15% on high-intent pages, depending on traffic source.
Recommendation engines often increase average order value by 2% to 10% when cross-sell is aligned to purchase intent.
Dynamic creative optimization in ads often lifts CTR by 5% to 20% when enough volume exists for learning, which fits naturally inside PPC management.
Over-personalization can backfire, and many teams see performance flatten when segments drop below 500 to 2,000 users per message.
Model-driven targeting can amplify bias, so teams often add human rules, with 20% to 40% of segments still manually defined.
First-party data quality is the limiting factor, and many teams report that 30% to 50% of customer records lack usable behavioral signals.
Teams that add preference controls often see better outcomes, with engagement up 5% to 15% because subscribers self-select topics, and that kind of UX improvement usually sits under broader web design services.
Customer experience improvements usually show up after workflow tuning, with meaningful lift often taking 6 to 12 weeks.
AI in Paid Ads, Targeting, and Creative Performance
AI-assisted creative generation is now common in paid teams, with adoption often landing around 35% to 65%, especially in accounts supported by SaaS PPC.
Teams using AI for rapid variations often increase creative output by 2x to 5x without adding designers.
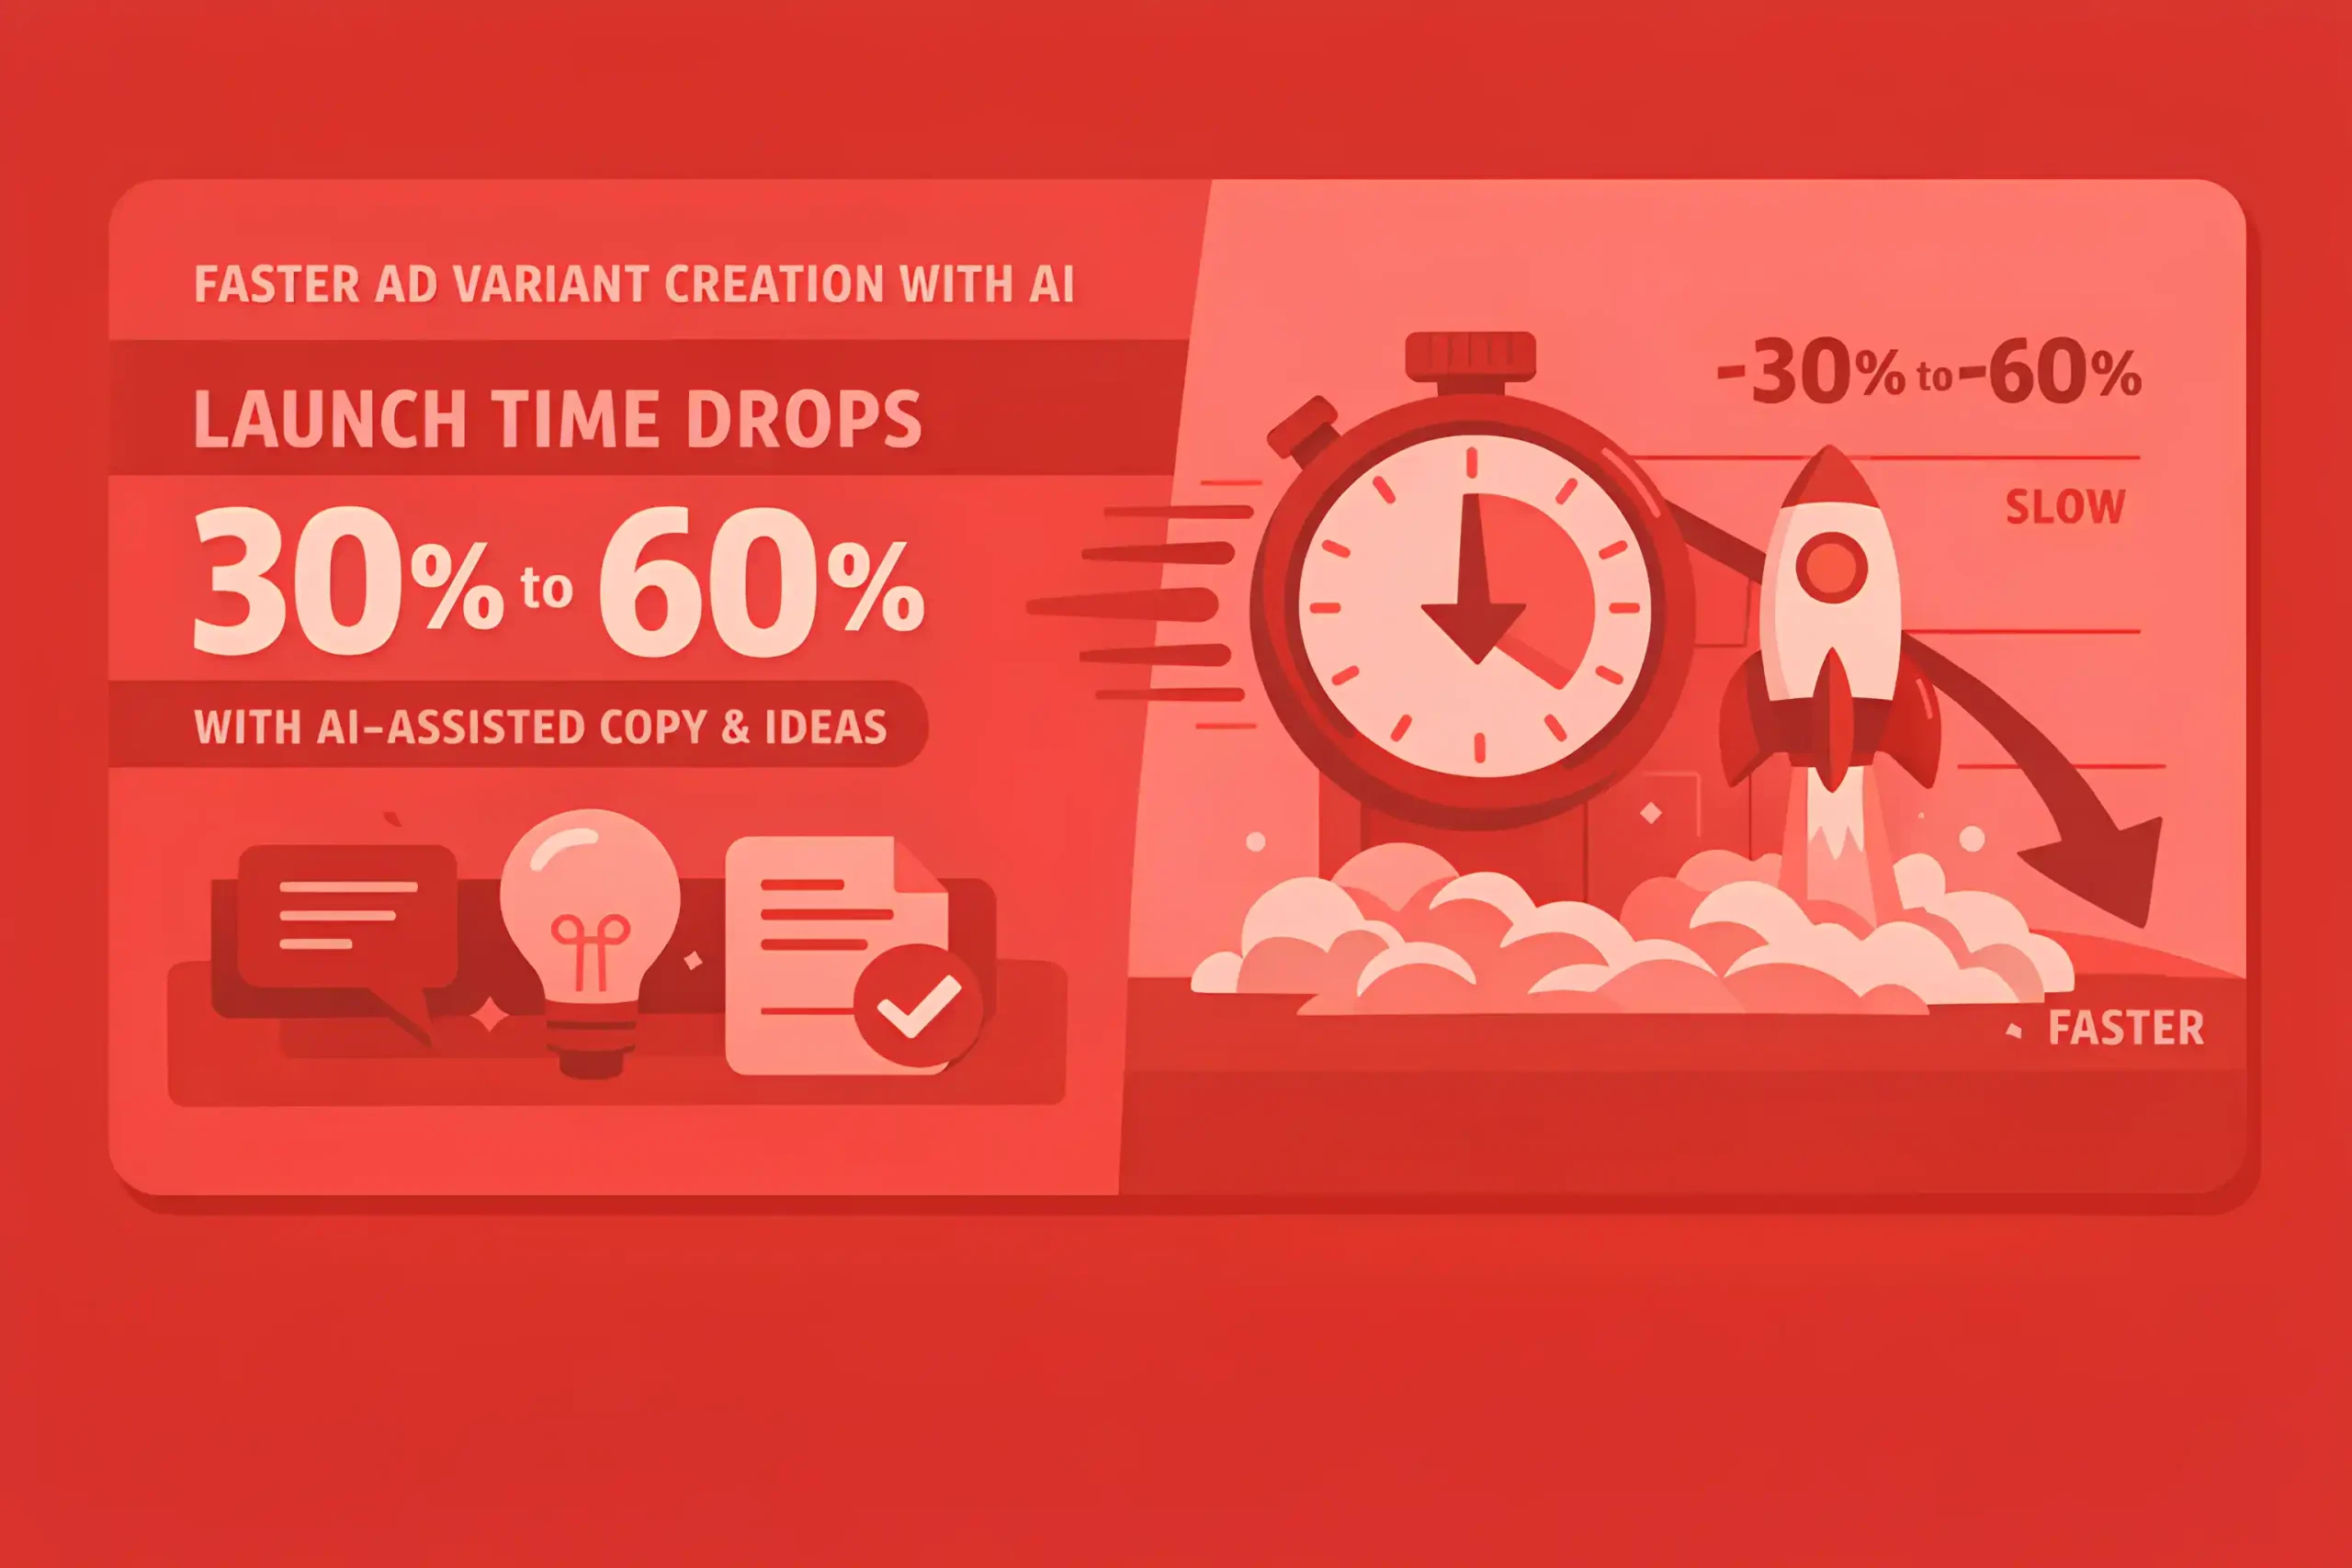
Time to launch new ad variants often drops 30% to 60% when AI supports copy, hooks, and concept iterations.
Performance gains from AI-generated variants are mixed, but many teams report CTR lift in the 5% to 20% range after testing enough volume.
Conversion rate lift is usually smaller than CTR lift, often 2% to 10%, unless landing pages and offers improve too.
Dynamic creative optimization often improves efficiency, with CPA reductions commonly 5% to 15% when campaigns have stable data.
ROAS improvements from better targeting and creative fit often land around 3% to 12% over a quarter in mature accounts.
Send the wrong variations to broad audiences, and results can swing, with CPA volatility rising 10% to 30% during heavy experimentation.
AI-assisted audience building often reduces the time to create segments by 25% to 50%.
Lookalike style modeling often lifts conversion rates 3% to 10% when seed lists are high quality.
Predictive bidding strategies tend to perform best after a learning period of 7 to 21 days, depending on volume.
The fastest wins usually come from better testing velocity, where teams run 20% to 50% more experiments per month.
Over time, fatigue becomes the limiting factor, and creative performance commonly drops after 7 to 14 days in high-spend campaigns.
Refreshing creatives on a two-week cycle often improves CTR 5% to 15% versus letting ads run unchanged.
AI-assisted copy testing often improves hook relevance, reducing bounce rate 3% to 10% on aligned landing pages, especially when the page experience is refined through conversion rate optimization.
Video cut-downs and caption variations created with AI often reduce production cost 15% to 35%.
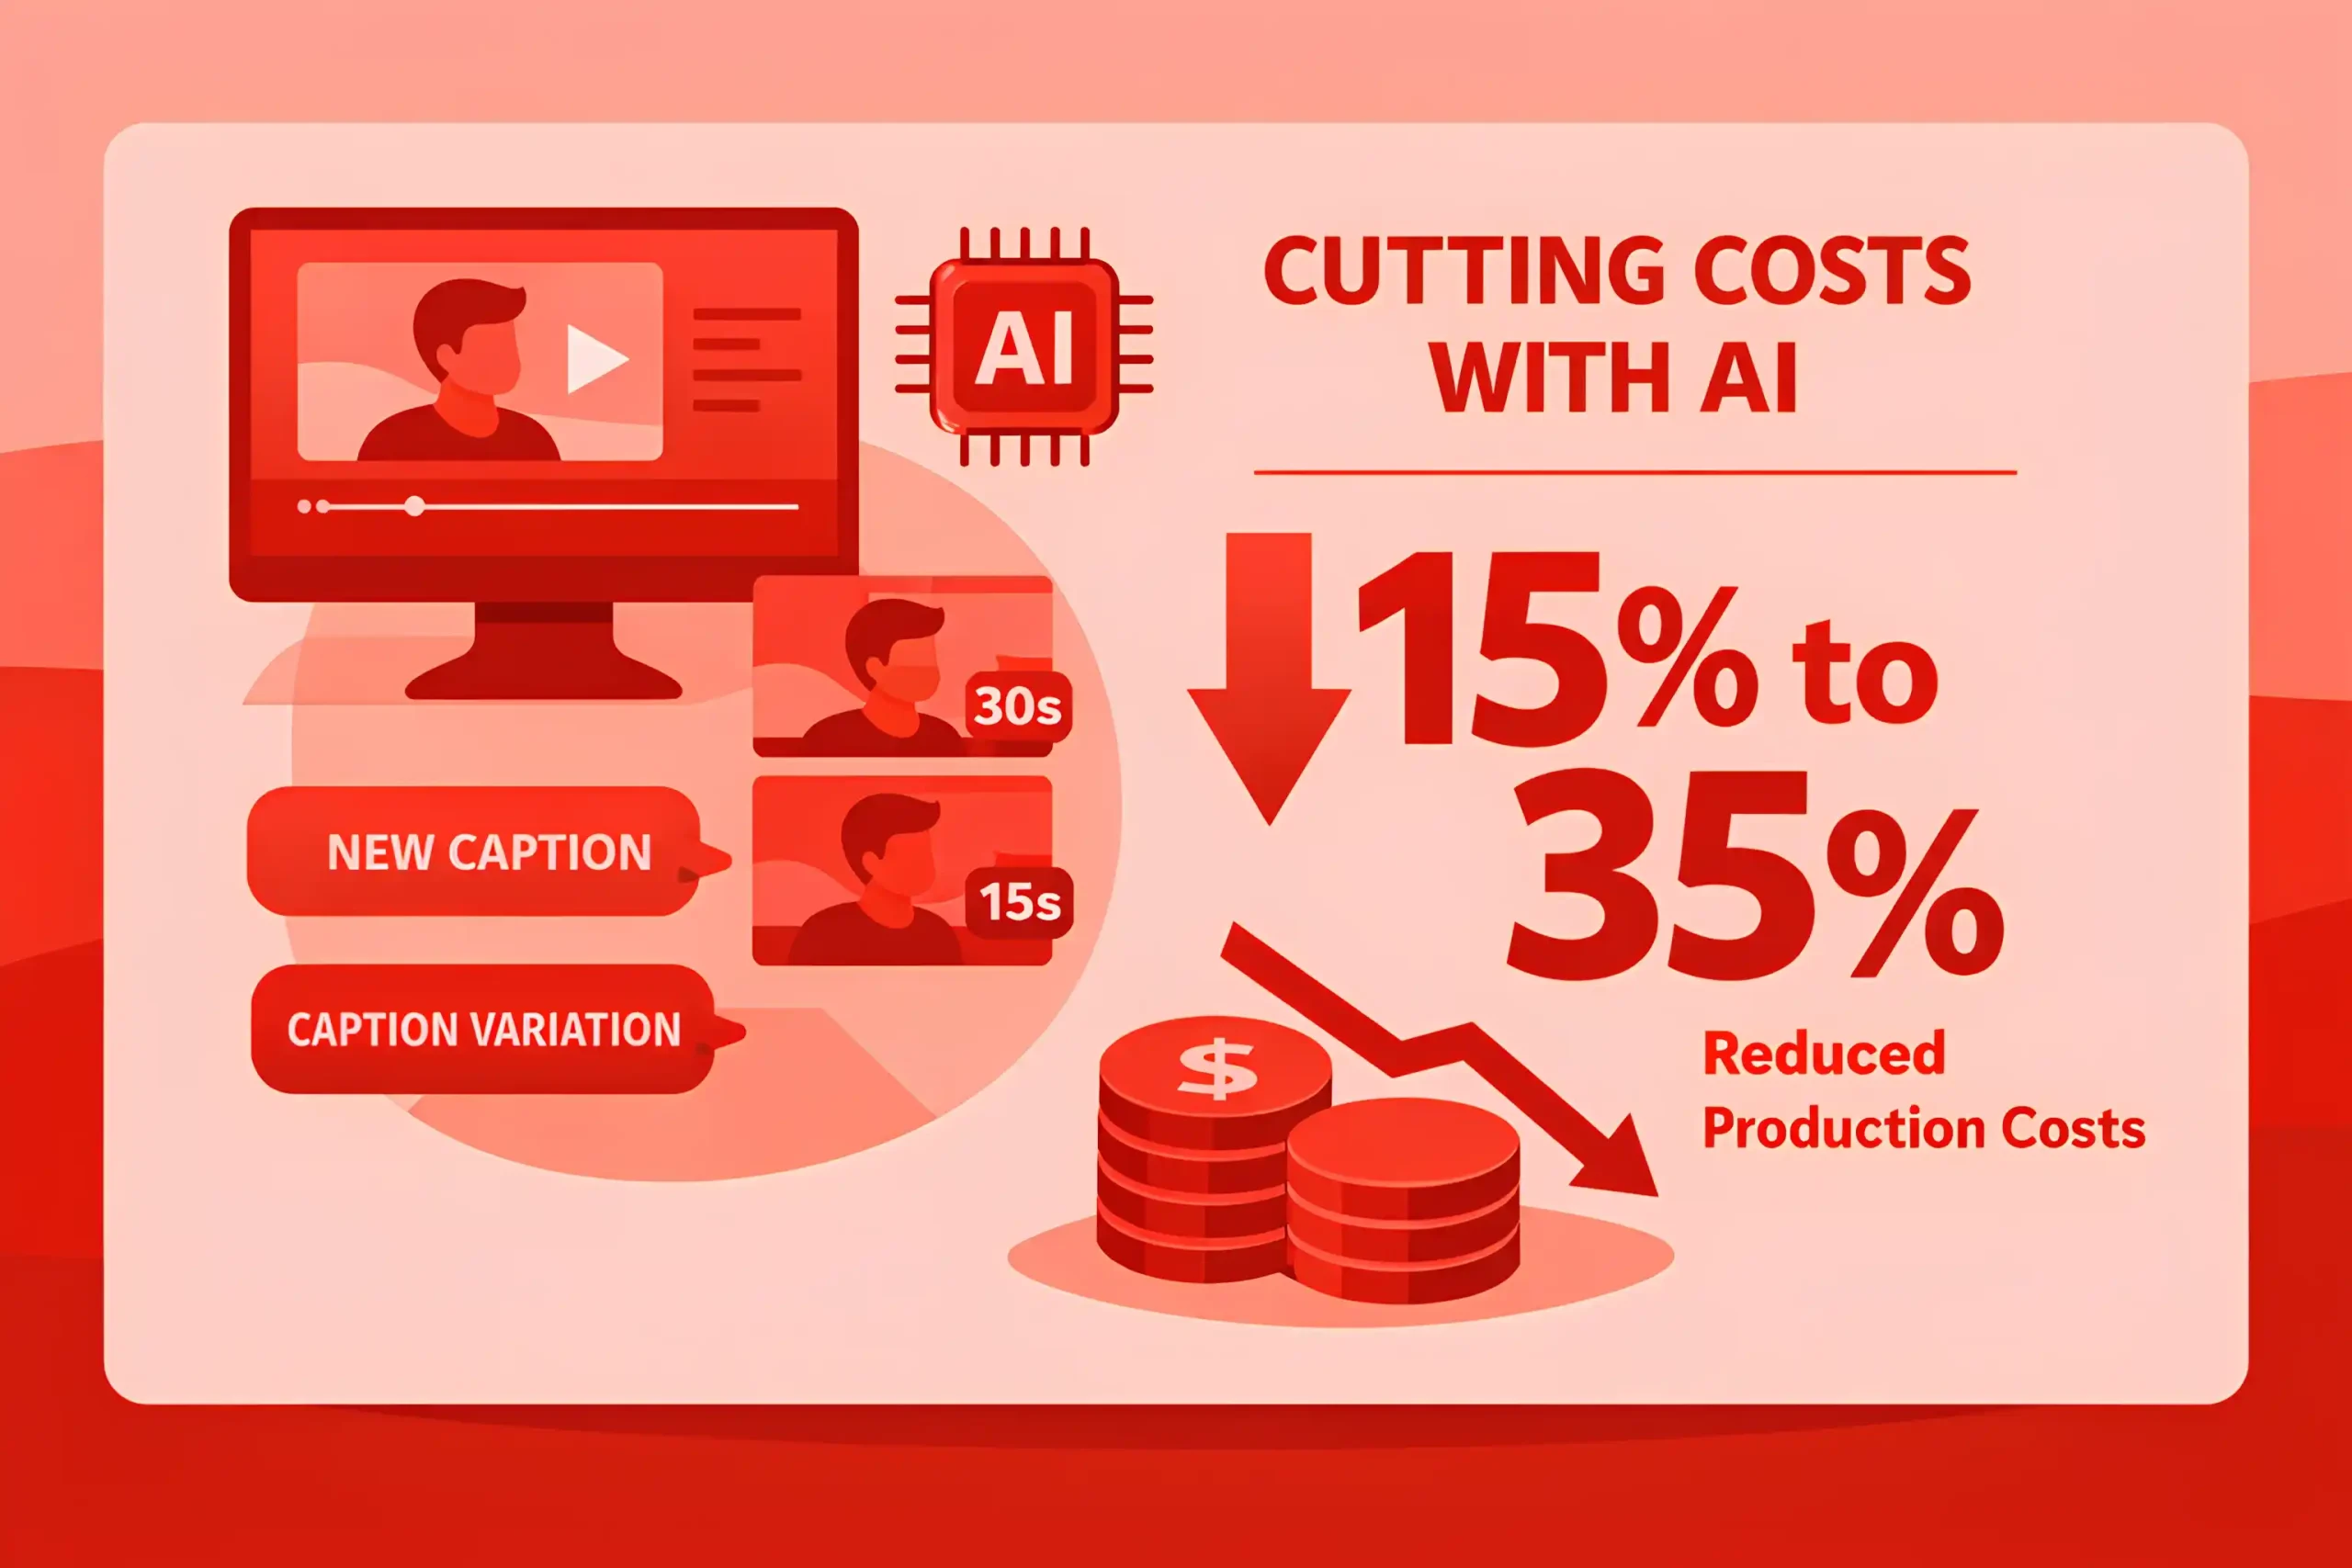
Localized variants for regions or personas often become 2x to 4x faster to produce with AI support.
Brand safety review still matters, and many teams keep 80% to 95% of ads under human approval before launch.
The most consistent improvements come when AI output is paired with a clear creative testing system, often reducing wasted spend by 5% to 15%.
Accounts that track creative learnings rigorously often see quarterly efficiency gains of 5% to 20% as winning patterns compound.
Related article: 200+ Affiliate Marketing Statistics to Help You Scale
Email, SMS, and Lifecycle Marketing Automation with AI
AI use in lifecycle marketing often starts with subject lines, copy variants, and flow optimization, with adoption commonly in the 35% to 65% range.
Teams using AI for lifecycle copy variations often reduce production time by 25% to 50% across email and SMS.
Automated flows typically outperform broadcasts, and AI flows often add incremental lift of 5% to 15% on clicks or conversions.
Send time optimization supported by models often improves engagement by 5% to 15% when behavior patterns are stable.
AI-assisted segmentation can reduce time to build audiences by 30% to 60% and increase testing volume.
When relevance improves, unsubscribe rates often drop 5% to 20%, especially in high-frequency programs.
Complaint rates can fall 10% to 30% when irrelevant sends are suppressed, and frequency is controlled.
Welcome sequences often deliver 2x to 4x higher click rates than standard campaigns, and improving the post-click path on key pages often depends on solid B2B website development.
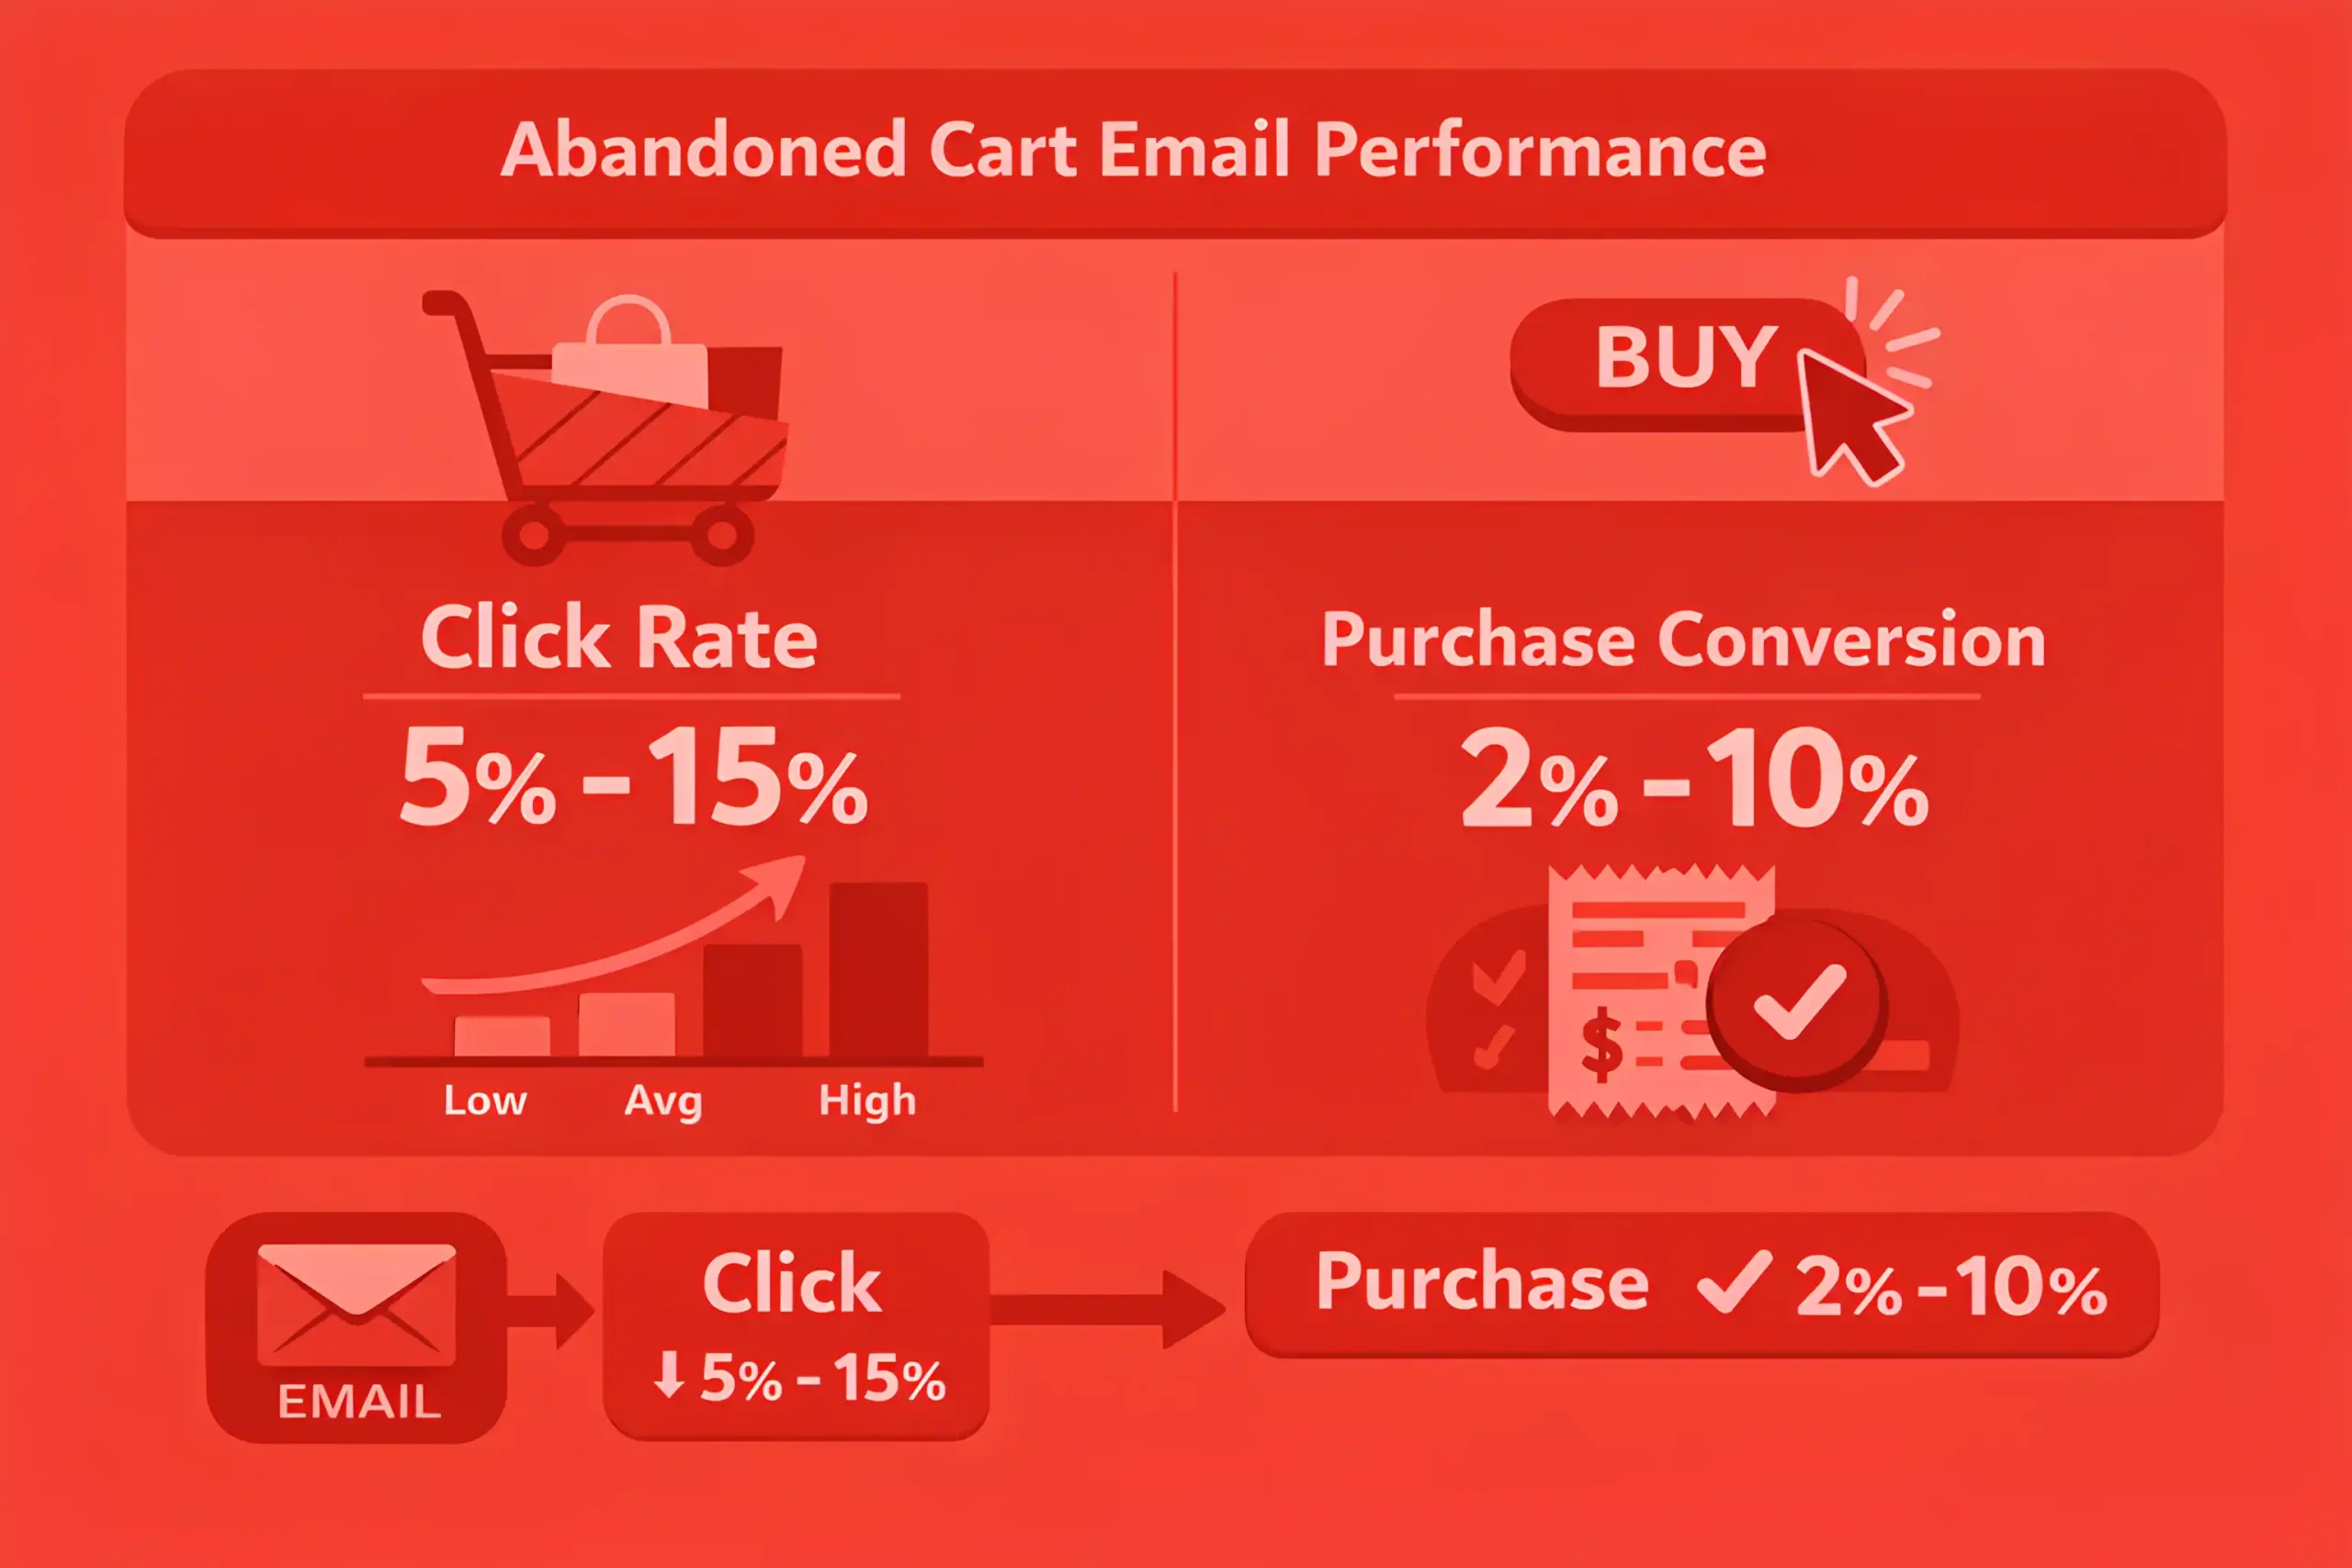
Abandoned cart flows often see click rates around 5% to 15%, with purchase conversion from click commonly 2% to 10%.
Browse abandonment flows usually lift conversions by 5% to 20% when timing is tight, and content matches intent.
Predictive churn or win-back targeting often improves retention 2% to 8% over a quarter in subscription models.
AI-generated personalization blocks often lift click rates by 5% to 20%, with stronger gains in large catalogs.
SMS automation benefits from brevity, and AI-assisted variants often improve click rates 3% to 12% when offers are consistent.
Two-way messaging assisted by AI can reduce support load, cutting inbound tickets 10% to 25% when routing is correct, and this is easier to scale when experiences are built for mobile through mobile app development.
Journey orchestration that reduces redundant touches often cuts total sends by 10% to 25% while keeping revenue stable.
Teams that add preference controls often see engagement improve 5% to 15% because subscribers select topics and cadence.
AI can reduce manual reporting effort 20% to 40% by summarizing performance and flagging anomalies.
Workflow maturity matters, and meaningful gains often appear after 4 to 8 weeks of tuning prompts, rules, and exclusions.
Human review remains standard for high-risk sends, with 80% to 95% of teams keeping final approval with a marketer.
You might find this useful: 100+ Web Design Statistics
AI Search, AI Overviews, and How Discovery Is Changing
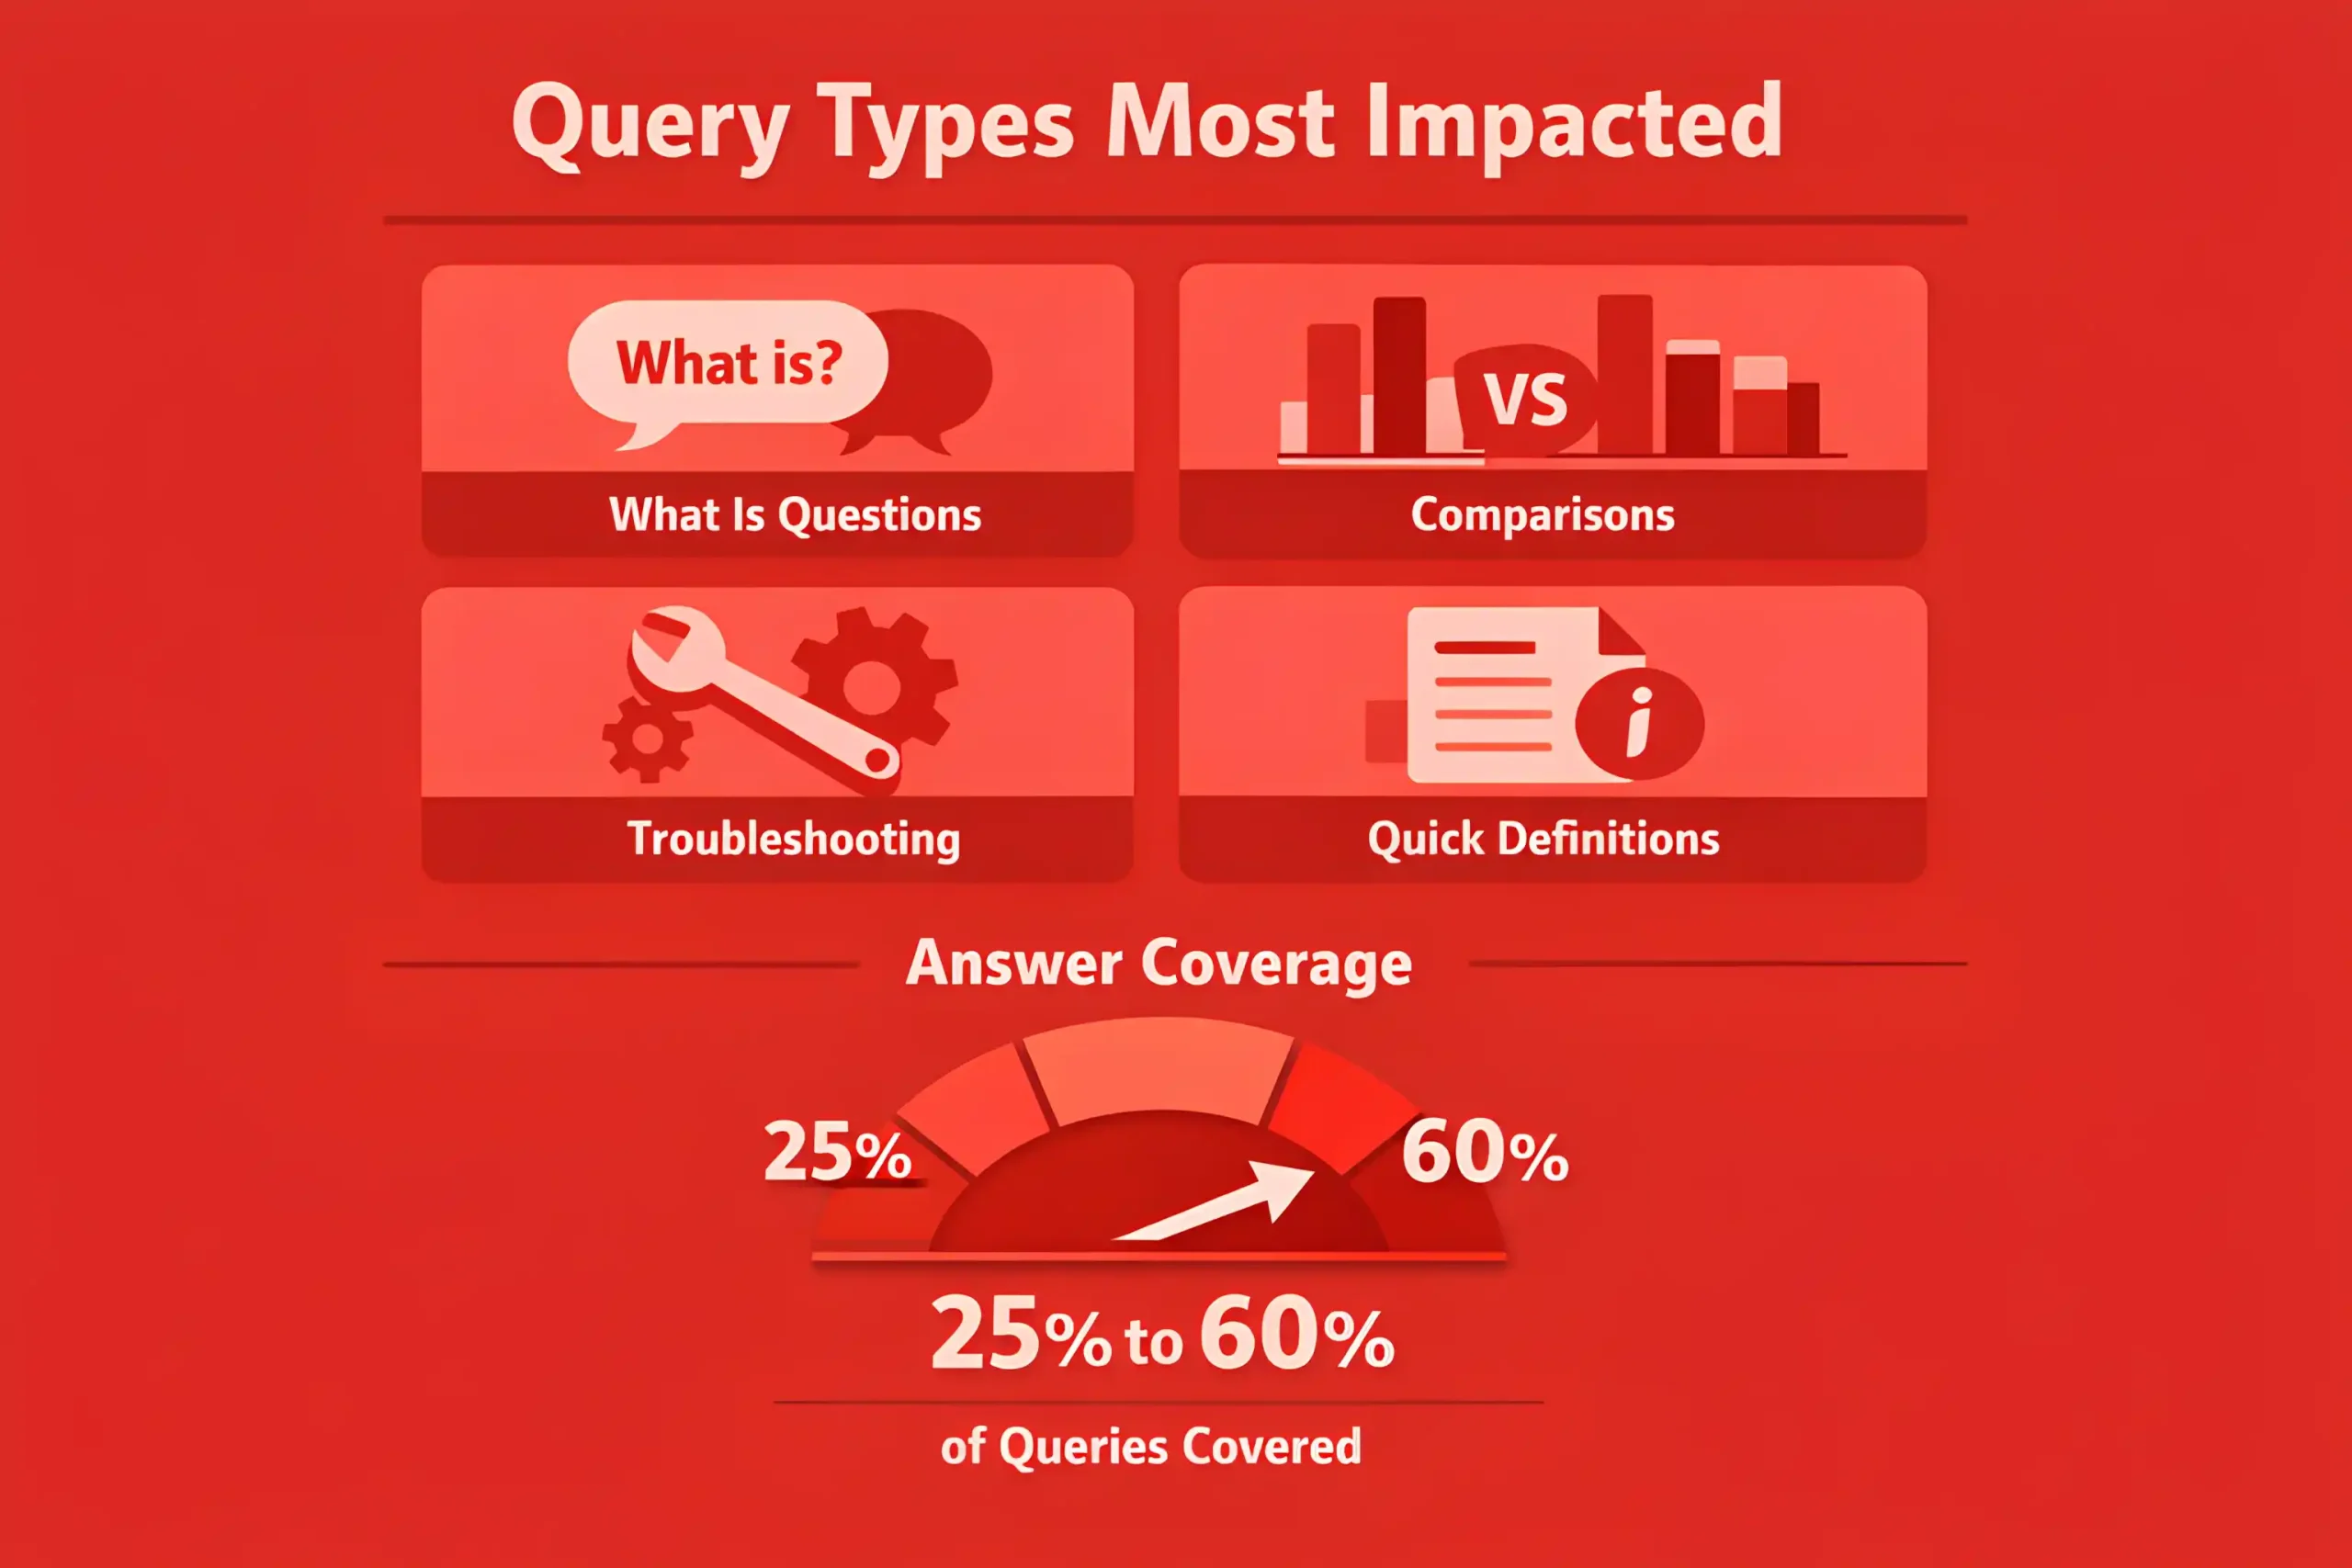
Query types most affected are “what is,” comparisons, troubleshooting, and quick definitions, where answer coverage can reach 25% to 60%.
When an AI answer appears, organic click-through rates for many non-brand results often drop by 10% to 35%.
Top of page visibility still matters, but the value concentrates, and positions outside the top set often lose 15% to 50% of clicks.
Brand familiarity becomes a bigger filter, with branded queries growing 5% to 20% faster than non-branded in many categories.
Citations and source links inside AI answers tend to send fewer clicks than classic blue links, often 30% to 70% lower per impression.
Pages that get cited can still win because the traffic skews higher intent, with conversion rates often 10% to 30% stronger than average organic.
Content that answers a narrow question cleanly is more likely to be surfaced, especially when the answer fits within 2 to 6 short paragraphs.
Original research, first-party data, and unique frameworks are more likely to be referenced, often driving 2x to 5x more visibility in AI summaries.
List pages and generic rewrites tend to underperform, with visibility declines of 10% to 40% once AI answers cover the basics.
Technical hygiene affects inclusion, and crawl and index issues can suppress eligibility by 5% to 20% across a content library.
Clear entity signals and consistent author and organization markup can improve selection odds by 10% to 25% over time.
Freshness matters more on fast-changing topics, and updating key pages every 30 to 90 days often stabilizes visibility.
Internal linking that reinforces topic clusters can lift discovery and citations by 10% to 30% across related pages.
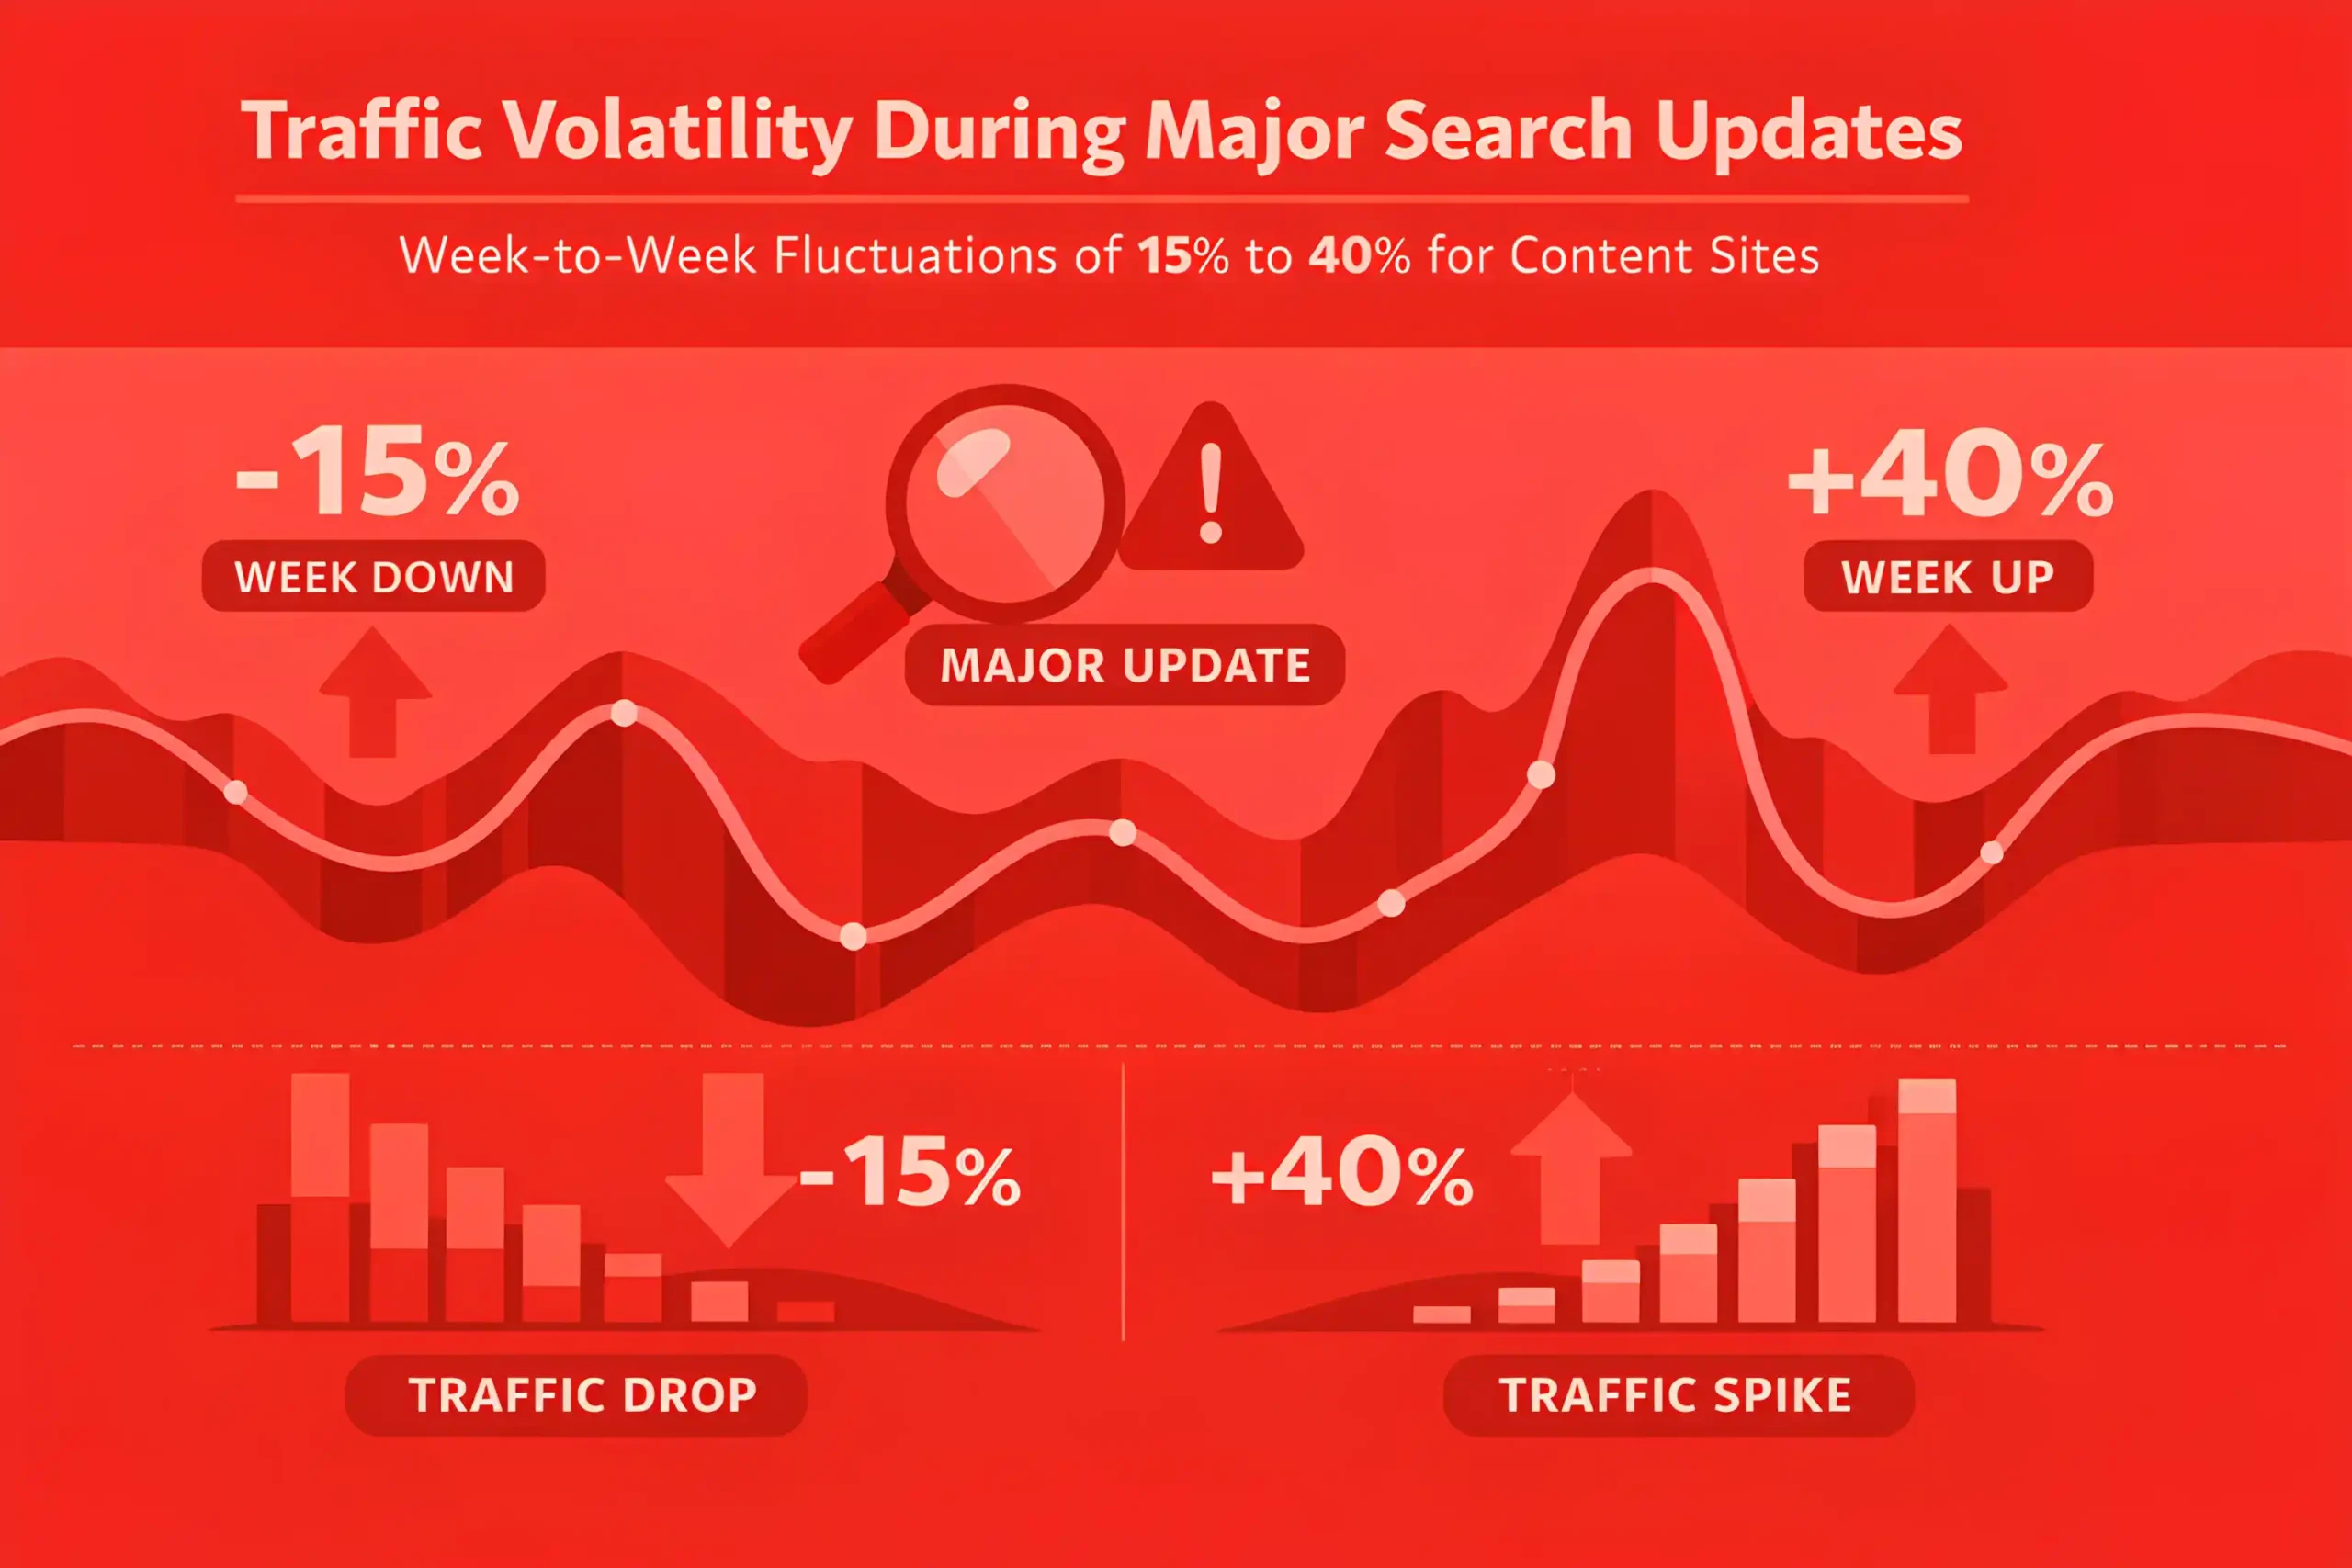
Traffic becomes more volatile around major search updates, with week-to-week swings of 15% to 40% for content sites.
Measurement shifts away from pure sessions, and teams often track “citation share” or “answer presence” alongside clicks to explain performance changes.
Winning pages often combine short, direct answers with depth below, keeping engagement strong even as clicks shrink by 10% to 25% on informational terms.
The strongest hedge is topic authority plus brand demand, since those programs often see smaller declines, commonly 5% to 15% versus category averages.
The Key Takeaways
Some teams stayed stuck in one-off prompting and kept fixing the same problems in circles. Others built a simple operating rhythm: clear briefs, defined owners, real review, and AI used in the same places every week.
Those teams did not win because they “used AI.” They won because work stopped being improvised. Testing became regular, lifecycle programs got tighter, and content quality stayed consistent because someone owned the final call.
Now discovery is shifting as answer search takes more space. Generic explanations blend. Original proof, sharp positioning, and practical frameworks still stand out. Use the numbers in our guide to decide what to automate, what to measure, and what to keep human!