Web design no longer just defines how a site looks; it determines how it ranks, converts, and keeps users engaged. In 2026, design choices influence everything from Google’s Core Web Vitals to consumer trust, with split-second load times and seamless mobile layouts deciding whether visitors stay or leave.
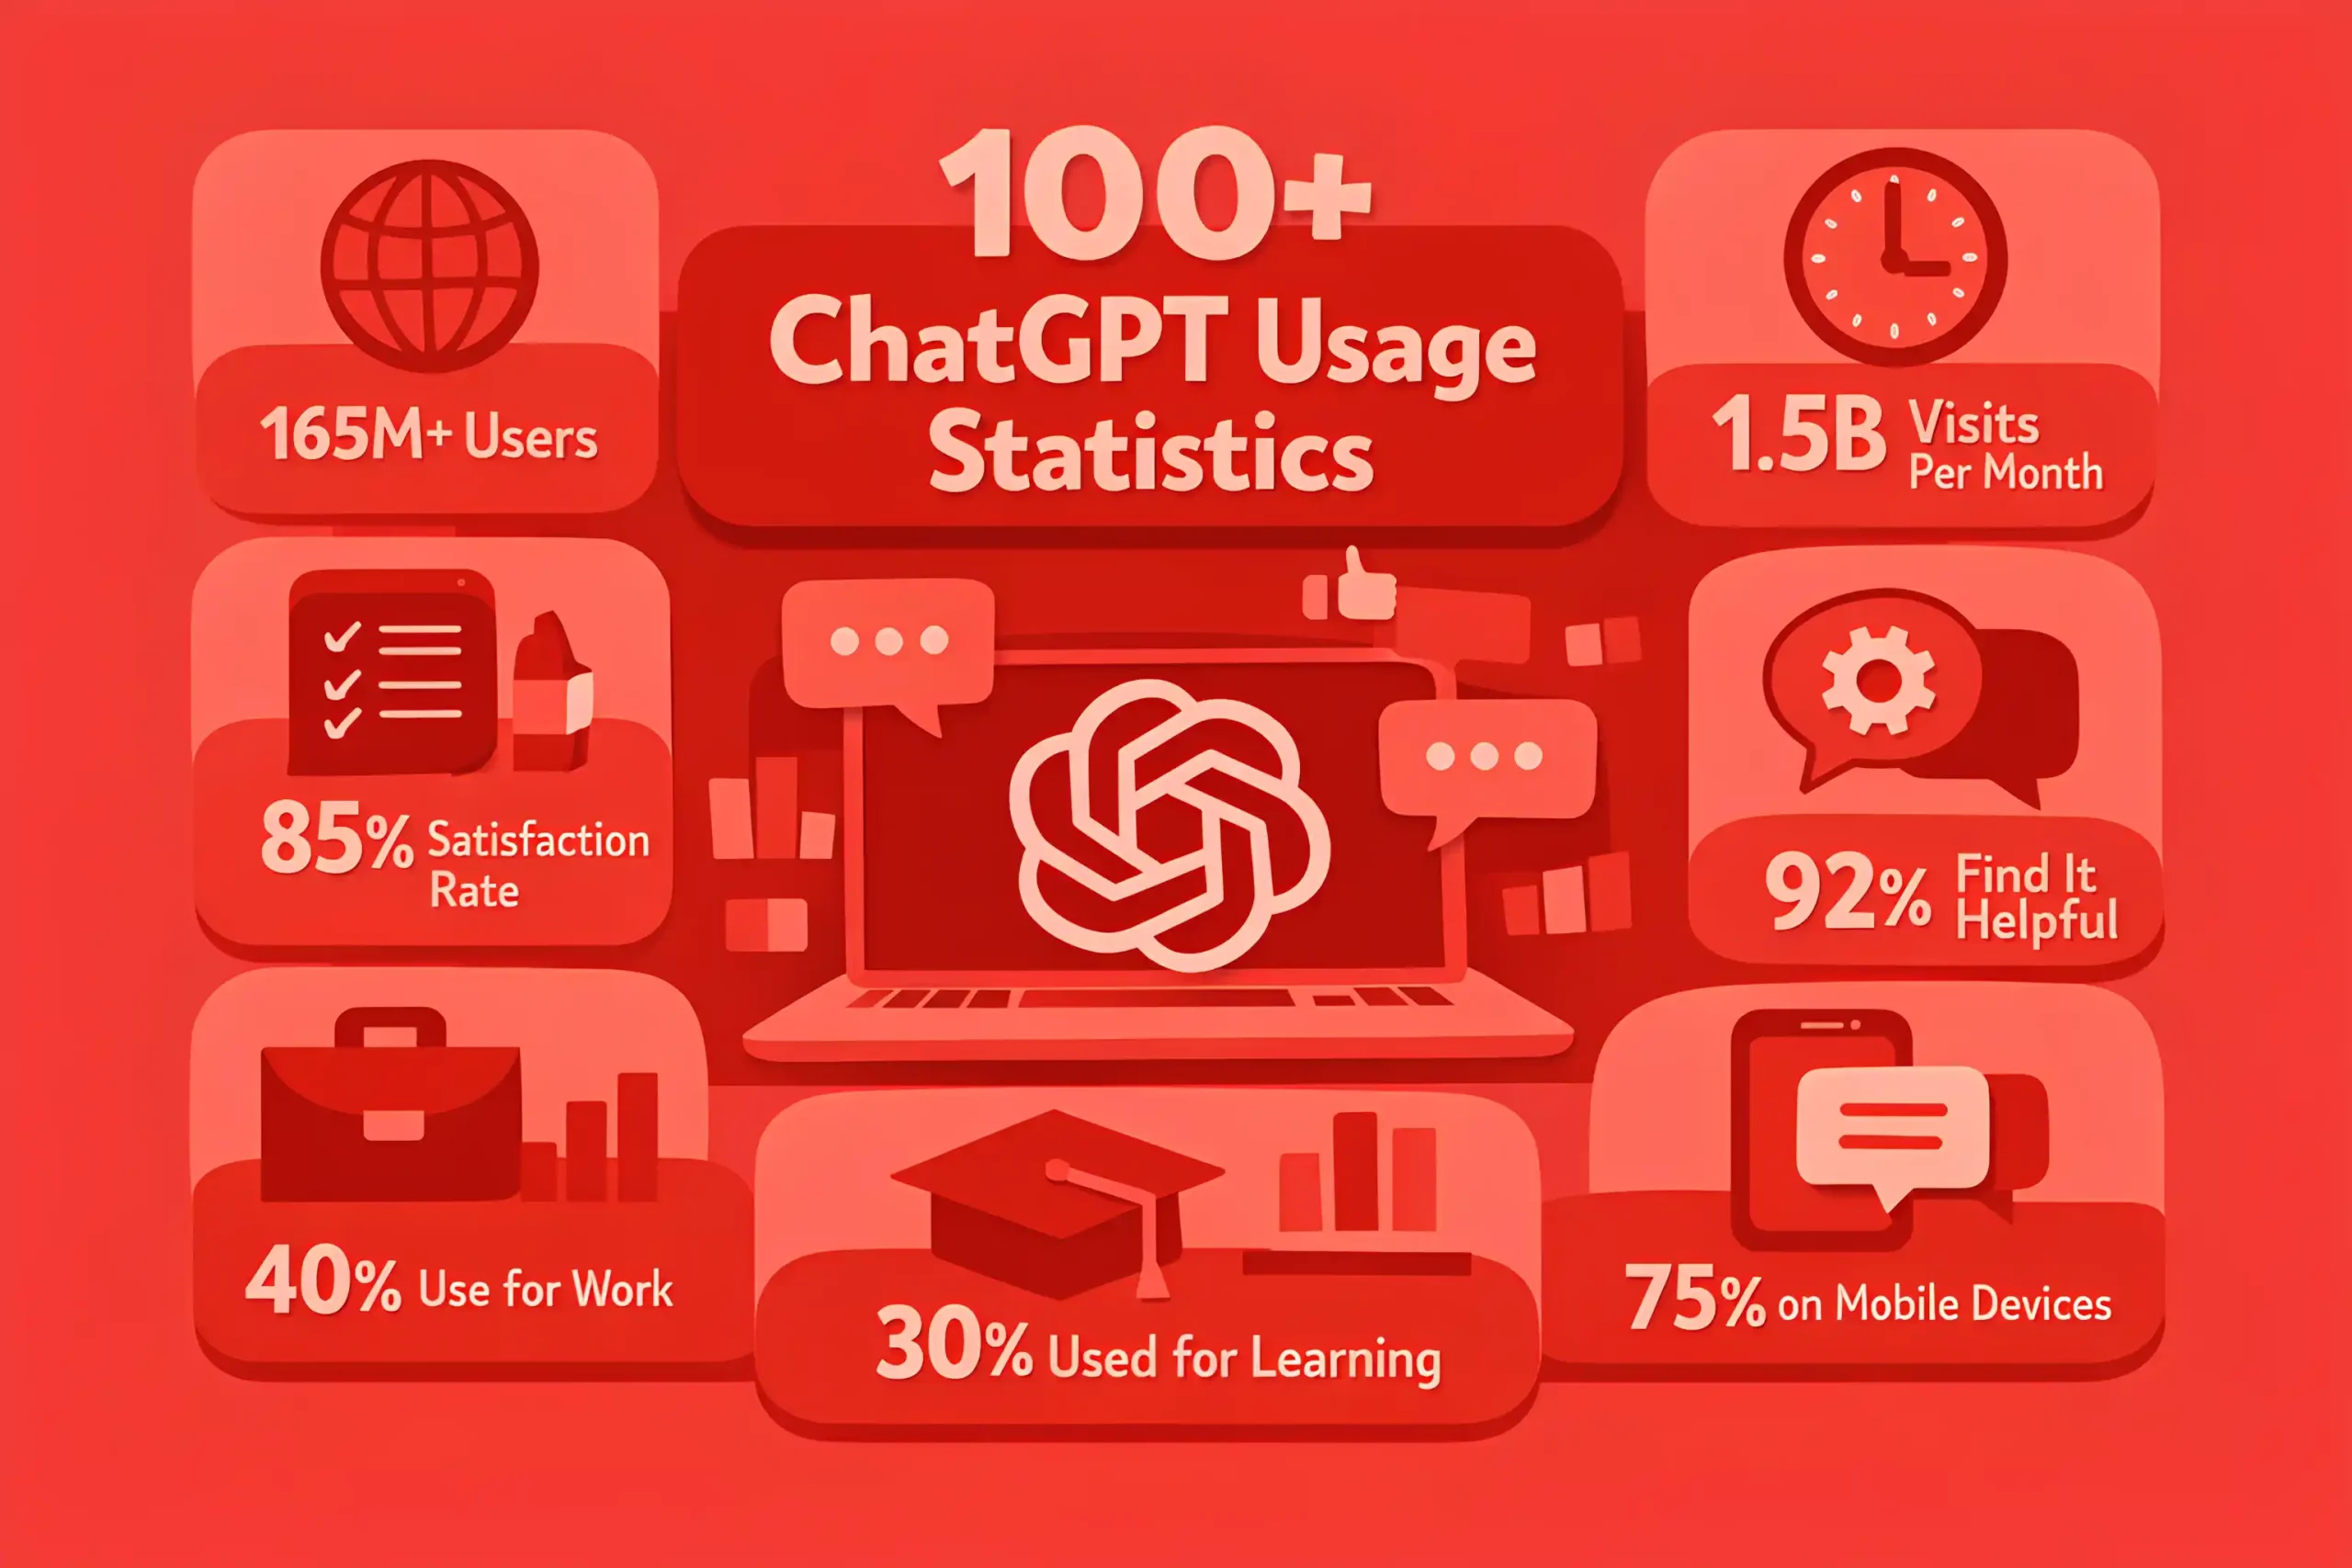
The data behind these shifts is more than trivia; it is the evidence shaping billion-dollar marketing strategies and setting new industry benchmarks. In our collection of 100+ web design statistics, we highlight the trends, behaviors, and performance insights that matter most right now.
Whether you are optimizing user journeys, planning redesigns, or building content assets, understanding where design directly impacts growth is no longer optional; it is the difference between leading the market and falling behind.
User Experience and Engagement
88% of users say they will not return to a website after a poor user experience.
Websites with clear navigation reduce bounce rates by up to 40%.
70% of consumers report abandoning carts due to poor usability or confusing checkout flows.
94% of first impressions about a website are related to its design.
A one-second delay in page response can reduce user satisfaction by 16%.
Sites that load in under 3 seconds see engagement rates nearly 50% higher than slower sites.
83% of users expect a website to look good on all devices.
75% of consumers admit they judge credibility based on website design.
Personalized experiences increase time-on-site by an average of 35%.
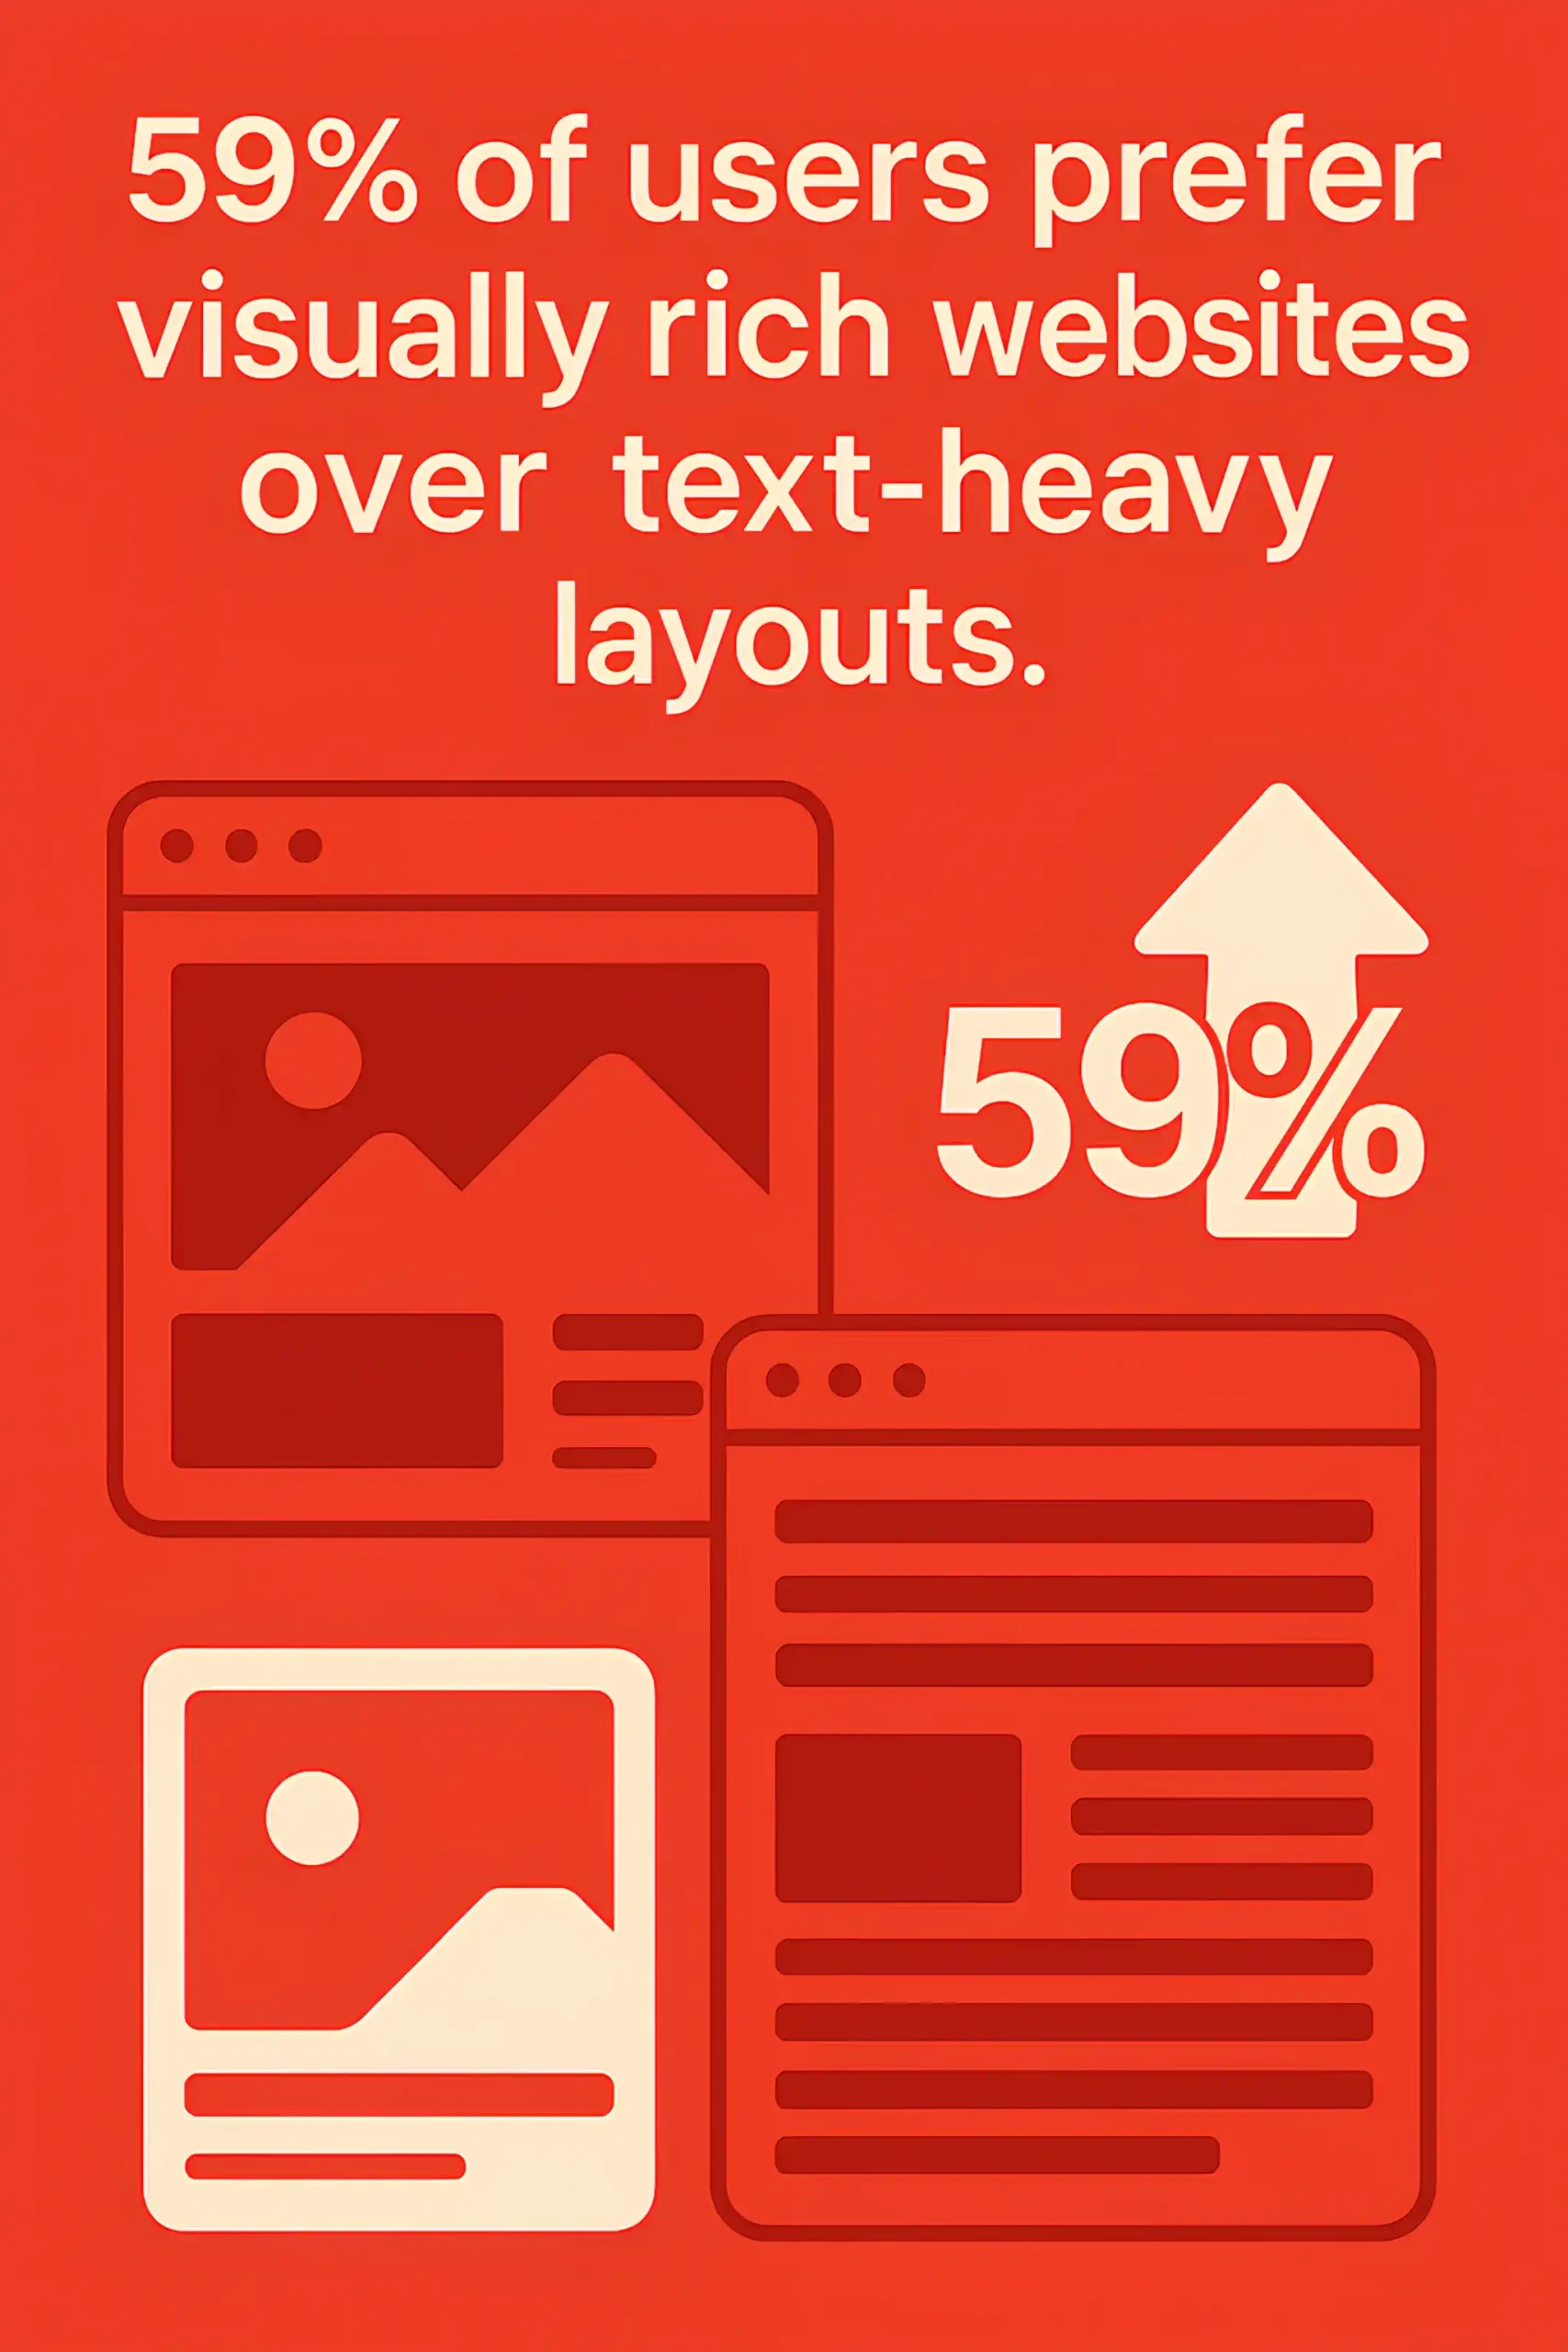
59% of users prefer visually rich websites over text-heavy layouts.
You Can Also Dive Into Our 200+ Social Media Marketing Statistics
Websites with interactive elements see engagement rise by up to 47%.
Over 60% of users leave a site immediately if the layout feels cluttered or overwhelming.
Mobile and Responsive Design
73% of web designers say that a non-responsive design is the top reason visitors leave a site.
Mobile devices now account for over 58% of global website traffic.
Nearly 80% of users will stop engaging with content if it does not display well on their device.
A site that is not mobile-friendly is 60% less likely to rank on the first page of Google.
Responsive design can improve mobile conversions by up to 67%.
40% of users have turned to a competitor’s site after a poor mobile experience.
Sites optimized for mobile see 2x more time spent on page compared to non-optimized sites.
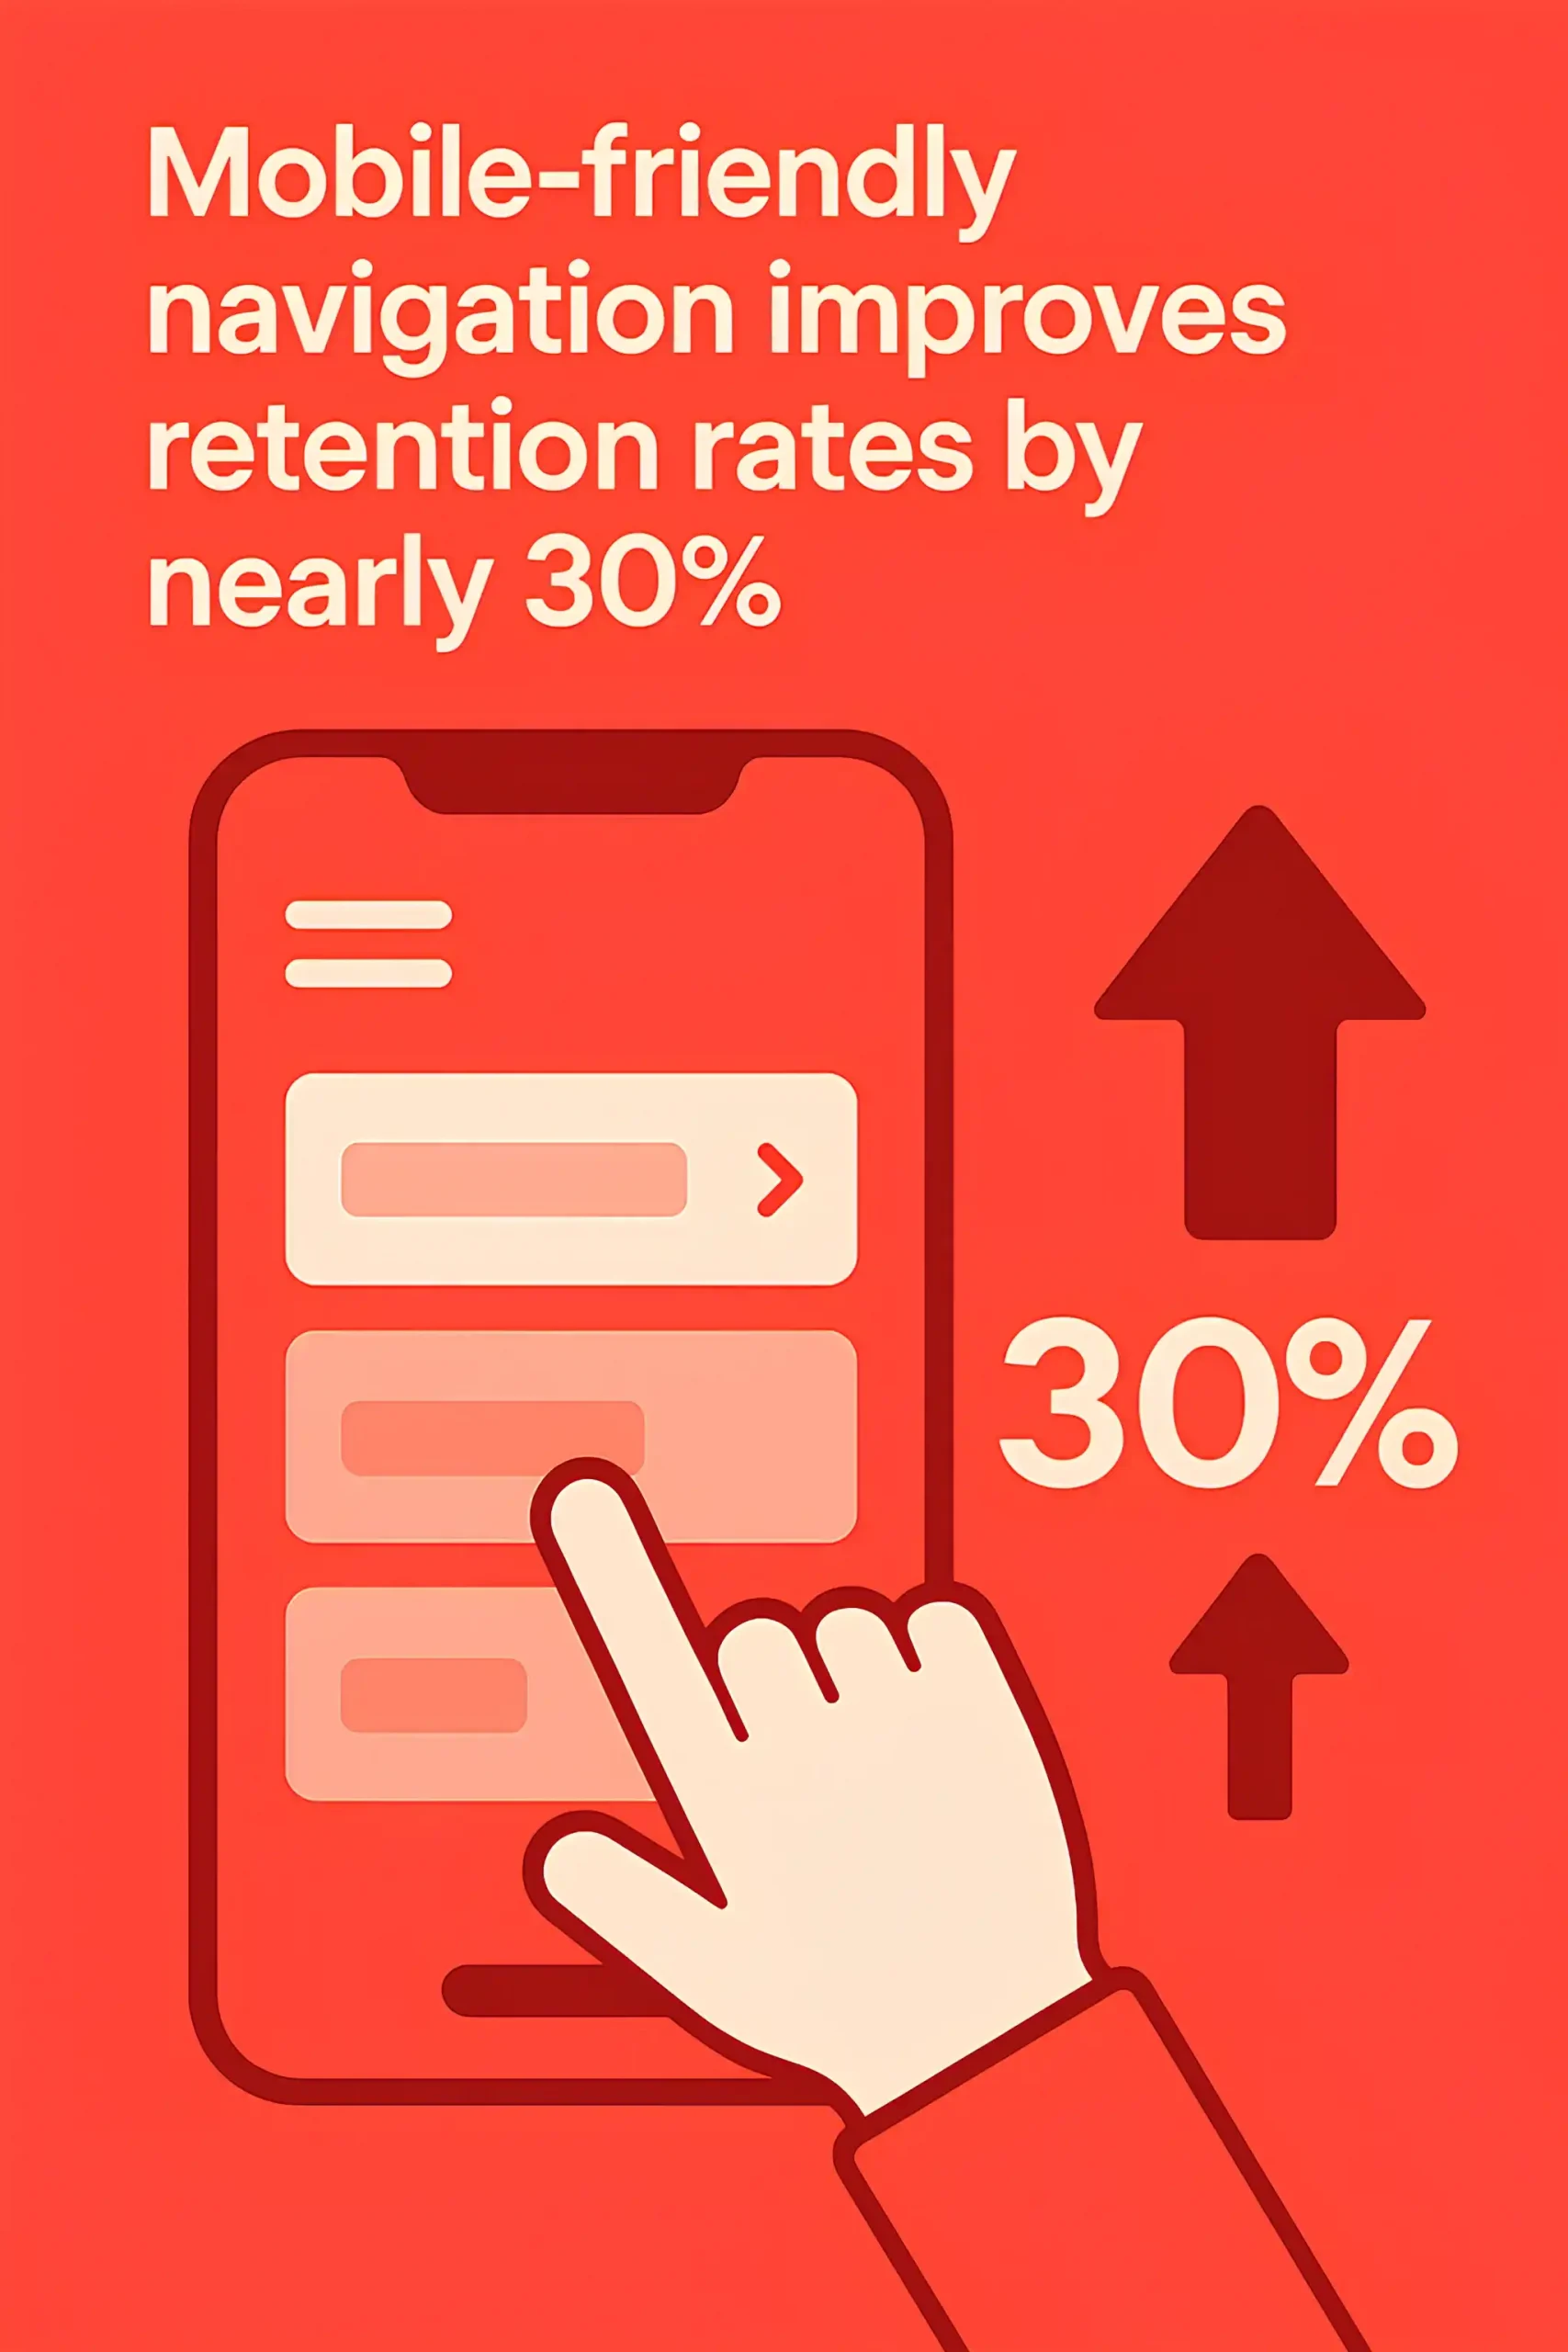
Mobile-friendly navigation improves retention rates by nearly 30%.
You May Want to Take a Look at Our 100+ Reputation Management Statistics
57% of internet users say they would not recommend a business with a poorly designed mobile site.
Google reports that 53% of mobile users abandon a site that takes more than 3 seconds to load.
Touch-friendly design increases engagement on interactive elements by 35%.
85% of adults believe a company’s mobile site should be as good or better than its desktop site.
Websites with responsive images load 25% faster on average for mobile users.
Sites with a mobile-first design approach see 20% higher engagement than those adapted from desktop.
Over 70% of e-commerce sales in 2026 are projected to come from mobile devices.
Website Performance and Speed
A one-second delay in page load can lower conversions by 7%.
Sites that load in under 2 seconds experience 50% higher engagement than slower ones.
53% of users abandon a site if it takes longer than 3 seconds to load.
A delay of just 100 milliseconds can drop conversion rates by 5%.
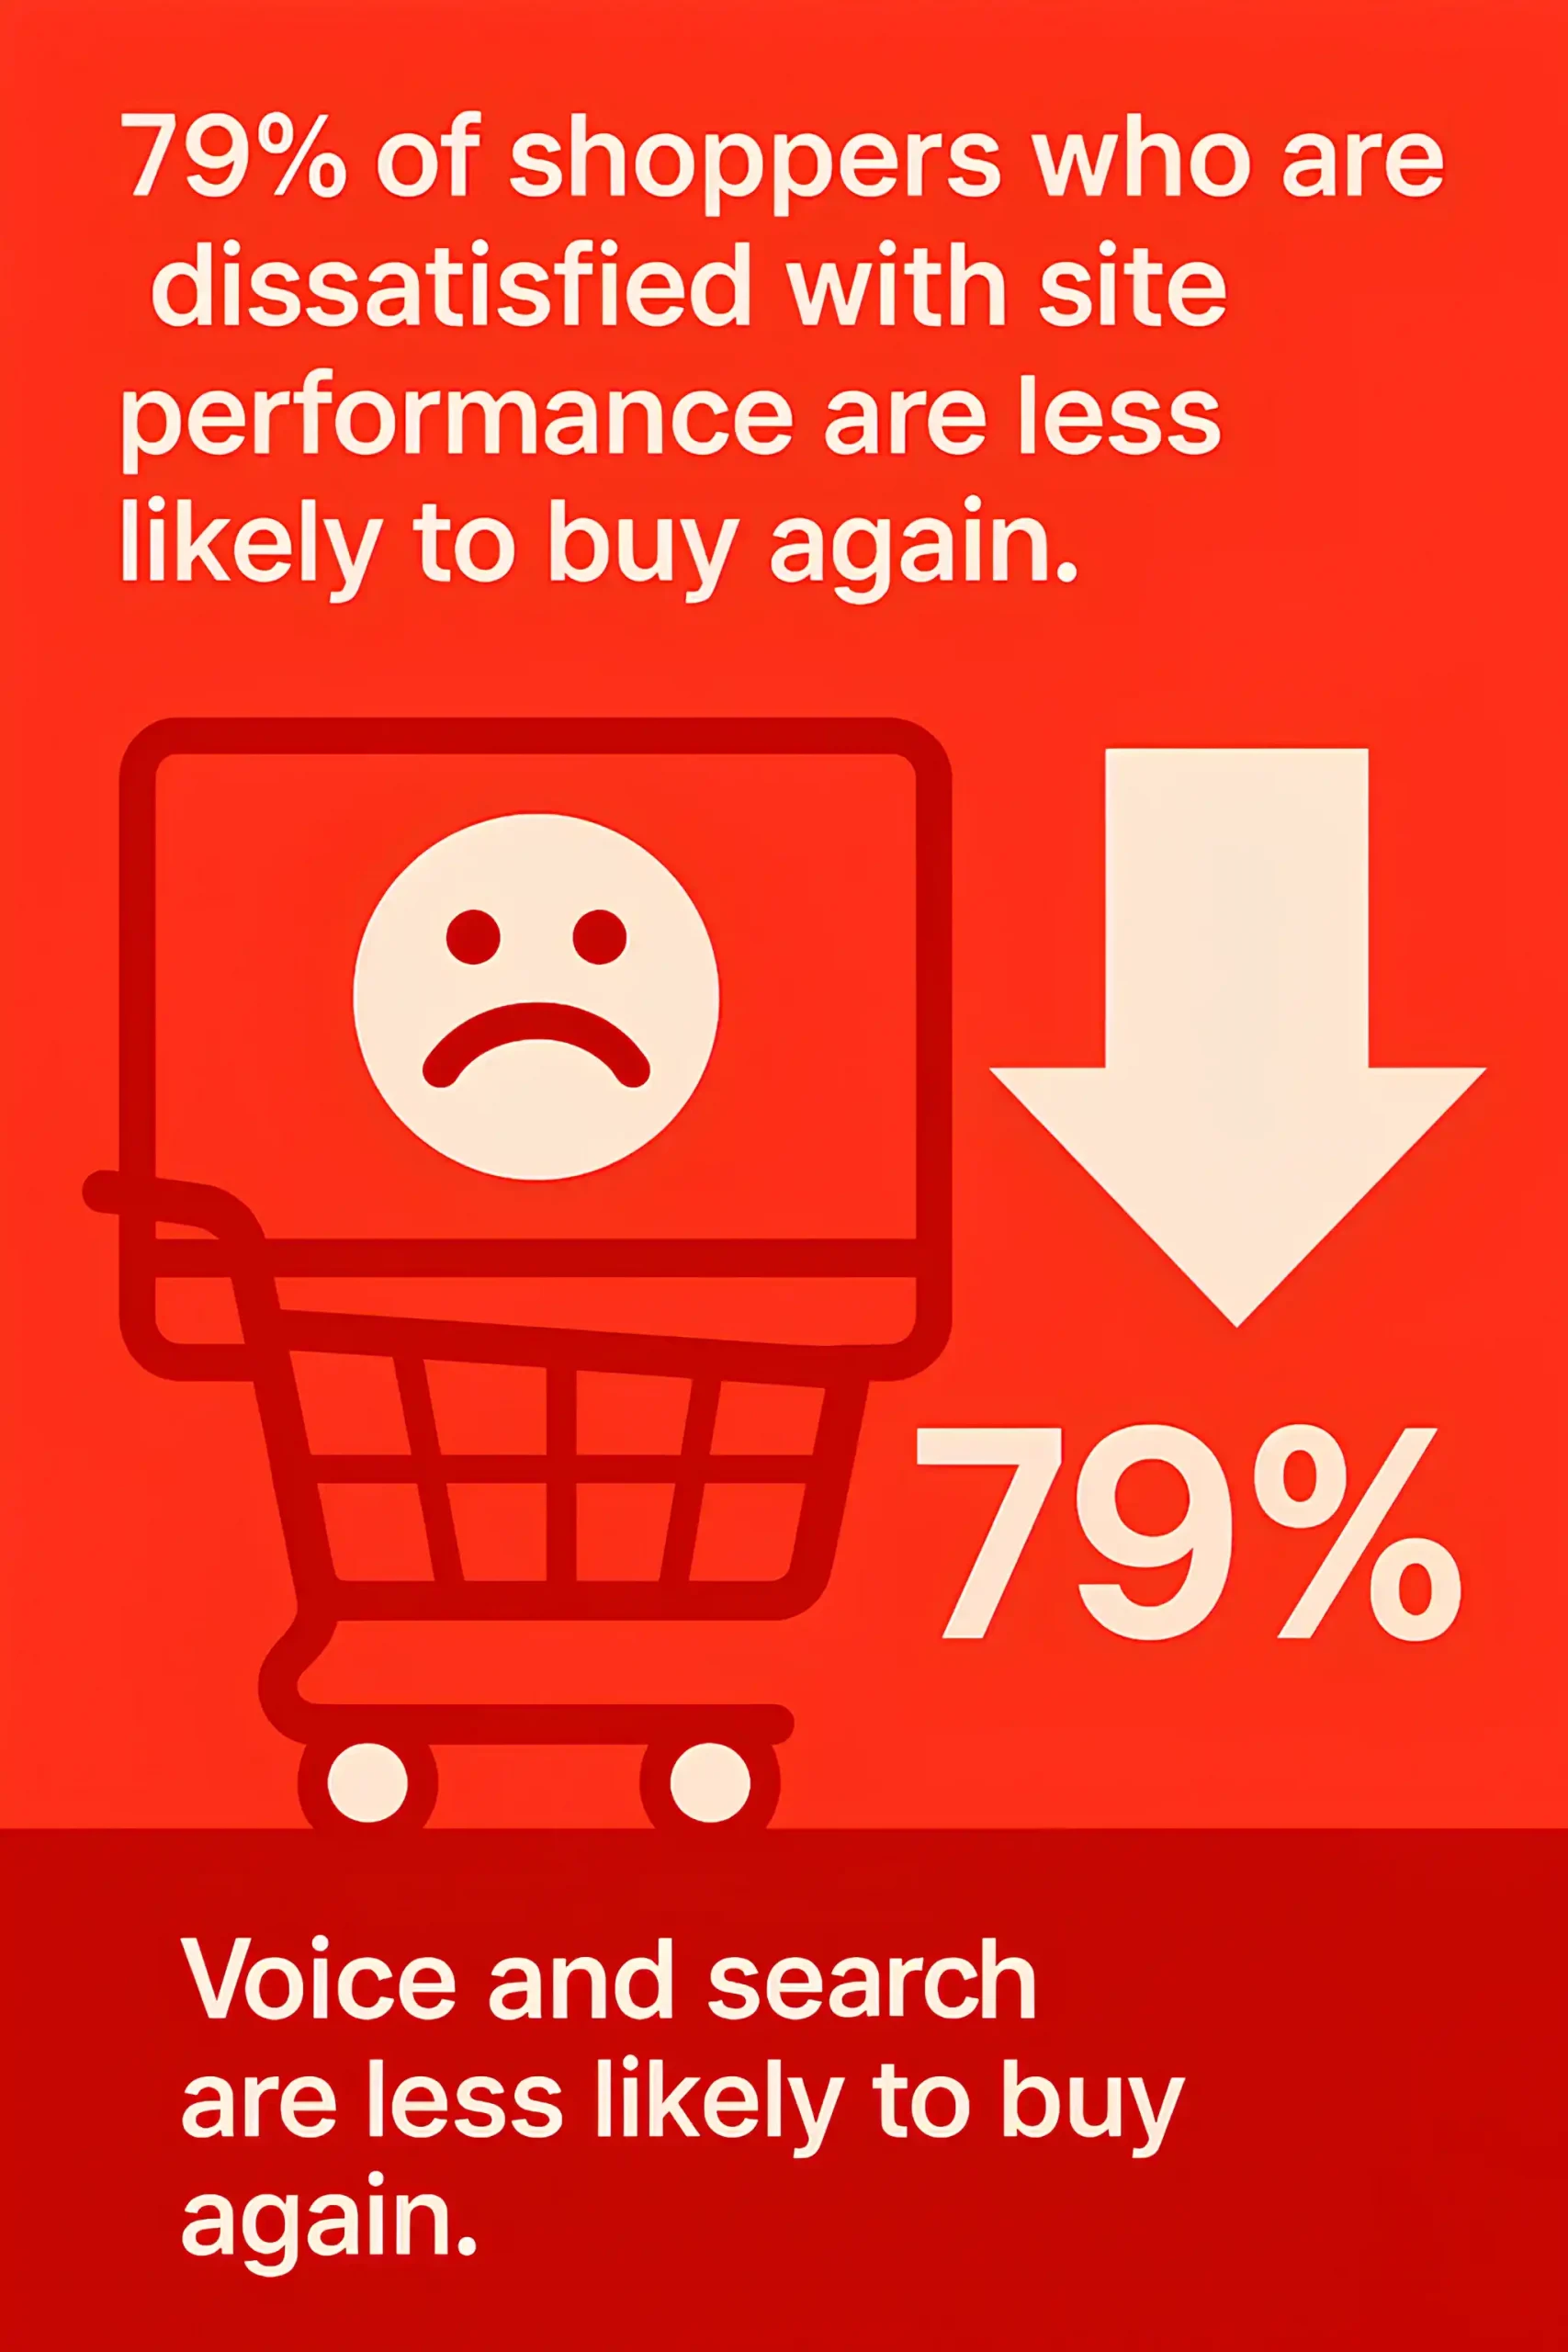
79% of shoppers who are dissatisfied with site performance are less likely to buy again.
You Might Also Be Curious About Our 200+ Affiliate Marketing Statistics
Google’s Core Web Vitals directly link page speed to search rankings.
Pages that load in under 1 second see 3x higher mobile conversion rates.
Website downtime or slowness causes $2.6 billion in lost revenue each year.
Heavy images are responsible for over 60% of average load times.
Faster websites reduce bounce rates by up to 35%.
Sites optimized with content delivery networks (CDNs) load 50% faster worldwide.
A 2-second improvement in load time can increase conversions by 15–20%.
40% of users say performance issues damage brand perception.
Websites with lazy loading enabled reduce bandwidth use by up to 30%.
Visual Design and Aesthetics
94% of first impressions are design-related rather than content-based.
Consistent brand colors can improve recognition by up to 80%.
Users form an opinion about a website’s visual appeal in just 0.05 seconds.
Sites with a modern, minimal design experience 40% higher engagement.
Over 70% of users trust businesses more when websites have professional imagery.
Pages with well-structured layouts improve user comprehension by 47%.
Using white space effectively can increase attention on key elements by 20%.
75% of consumers admit they judge credibility by overall website aesthetics.
Websites with high-quality visuals convert nearly twice as well as text-only designs.
Typography choices influence readability and retention by up to 60%.
Brands using consistent visual identity across pages see 23% more loyal visitors.
Dark mode adoption has grown, with over 80% of users preferring it on at least one device.
Visual hierarchy done right can guide users to CTAs, boosting conversions by 30%.
Sites with cluttered designs see bounce rates 50% higher than clean, simple ones.
Over 65% of users say aesthetics directly affect their willingness to engage with content.
Don’t Miss Our 250+ Digital Marketing Statistics
Conversion Rates and Business Impact
Improving site speed by one second can increase conversions by up to 20%.
Adding clear calls-to-action boosts conversion rates by 80% on average.
Websites with personalized experiences achieve conversion lifts of 30% or more.
Reducing checkout form fields from 6 to 3 can raise e-commerce conversions by 50%.
Businesses that invest in UX design see conversion rates improve by up to 400%.
Over 70% of small businesses cite their website as their primary driver of revenue.
A well-placed testimonial or review can increase conversions by 34%.
Sites with video on landing pages boost conversions by up to 86%.
Cart abandonment averages 69%, largely due to poor design or hidden costs.
Brands that use consistent design and messaging see revenue growth 23% faster than competitors.
Over 80% of users say they are more likely to buy from a site that feels trustworthy.
Improving mobile checkout flows can double conversions for e-commerce brands.
Live chat support increases lead conversions by 40%.

A/B testing key design elements lifts conversion rates by an average of 25%.
Every $1 invested in conversion-focused design yields up to $100 in return.
E-commerce and Online Shopping
Over 70% of e-commerce sales in 2026 are projected to come from mobile devices.
The global e-commerce market is expected to surpass $7 trillion in 2026.
Nearly 90% of shoppers say product images are the most important factor in an online purchase.
Adding product videos can increase purchases by up to 144%.
Over 60% of users abandon carts due to unexpected costs or poor checkout design.
One-click checkout can raise conversion rates by 25–30%.
Personalized product recommendations account for 31% of e-commerce revenue.
Sites with customer reviews and ratings see conversion lifts of up to 63%.
Around 55% of online shoppers will not complete a purchase if guest checkout is unavailable.
Pages that display low-stock urgency can increase sales by 36%.
E-commerce sites with fast load times generate up to 40% more revenue.
Free shipping offers influence 79% of online purchases.
Over 45% of consumers abandon carts if payment methods are limited.
Social commerce is expected to drive over $1.5 trillion in sales in 2026.
Over 65% of shoppers expect real-time order tracking as a standard feature.
Accessibility and Inclusivity
Over 1 billion people worldwide live with a disability that impacts digital access.
98% of websites still fail to meet full WCAG accessibility standards.
Sites with an accessible design reach an audience 20% larger on average.
Over 70% of users with disabilities will leave a site immediately if it is not accessible.
Adding alt text to images improves both accessibility and SEO visibility.
Accessible sites see 35% lower bounce rates among all visitors, not just those with disabilities.
More than 60% of businesses risk legal action due to non-compliance with accessibility laws.
Websites designed with color contrast compliance improve readability for 80% of users.
Captions on videos increase viewing time by 12% on average.
Keyboard navigation support improves usability for over 25% of users.
Inclusive design can boost brand reputation and increase customer loyalty by 30%.
Over 80% of users are more likely to engage with brands that prioritize inclusivity.
Accessible e-commerce sites earn over 15% more revenue than non-accessible competitors.
Voice-enabled navigation improves engagement for both disabled and non-disabled users.
By the end of 2026, more than 50% of organizations are expected to prioritize accessibility in their digital strategy.
Emerging Technologies and Trends
Over 65% of businesses are adopting AI-driven design tools to streamline workflows.
The use of voice search optimization is projected to influence 30% of web traffic in 2026.
More than 50% of new websites now integrate chatbots or conversational AI.
Augmented reality (AR) is expected to drive $6 billion in e-commerce sales in 2026.
Websites with 3D product visualization see conversion lifts of up to 40%.
Over 70% of designers say AI accelerates prototyping and wireframing.
Progressive web apps (PWAs) increase engagement rates by 50% compared to standard mobile sites.
More than 40% of marketers plan to integrate Web3 elements such as NFTs into digital experiences.
The global voice commerce market is set to exceed $45 billion in 2026.
Sites using AI personalization engines see revenue growth 15–20% faster than competitors.
Dark mode adoption continues to rise, with over 80% of users enabling it on at least one device.
Blockchain-based authentication is projected to secure 25% of online transactions in 2026.
Over 60% of users expect websites to include micro-interactions for a more engaging experience.
Motion design and animations improve time-on-site by 25%.
In 2026, nearly 50% of web design budgets will allocate resources to immersive technologies such as AR and VR.
Security and Trust Factors
85% of online shoppers say they will not purchase from a site that lacks HTTPS.
Over 50% of websites still have vulnerabilities that put user data at risk.
Adding trust badges and security seals can increase conversions by 42%.
Around 70% of users abandon transactions if they feel a site is not secure.
Phishing attacks account for more than 20% of reported online security breaches.
Sites with two-factor authentication see 30% higher customer trust levels.
Over 60% of consumers check for SSL certificates before entering payment details.
A data breach can reduce a company’s share price by 7% on average.
More than 40% of small businesses experience a cyberattack within a given year.

Displaying clear privacy policies increases user trust by 35%.
Sites using secure payment gateways convert 17% better than those without them.
Over 75% of users say they will leave if asked for too much personal information.
Brands with strong security reputations achieve customer loyalty 25% higher than competitors.
Biometric logins are expected to be used by 60% of e-commerce platforms in 2026.
Over 80% of consumers trust companies more when security features are visible during checkout.
The numbers show that design quality directly influences trust. That’s why our web design services prioritize clean layouts and modern visuals that reflect each brand’s credibility.
The Bottom Line
Web design goes far beyond looks. It is a direct driver of visibility, trust, and revenue. The statistics here show how every element, from performance and mobile design to accessibility and security, influences real business outcomes.
Ultimately, for marketers, business owners, and design professionals, the takeaway is simple: informed design choices create measurable growth.
These numbers are not only interesting trends; they are signals that point to where user expectations and industry standards are moving. Acting on them means stronger engagement, higher conversions, and lasting credibility. The businesses that apply these insights will set the pace, while those that ignore them risk falling behind.