Social media has reached a point where a single platform shift can redirect billions of dollars in advertising and reshape the industry. In 2026, more than 5.2 billion people actively use social platforms, and engagement patterns are evolving faster than most brands can keep up with.
NEWMEDIA.COM compiled 200+ fresh social media marketing statistics that reveal how users interact with content, where ad budgets deliver the strongest returns, and which platforms are capturing growth at scale.
Marketers and business leaders can use these insights to sharpen campaign targeting, adjust content strategy, and justify investment decisions with data that carries real weight. If you want your strategy built on proof rather than confusion, these are the numbers that matter.
Global Social Media Usage Statistics
Global social media users surpassed 5.2 billion in 2026, representing over 64% of the world’s population.
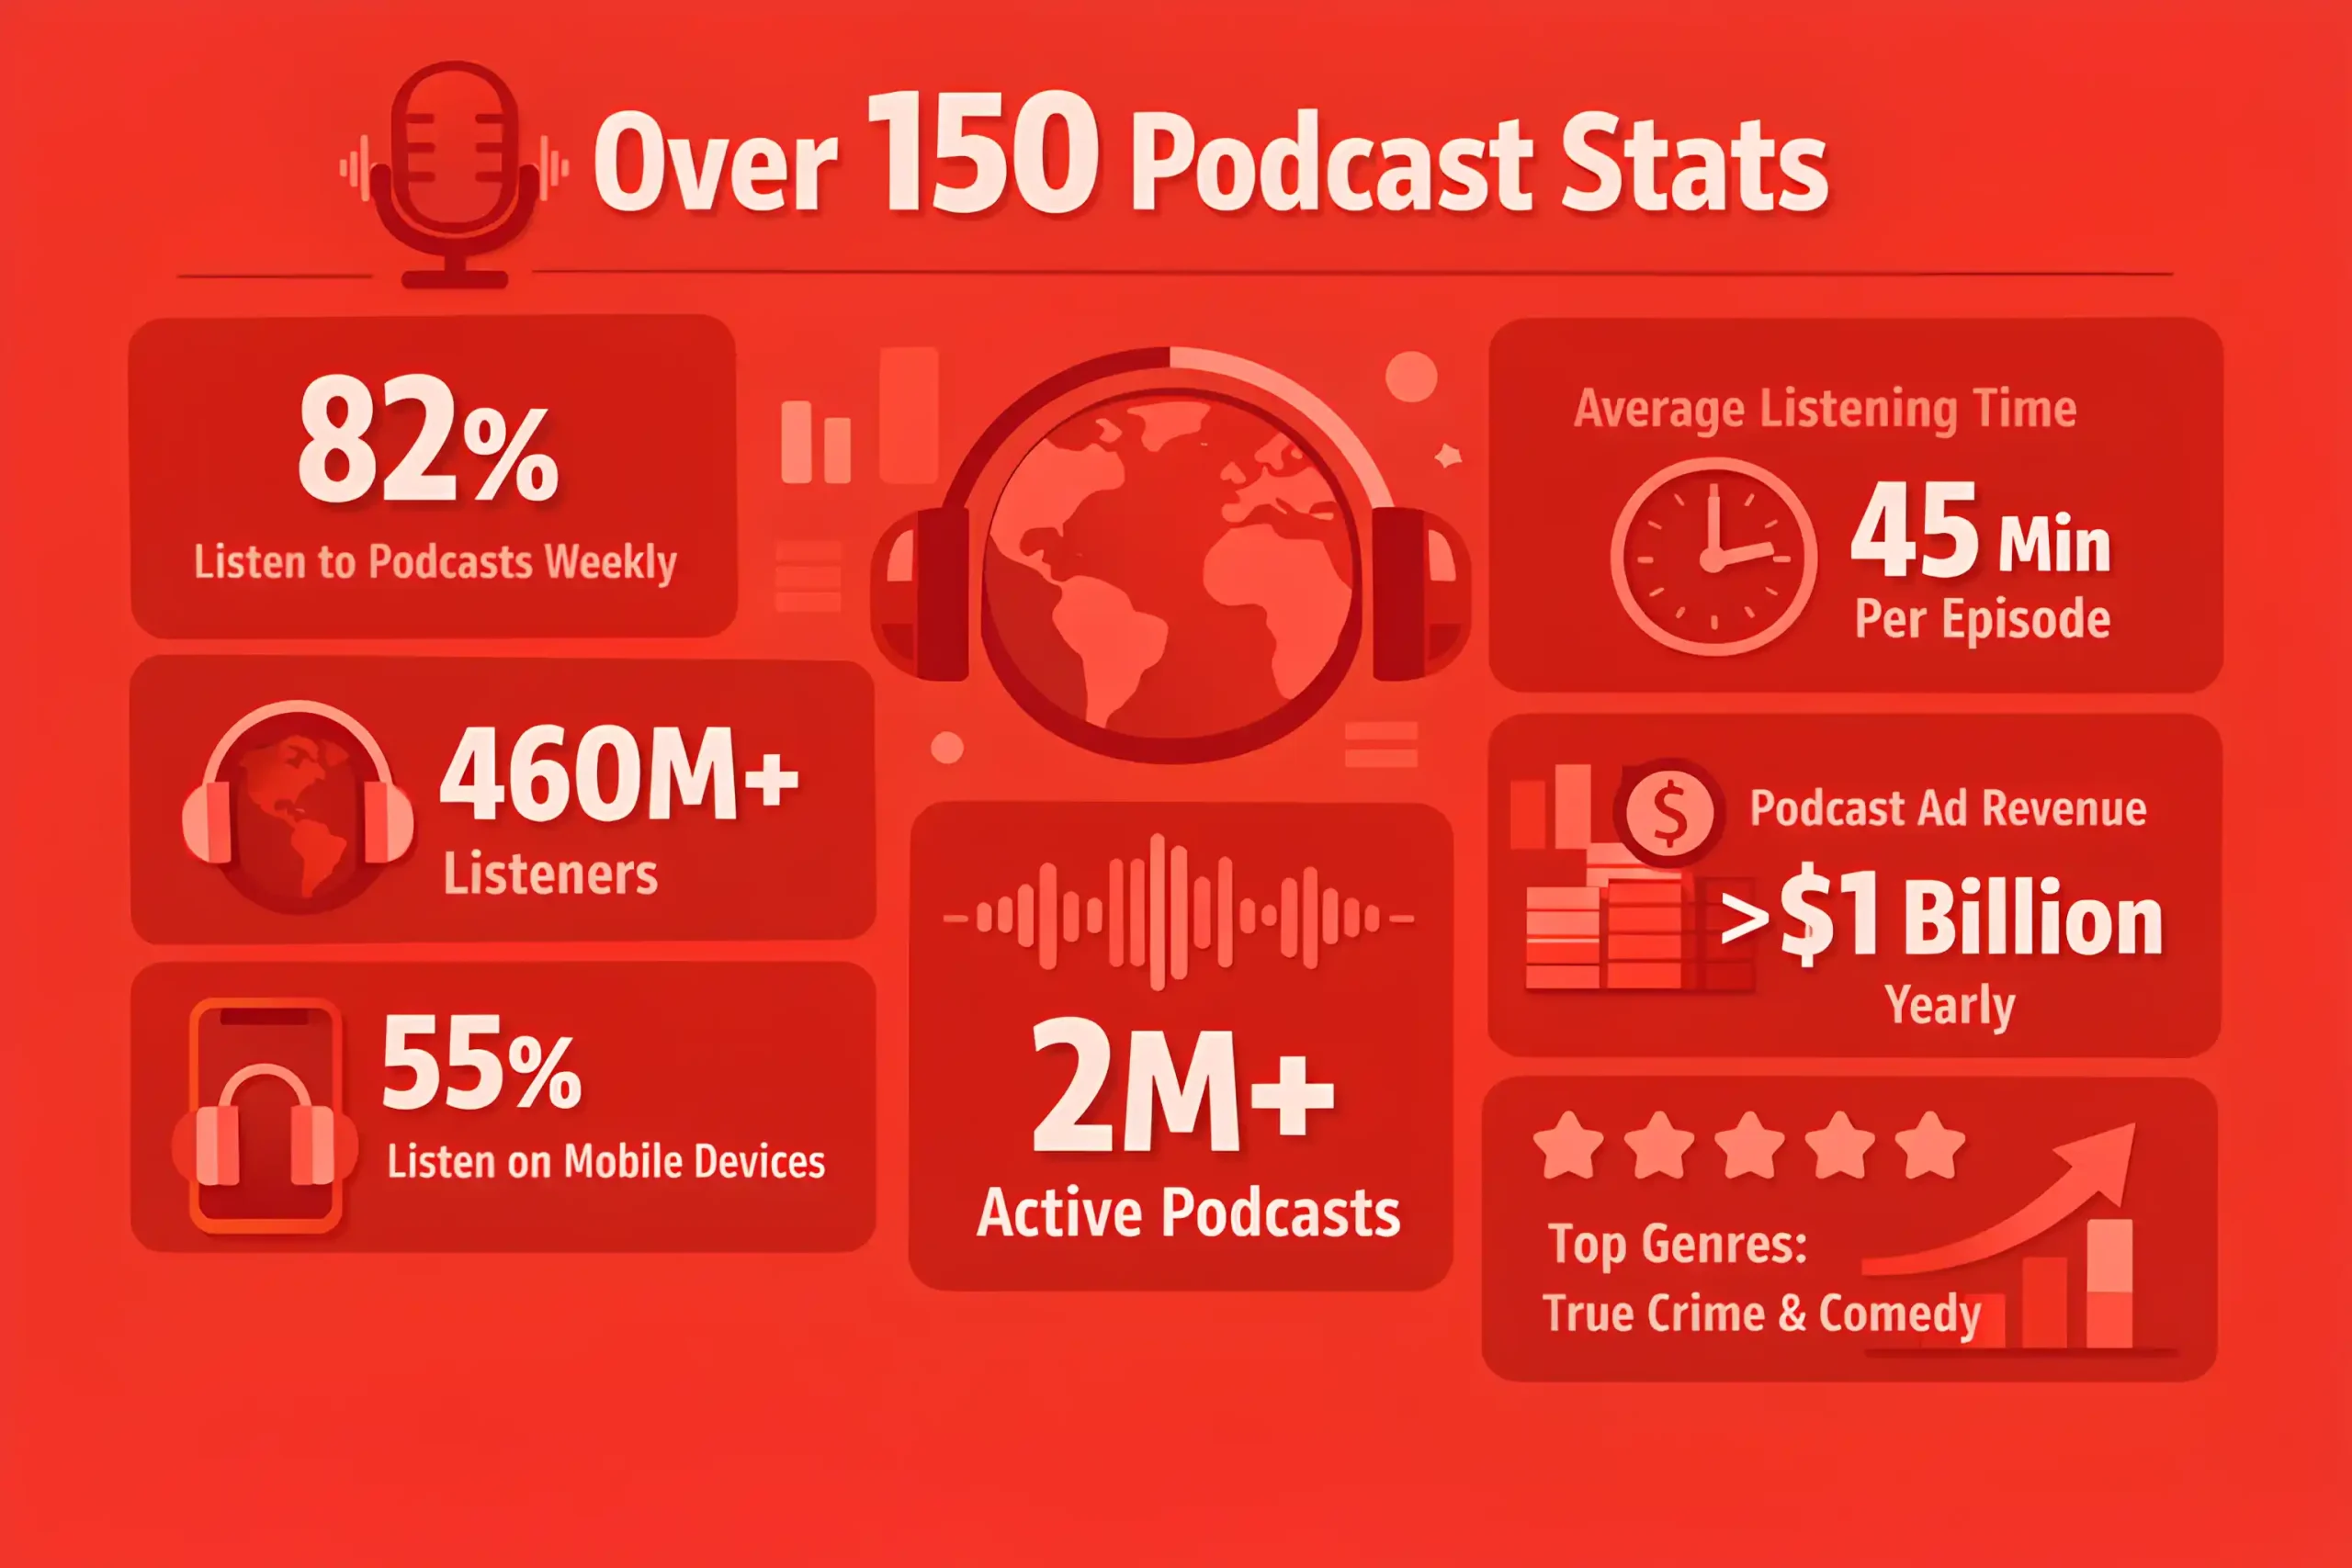
The average user now spends 2 hours and 28 minutes daily on social platforms.
93% of internet users actively access at least one social media platform each month.
Mobile devices account for more than 80% of all social media access worldwide.
Facebook remains the largest platform with 3.1 billion monthly active users.
TikTok has exceeded 1.6 billion monthly active users in 2026.
Instagram usage climbed to 2.3 billion monthly active users, up nearly 8% from 2024.
LinkedIn crossed 1 billion members globally, with strong growth in Asia-Pacific.
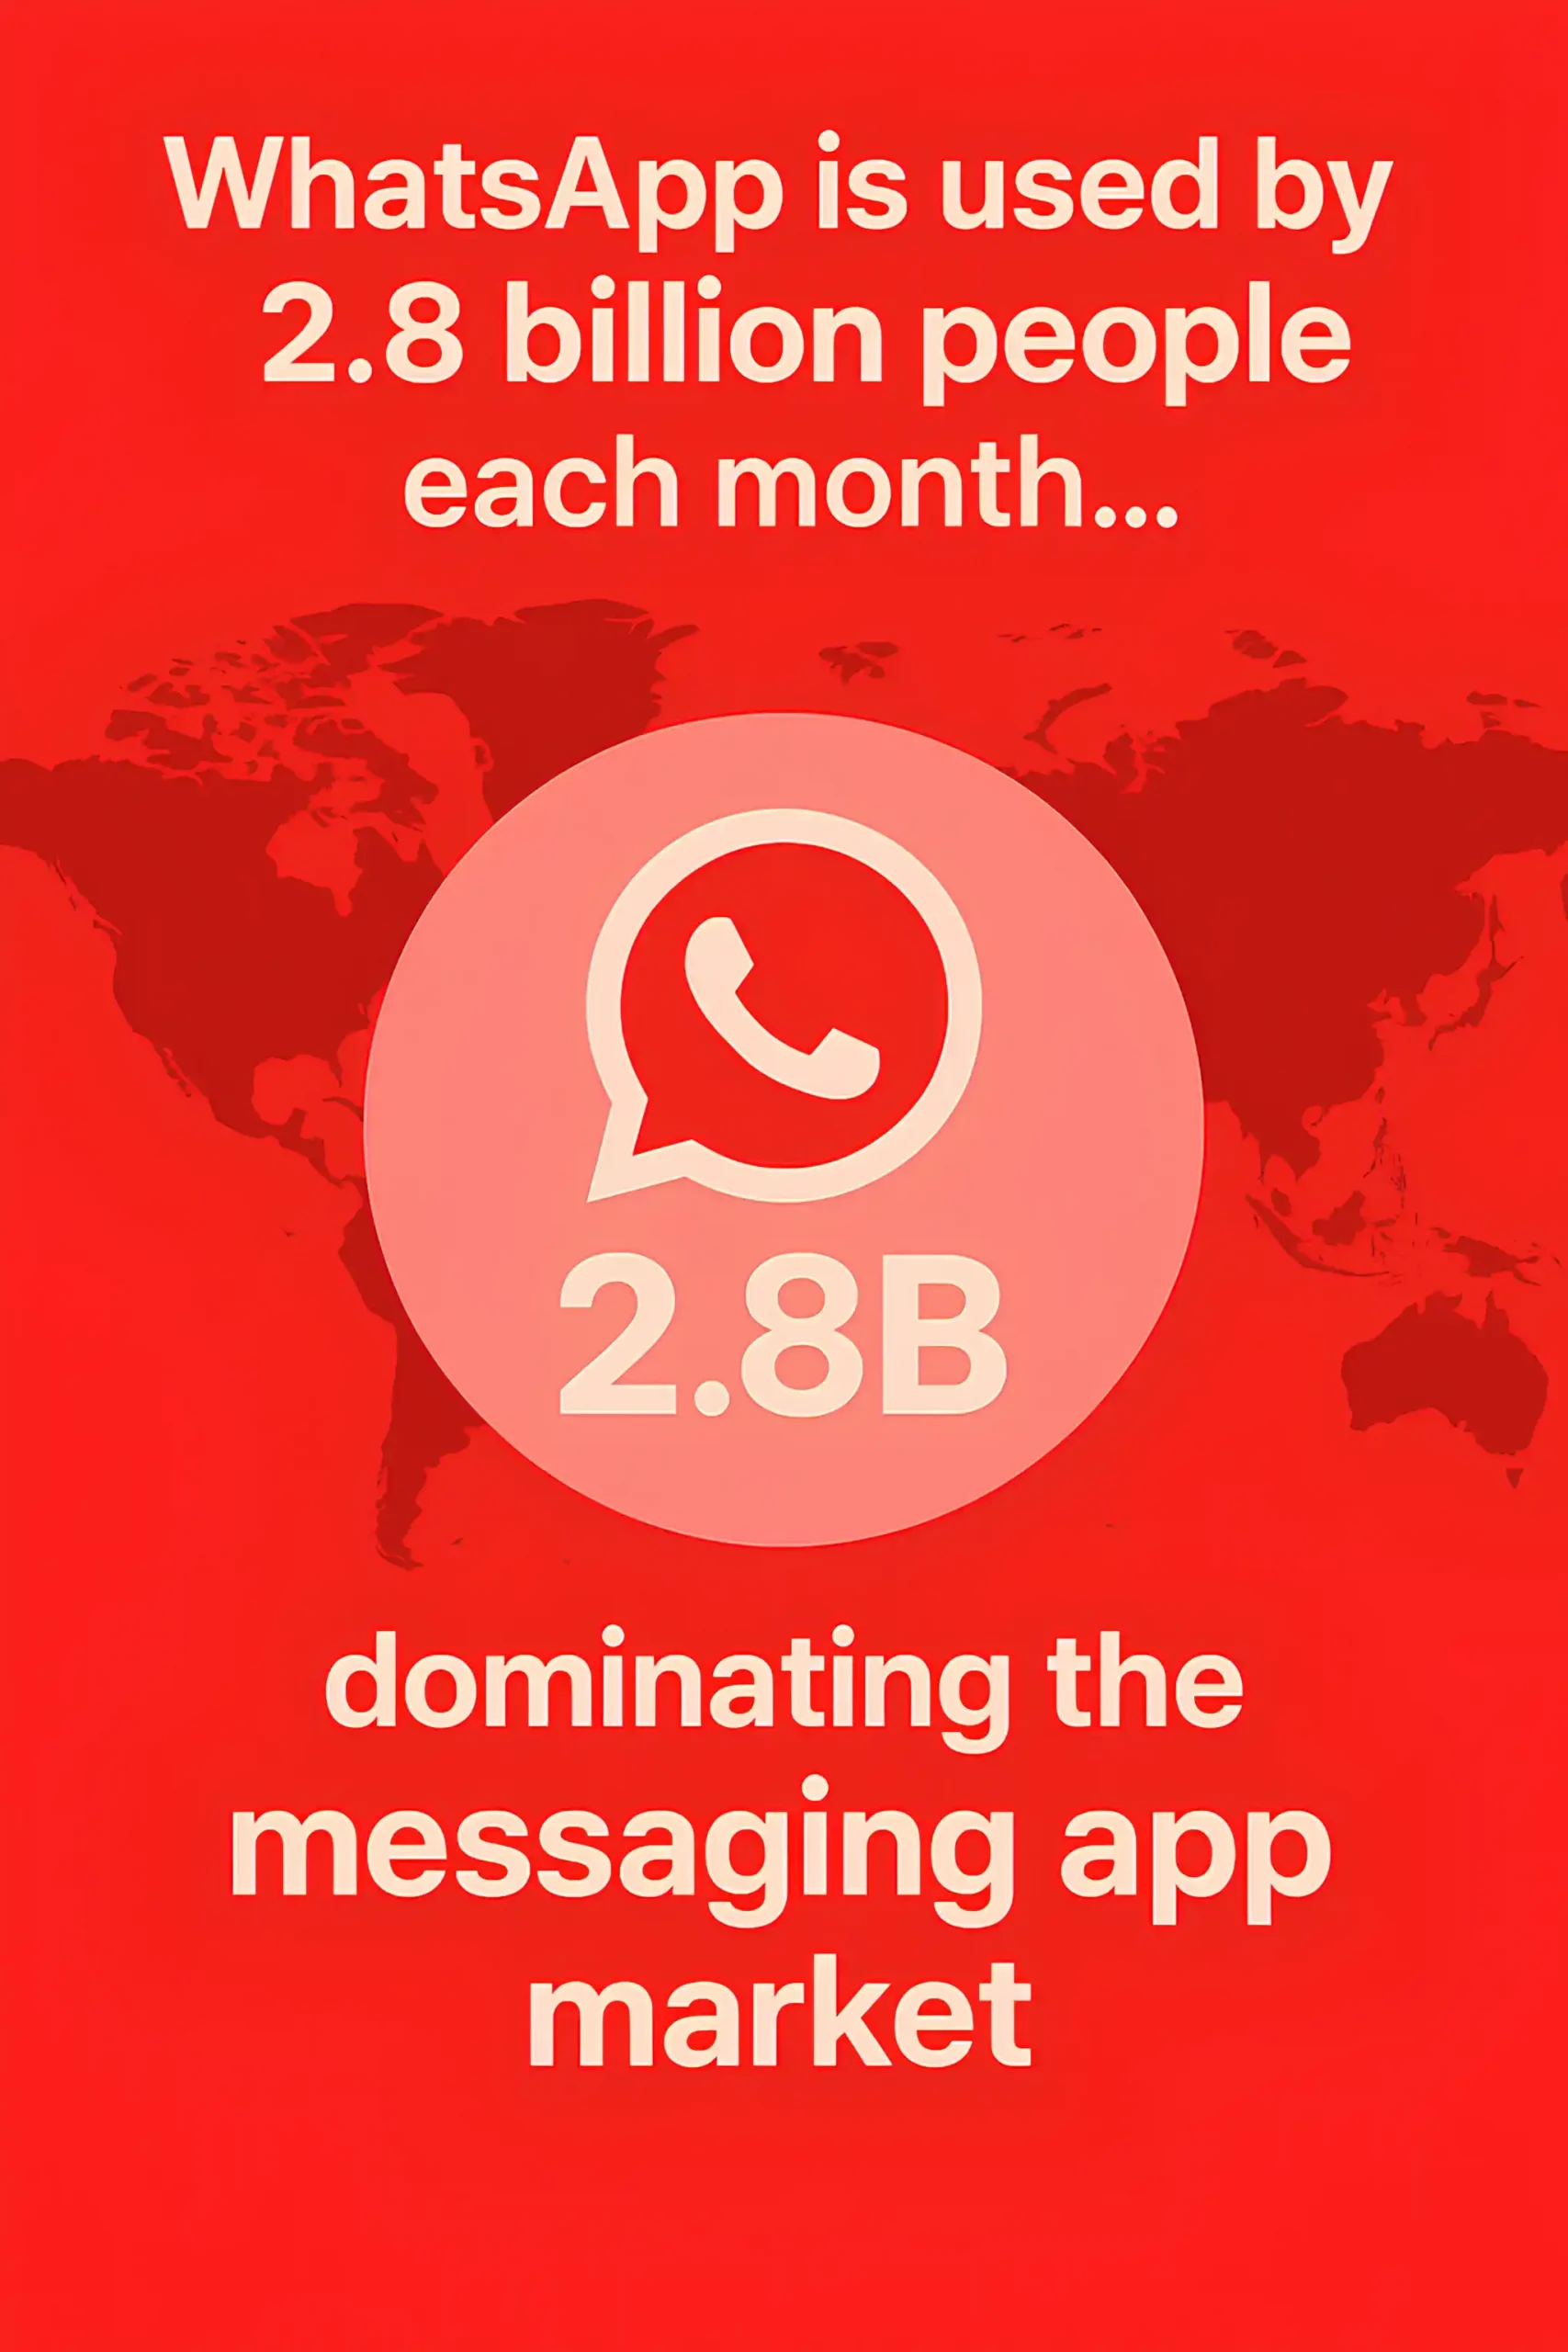
WhatsApp remains the most-used messaging app with 2.8 billion users.
YouTube attracts 2.9 billion monthly active users, with 1 billion hours of video watched daily.
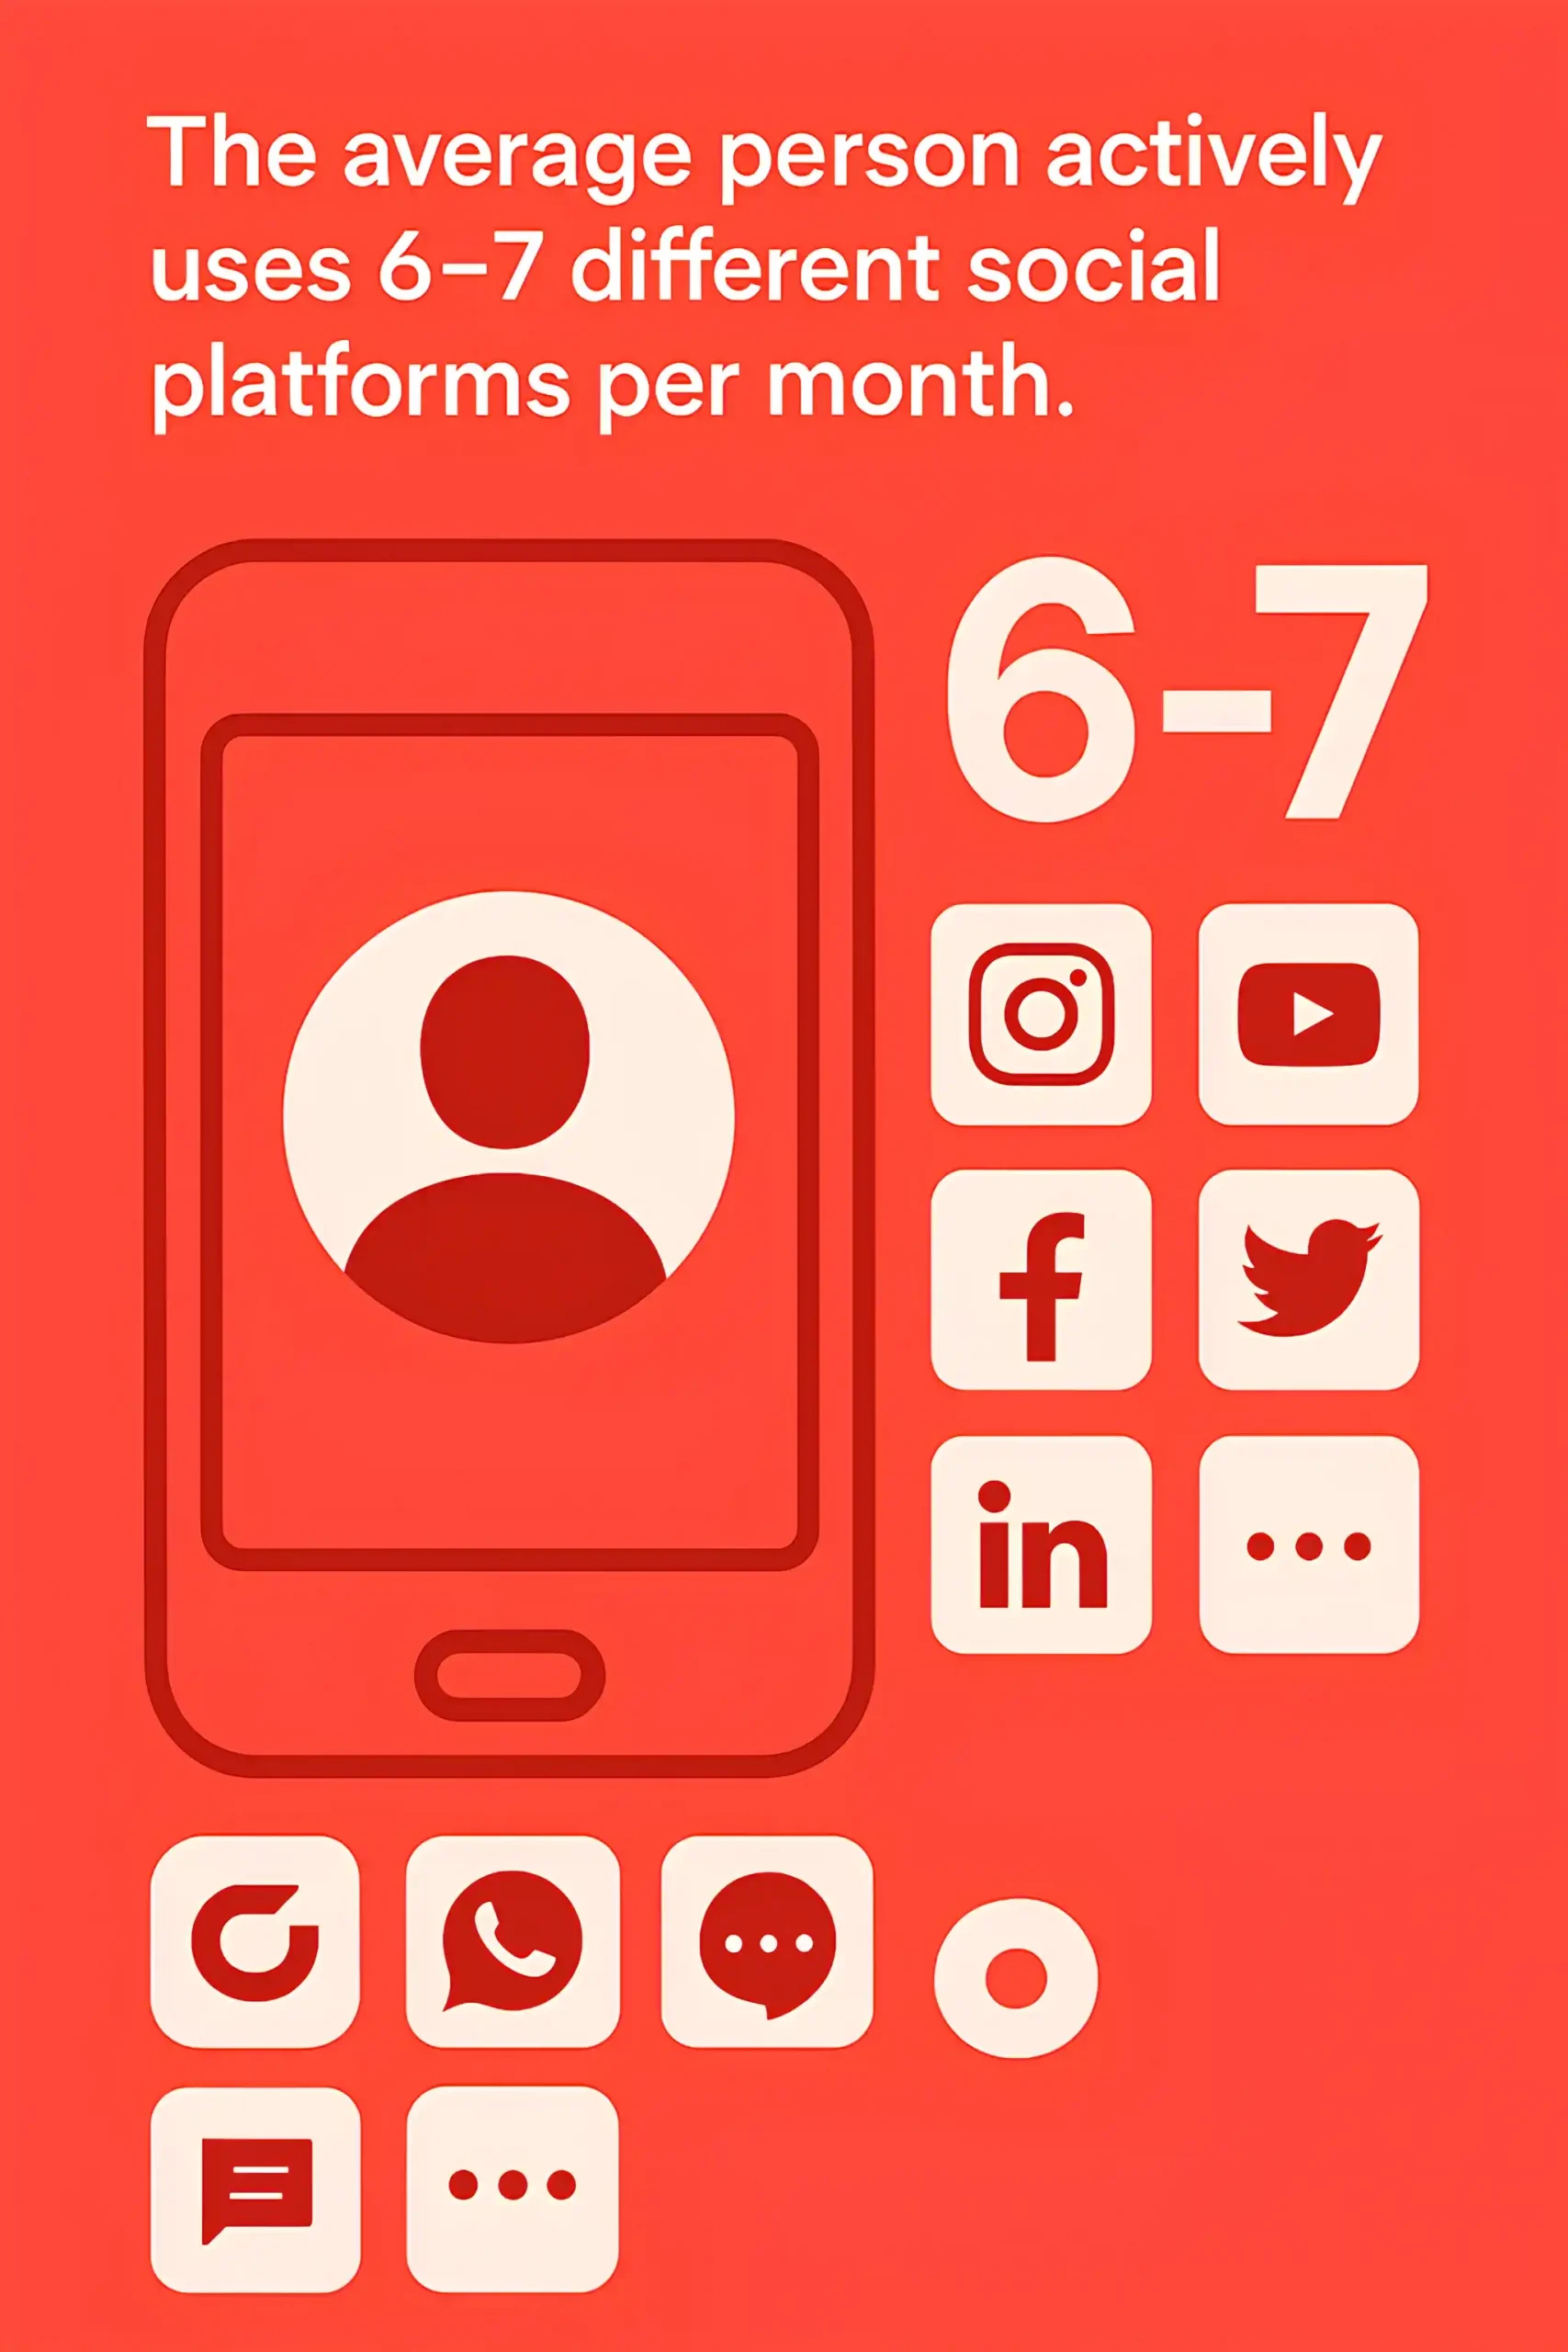
The average person actively uses 6–7 different social platforms per month.
Social media penetration in North America is at 83%, the highest worldwide.
Asia-Pacific accounts for nearly half of all global social media users.
More than 72% of consumers report social media as their primary source of brand discovery.
Global ad spend on social media is projected to hit 219 billion dollars in 2026, accounting for nearly one-third of total digital ad spend.
Don’t Miss Our 250+ Digital Marketing Statistics
Platform-Specific User Statistics
Facebook has 3.1 billion monthly active users in 2026, maintaining its position as the largest social platform worldwide.
Instagram reached 2.3 billion monthly active users, driven by the growth of Reels and shopping features.
TikTok surpassed 1.6 billion monthly active users, with the average user spending more than 55 minutes per day on the app.
YouTube attracts 2.9 billion monthly active users, making it the second most popular social network globally.
WhatsApp is used by 2.8 billion people each month, dominating the messaging app market.
Messenger retains 1.2 billion active users, though growth has slowed compared to WhatsApp.
LinkedIn crossed 1 billion members, with nearly 200 million in India alone.
Snapchat maintains 820 million monthly active users, with daily engagement especially high among Gen Z.
Pinterest grew to 500 million monthly active users, fueled by e-commerce integrations and visual search.
X (formerly Twitter) records 660 million monthly active users in 2026, with growth strongest in emerging markets.
Telegram has 950 million monthly active users, continuing its rise as a privacy-focused alternative.
Reddit surpassed 500 million monthly active users, expanding beyond North America into Europe and Asia.
WeChat holds 1.3 billion monthly active users, remaining dominant in China.
Douyin, the Chinese version of TikTok, has 750 million daily active users, separate from TikTok’s global count.
Discord reached 400 million monthly active users, expanding beyond gaming into communities and education.
You Might Also Be Curious About Our 200+ Affiliate Marketing Statistics
Demographic and Audience Insights
62% of global social media users are aged 16–34, making young audiences the dominant force across platforms.
Gen Z spends an average of 3 hours daily on social media, the highest among all age groups.
Millennials make up 33% of all social media users worldwide, driving both e-commerce and influencer engagement.
Boomer adoption has grown to 58%, with Facebook and YouTube as their preferred platforms.
Women account for 54% of Instagram’s global user base, while men dominate LinkedIn with 57%.
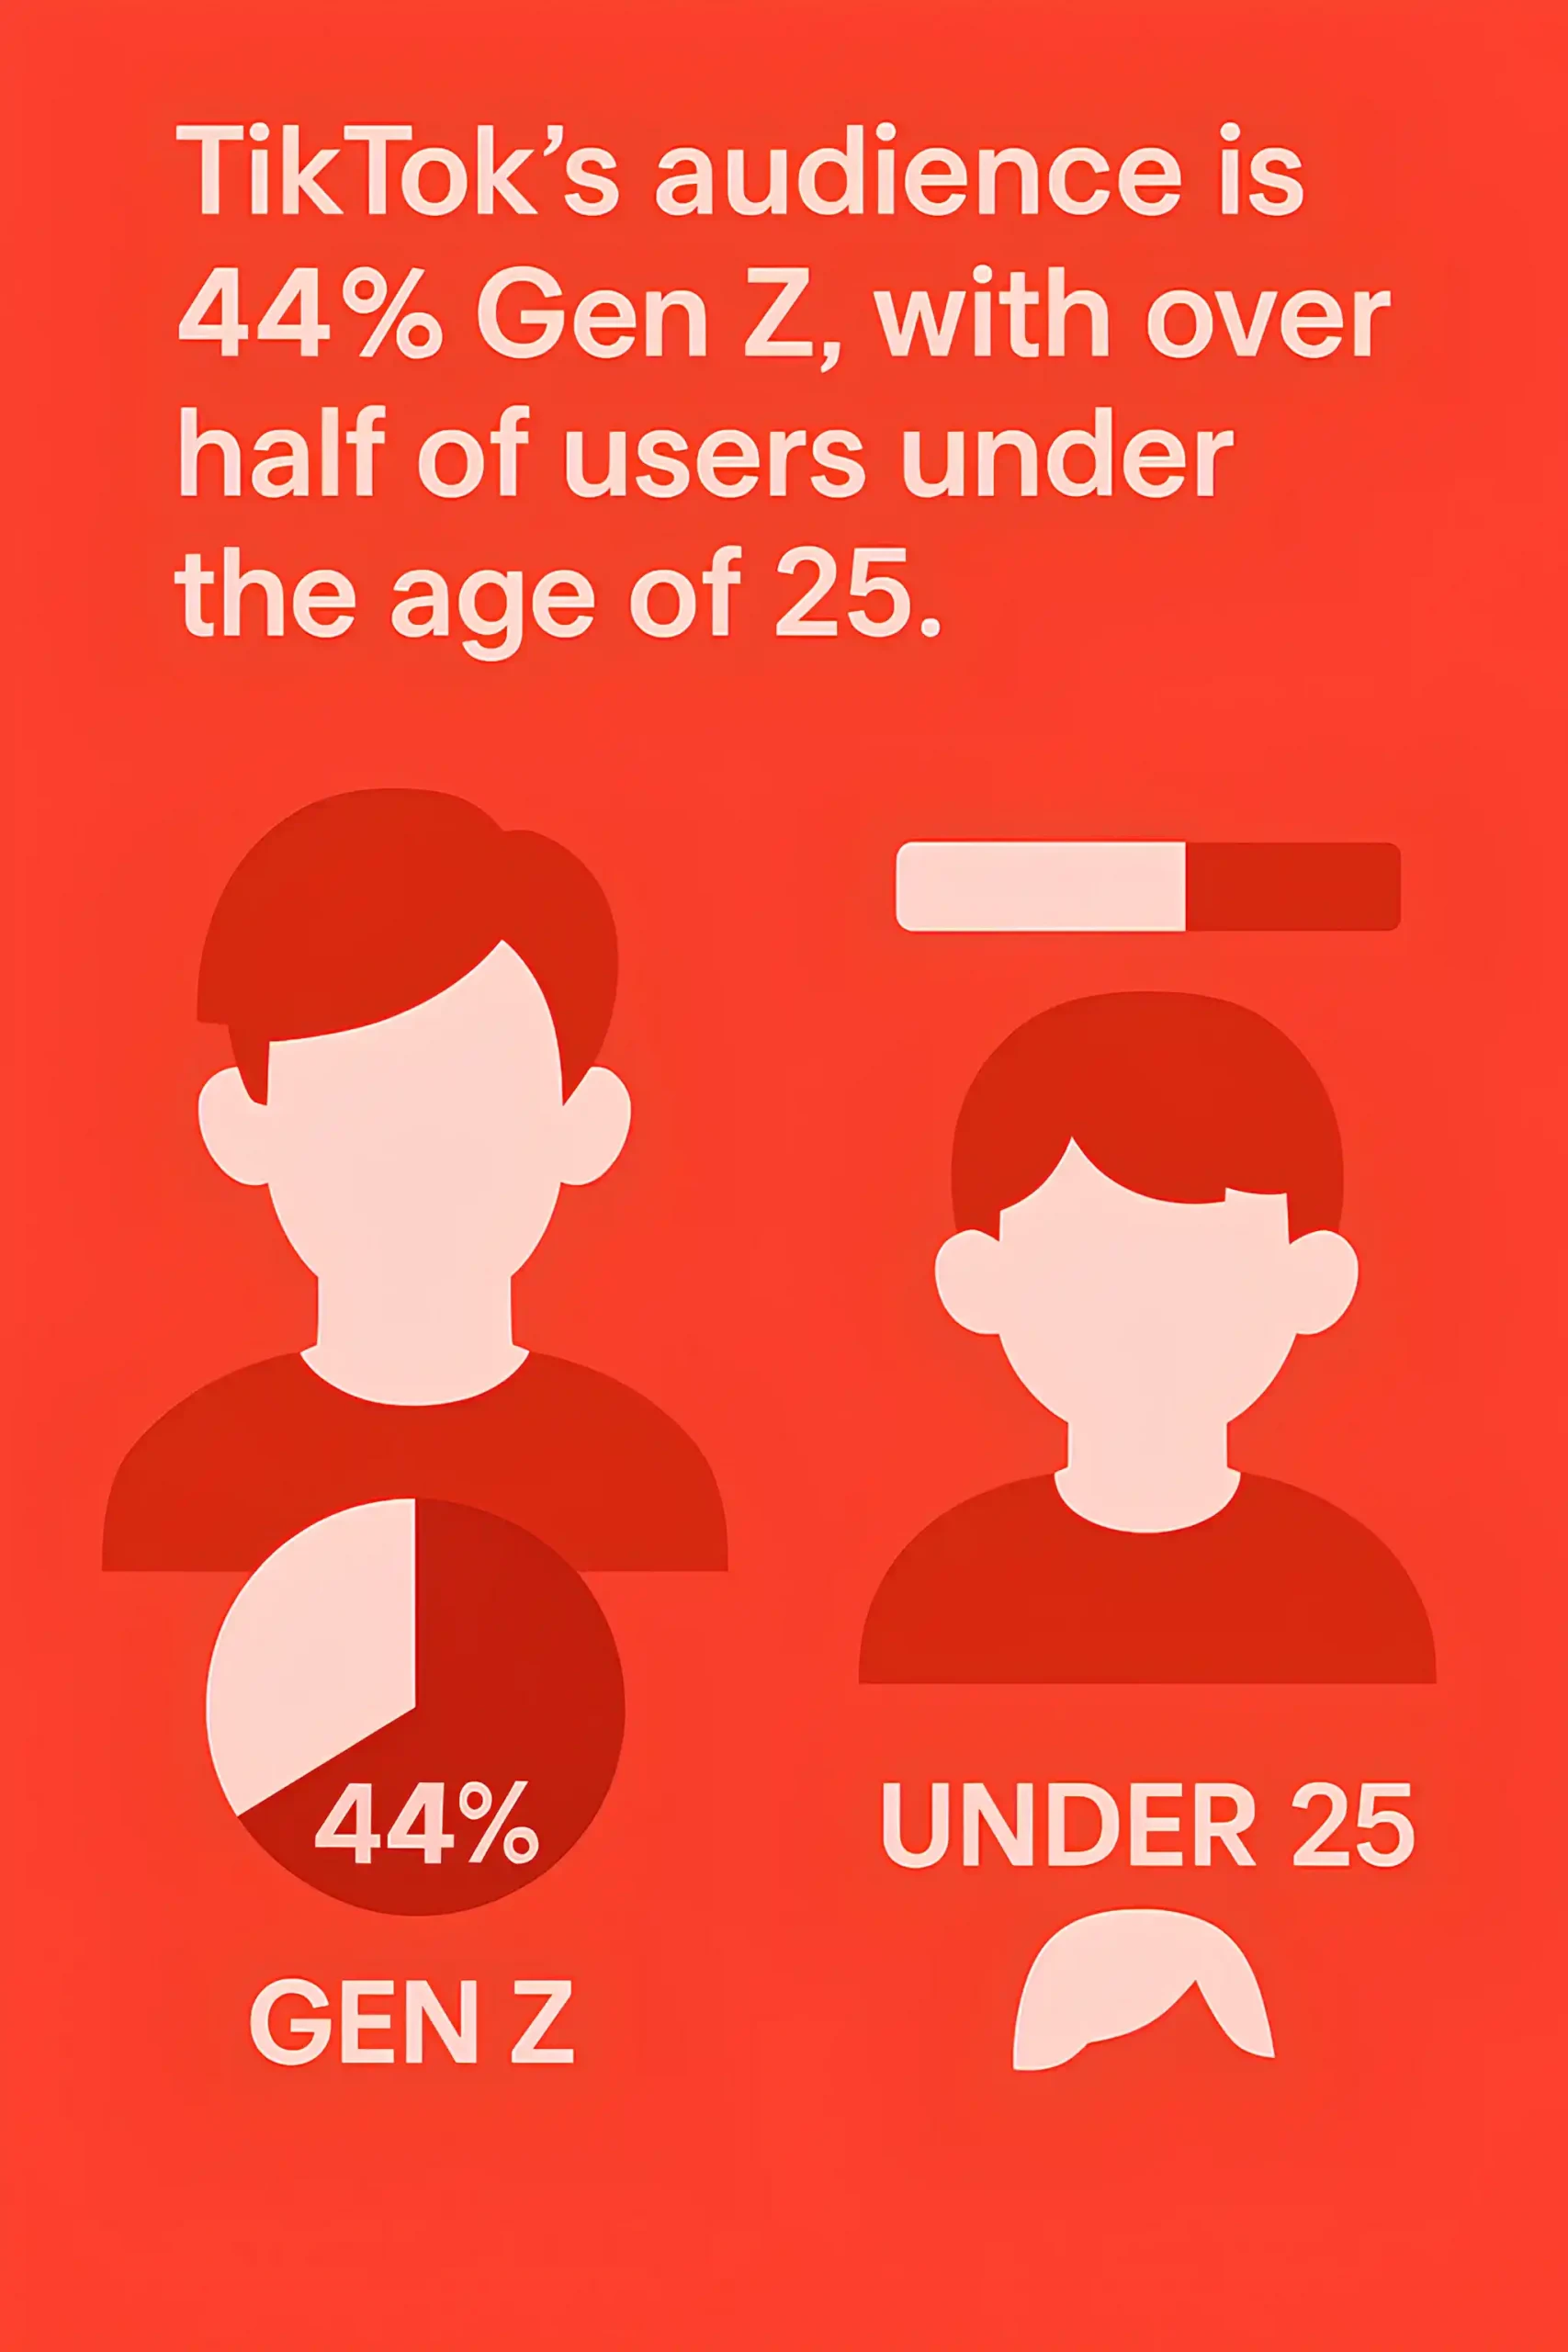
TikTok’s audience is 44% Gen Z, with over half of users under the age of 25.
LinkedIn reports that 60% of its members are decision-makers or senior-level professionals.
Urban residents are 1.7 times more likely to use multiple platforms daily compared to rural users.
Asia-Pacific holds the youngest average social media audience, with a median age of 24.
In North America, 78% of users follow at least one brand account, the highest regional rate.
Latin America has the highest percentage of users engaging with influencer content, at 69%.
Over 70% of global Gen Alpha (ages 10–15) already use at least one social platform, with YouTube leading.
Households earning over $100K annually are 40% more likely to use LinkedIn and Twitter compared to lower-income groups.
Men make up 60% of Reddit’s active user base, while women are the majority on Pinterest at 76%.
41% of global social media users say family and friends remain their top reason for using platforms, followed closely by entertainment and shopping.
With numbers like these, it’s clear why so many brands turn to professional social media marketing services to stay competitive.
Content Consumption Trends
Video content accounts for over 60% of total social media consumption in 2026, making it the most dominant format worldwide.
Short-form video views grew by 36% year-over-year, driven largely by TikTok, Instagram Reels, and YouTube Shorts.
Stories are viewed by more than 1.1 billion people daily across Instagram, Facebook, and WhatsApp.
Live streaming attracts over 37% of social media users monthly, with gaming, shopping, and events leading in popularity.
Posts with images generate 2.3 times more engagement compared to text-only updates.
Audio-based content, including podcasts and live audio rooms, is consumed by 28% of social media users each week.
Over 70% of users prefer content that is personalized and relevant to their interests.
Interactive formats such as polls, quizzes, and shoppable posts have seen a 45% increase in engagement since 2023.
User-generated content influences 79% of purchase decisions, making it one of the most trusted formats.
Over 55% of global consumers say they discover new products through social video.
Carousel posts on Instagram deliver 35% higher engagement rates than single-image posts.
YouTube Shorts now generates more than 70 billion daily views worldwide.
Memes account for nearly 15% of daily social media shares, especially among Gen Z.
Vertical video formats make up 95% of total video consumption on mobile devices.
Over 40% of users report watching social media content while simultaneously using another device, showing strong multi-tasking behavior.
You May Want to Take a Look at Our 100+ Reputation Management Statistics
Engagement and Interaction Metrics
The average social media post engagement rate across platforms in 2026 is 1.8%, with short-form video driving the highest numbers.
TikTok posts generate an average engagement rate of 5.3%, outperforming all other major platforms.
Instagram Reels deliver 35% more engagement than standard video posts.
Facebook’s average engagement rate has dropped to 0.06%, reflecting its shift toward paid distribution.
LinkedIn posts with images or native video receive 2 times more comments compared to text-only updates.
YouTube creators with under 500K subscribers see the highest engagement rates, averaging 4.1% per video.
Twitter (X) averages an engagement rate of 0.04%, the lowest among major networks.
Pinterest pins that include product tags see 20% higher interaction rates.
Reddit posts in niche communities generate 3 times more engagement than those in broad, high-subscriber subreddits.
Snapchat users open the app more than 40 times per day on average, making it one of the most frequently engaged platforms.
Interactive posts such as polls and Q&As drive 28% more engagement than static content.
Brands that reply to comments within 24 hours see a 47% higher engagement rate on future posts.
User mentions of brands on social media grew by 21% in 2026, reflecting rising consumer participation.
Hashtag use on Instagram increases reach by an average of 12%, though oversaturation reduces impact.
Social media contests and giveaways generate engagement rates up to 34%, the highest of any campaign type.
You May Also Be Interested in 80+ Web Design Statistics
Advertising and Paid Media Performance
Global social media ad spend is projected to reach 219 billion dollars in 2026, accounting for nearly one-third of all digital advertising.
Facebook and Instagram together capture over 55% of global social media ad revenue.
TikTok ad revenue is expected to surpass 20 billion dollars in 2026, marking a 35% year-over-year increase.
LinkedIn ads generate the highest average cost per click at 5.26 dollars, but also deliver strong B2B conversion rates.
The average cost per thousand impressions (CPM) across social platforms in 2026 is 9.18 dollars.
Video ads on social media deliver 48% higher engagement rates compared to static image ads.
Shoppable posts drive 32% more click-throughs than standard ad formats.
Instagram Story ads achieve a 0.8% average click-through rate, outperforming feed ads.
Facebook retargeting campaigns deliver conversion rates 70% higher than prospecting campaigns.
Advertisers report an average return of 5.2 dollars for every 1 dollar spent on social media advertising.
YouTube ads reach more than 90% of internet users aged 18–44 each month.
Over 63% of marketers say TikTok delivers the best ROI for influencer-driven paid campaigns.
Pinterest shopping ads generate a 30% lower cost per conversion compared to other platforms.
Snapchat AR ads deliver 2.5 times higher engagement than standard mobile ads.
Twitter (X) ad revenue declined by 14% in 2026, making it the only major platform to shrink in paid media performance.
ROI and Conversion Statistics
Social media marketing delivers an average ROI of 5.2 dollars for every 1 dollar spent in 2026.
Video-based campaigns generate 34% higher conversion rates than static ads across all platforms.
Instagram is the top platform for ROI among B2C brands, with 78% of marketers reporting positive returns.
LinkedIn produces the highest B2B conversion rates, with lead-gen ads averaging a 6.1% conversion rate.
Facebook ads convert at an average of 9.2%, making it the strongest platform for direct-response campaigns.
TikTok drives 28% higher engagement-to-conversion rates compared to Instagram Reels.
Shoppable content delivers 1.7 times more conversions than non-shoppable branded posts.
User-generated content increases conversion rates by 4.6% on average.
Brands that use influencer partnerships report 41% stronger ROI than those relying on paid ads alone.
Social commerce is projected to drive 1.3 trillion dollars in sales globally in 2026.
Email signups from social campaigns convert 24% better when paired with personalized retargeting ads.
Pinterest shoppers have 80% higher average order values compared to Facebook or Instagram shoppers.
Snapchat AR try-on ads boost purchase intent by 25%.
Twitter (X) ads have one of the lowest ROI levels, with only 28% of marketers reporting positive returns.
Over 70% of marketers say measuring ROI from organic social remains their biggest challenge in 2026.
Influencer Marketing Data
The global influencer marketing industry is projected to surpass 24 billion dollars in 2026.
Over 80% of marketers say influencer campaigns deliver stronger ROI than traditional digital ads.
Nano-influencers (1K–10K followers) generate the highest engagement rates at 4.8%.
Micro-influencers (10K–100K followers) drive 60% higher conversion rates compared to celebrity influencers.
Instagram remains the leading influencer platform, used by 72% of brands for collaborations.
TikTok influencer campaigns see average engagement rates of 5.7%, the highest across social networks.
YouTube influencers achieve the longest-lasting impact, with 62% of viewers recalling brand mentions after 30 days.
The average brand spends 19% of its social media budget on influencer partnerships.
Influencer-driven content is 2.4 times more trusted than branded content.
Gen Z is 46% more likely to buy from a brand after seeing influencer content.
Nearly 65% of consumers say they prefer product recommendations from influencers over traditional ads.
B2B influencer marketing is growing, with LinkedIn creators seeing a 35% increase in brand collaborations.
Fashion, beauty, and lifestyle account for over 40% of influencer marketing spend in 2026.
Influencer fraud still costs brands nearly 1.3 billion dollars annually, despite improved verification tools.
70% of marketers plan to increase their influencer budgets in 2026, prioritizing authenticity and niche audiences.
Video and Short-Form Content Statistics
Short-form video accounts for 43% of all social media content consumed in 2026, making it the fastest-growing format.
TikTok, Instagram Reels, and YouTube Shorts collectively generate more than 120 billion daily views.
Reels drive 22% higher engagement compared to other Instagram post types.
TikTok users spend an average of 55 minutes daily on the app, with 80% of that time on short-form video.
YouTube Shorts now surpasses 70 billion daily views, doubling its volume since 2023.
Short-form video ads deliver 1.6 times higher ROI compared to static ads.
Brands that post video content at least twice per week see 41% higher engagement rates.
Live video is watched by 37% of social users monthly, with shopping streams driving the highest conversion rates.
Vertical video accounts for 95% of all mobile video consumption.
Over 60% of Gen Z and Millennials prefer short videos when learning about products or services.
Instagram Stories are viewed by more than 1.1 billion users daily.
LinkedIn native videos generate 3 times more engagement than text-only posts.
Facebook video posts earn twice the engagement of non-video posts.
User-generated video content is trusted 50% more than brand-created video ads.
Over 55% of consumers report purchasing after watching a brand video on social media.
E-commerce and Social Shopping Insights
Global social commerce sales are projected to reach 1.3 trillion dollars in 2026, growing at nearly 20% year over year.
72% of consumers say they have purchased a product directly through a social media platform.
Instagram Shopping influences 44% of weekly users’ buying decisions.
TikTok Shop sales are expected to exceed 60 billion dollars globally in 2026.
Pinterest users spend 80% more per order compared to shoppers on other social platforms.
Facebook Marketplace attracts over 1 billion monthly visitors worldwide.
Shoppable video ads deliver conversion rates 1.7 times higher than static image ads.
60% of Gen Z consumers say they prefer discovering products through TikTok or Instagram over search engines.
Live shopping events on social media convert at rates as high as 30%.
YouTube Shopping integrates with 100K+ brands, making it a leading platform for video-driven e-commerce.
43% of global online shoppers use social media as their primary product research tool.
In-app checkout features reduce cart abandonment rates by 22%.
Over 50% of brands report that social commerce generates higher ROI than traditional e-commerce channels.
Snapchat AR try-on features increase purchase intent by 25%.
WeChat remains the global leader in social shopping, processing more than 400 billion dollars in annual transactions.
Emerging Platform and Trend Statistics
BeReal surpassed 100 million monthly active users in 2026, with daily photo-sharing growing steadily among Gen Z.
Threads reached 250 million monthly active users, positioning itself as a serious alternative to Twitter (X).
Clubhouse usage declined by 60% since its peak, but niche audio communities remain active.
Discord expanded to 400 million monthly active users, with brand-led communities increasing by 35%.
Twitch maintains over 35 million daily active viewers, with non-gaming categories now accounting for 28% of streams.
Social search is rising, with 47% of Gen Z using TikTok and Instagram as primary search tools instead of Google.
AI-driven content recommendations now influence over 80% of user feed time across major platforms.
Augmented reality features are used by 1.4 billion people monthly, mostly through Snapchat, Instagram, and TikTok.
Voice search integration in social platforms has grown by 22% year over year.
Blockchain-based social platforms exceeded 40 million monthly active users, highlighting demand for decentralized networks.
Over 60% of marketers are investing in social commerce integrations with emerging platforms beyond the big five.
VR-based social spaces, including Meta Horizon Worlds, attract 25 million monthly active users in 2026.
Social platforms with in-app AI assistants see 30% higher engagement, as users adopt chat-based discovery and recommendations.
Digital collectibles and NFTs traded through social platforms reached 6 billion dollars in 2026, despite market volatility.
Ephemeral content formats such as Stories still attract over 2 billion daily active viewers, proving staying power despite predictions of decline.
Industry-Specific Social Media Data
Over 75% of retail brands say social media is their top driver of online sales, surpassing search and email in 2026.
In the travel industry, 68% of bookings are influenced by social media content, particularly Instagram and TikTok.
Healthcare-related content on YouTube generates over 2 billion monthly views, making it the leading platform for medical information.
Financial services brands see 45% higher engagement on LinkedIn compared to other platforms.
Real estate listings promoted on social media convert 2.4 times faster than those on traditional listing sites.
Fashion and beauty account for 40% of all influencer marketing spend in 2026.
Food and beverage brands see the highest engagement on TikTok, averaging 6.2% per post.
Education-focused content on Instagram and TikTok grew by 32% year over year.
Automotive brands report 60% of buyers research vehicles on YouTube before visiting a dealership.
B2B brands generate 80% of their leads through LinkedIn and Twitter (X).
Nonprofit organizations see 3 times higher donation conversion rates when campaigns are run on Facebook and Instagram.
Gaming content drives 20% of all live-streaming hours on Twitch, with strong cross-promotion on Discord.
Hospitality brands report 72% of travelers choose destinations based on social media inspiration.
Technology companies use Twitter (X) for product launches, with engagement spikes up to 300% during announcement weeks.
Fitness influencers account for 65% of brand-sponsored TikTok challenges, highlighting health and lifestyle dominance in social media campaigns.
Future Outlook and Forecasts
Global social media users are expected to surpass 6 billion by 2027, cementing social platforms as the primary digital ecosystem.
Social commerce sales are forecasted to reach 2 trillion dollars annually by 2028.
Short-form video is projected to make up 70% of all social media content consumed by 2030.
AI-generated content will account for 25% of branded social posts by 2026, as automation tools scale.
Metaverse-based social experiences are predicted to attract over 100 million active users by 2027.
Ad spend on social media will exceed 300 billion dollars globally by 2027, representing 40% of digital advertising budgets.
Augmented reality adoption in social apps is expected to reach 2 billion users by 2026.
Voice and social search are predicted to replace 30% of traditional search queries by 2030.
Influencer marketing spend is projected to grow 15% annually, surpassing 40 billion dollars by 2030.
Brands that integrate AI-powered personalization in social campaigns will see engagement rates increase by up to 35%.
By 2028, 50% of online product discovery will occur directly within social platforms.
Blockchain-based decentralized social networks could reach 200 million monthly users by 2030.
Live shopping is forecasted to make up 20% of all e-commerce transactions in Asia by 2027.
Sustainability-focused content is expected to dominate brand messaging, with 65% of consumers preferring eco-conscious campaigns by 2026.
Social platforms are projected to become the leading channel for customer service, with over 70% of businesses using them as primary support hubs by 2028.
Wrapping Up
Social media has become the foundation of how brands connect, sell, and build influence. These 200+ statistics highlight not only where audiences spend their time but also which strategies deliver measurable results.
The platforms will continue to develop, but the opportunity remains constant. Those who track the numbers, test against them, and adapt with precision will stay ahead of both competitors and consumer expectations.
Let this report serve as a reference point for shaping campaigns that are grounded in evidence and built for growth.