
A few years ago, launching a podcast felt like a brand experiment. Publish a few episodes and hope the audience enjoys. The rules changed: shows compete in algorithm feeds, clips spread faster than full episodes, and listeners move from earbuds to living room screens without breaking the habit. The upside is bigger, and so is the noise.
Our updated data set on NEWMEDIA.COM puts together more than 150 podcast statistics on listeners, growth, advertising, and trend shifts across platforms and formats.
So, apply the data to pressure test your assumptions, prioritize the right shows and formats, set smarter pricing and budget ranges, and tighten reporting on what is actually driving results.
Podcast Growth Trends & Market Forecasts
Podcast ad revenue growth often settles into a 5% to 15% annual range in mature markets, and a lot of that stabilization comes down to how brands buy and measure audio inventory through programmatic advertising.
Forward-looking forecasts for major markets commonly point to high single-digit annual growth through 2025.
Podcast listening penetration often holds steady or inches up by 1 to 3 points year over year once a market matures.
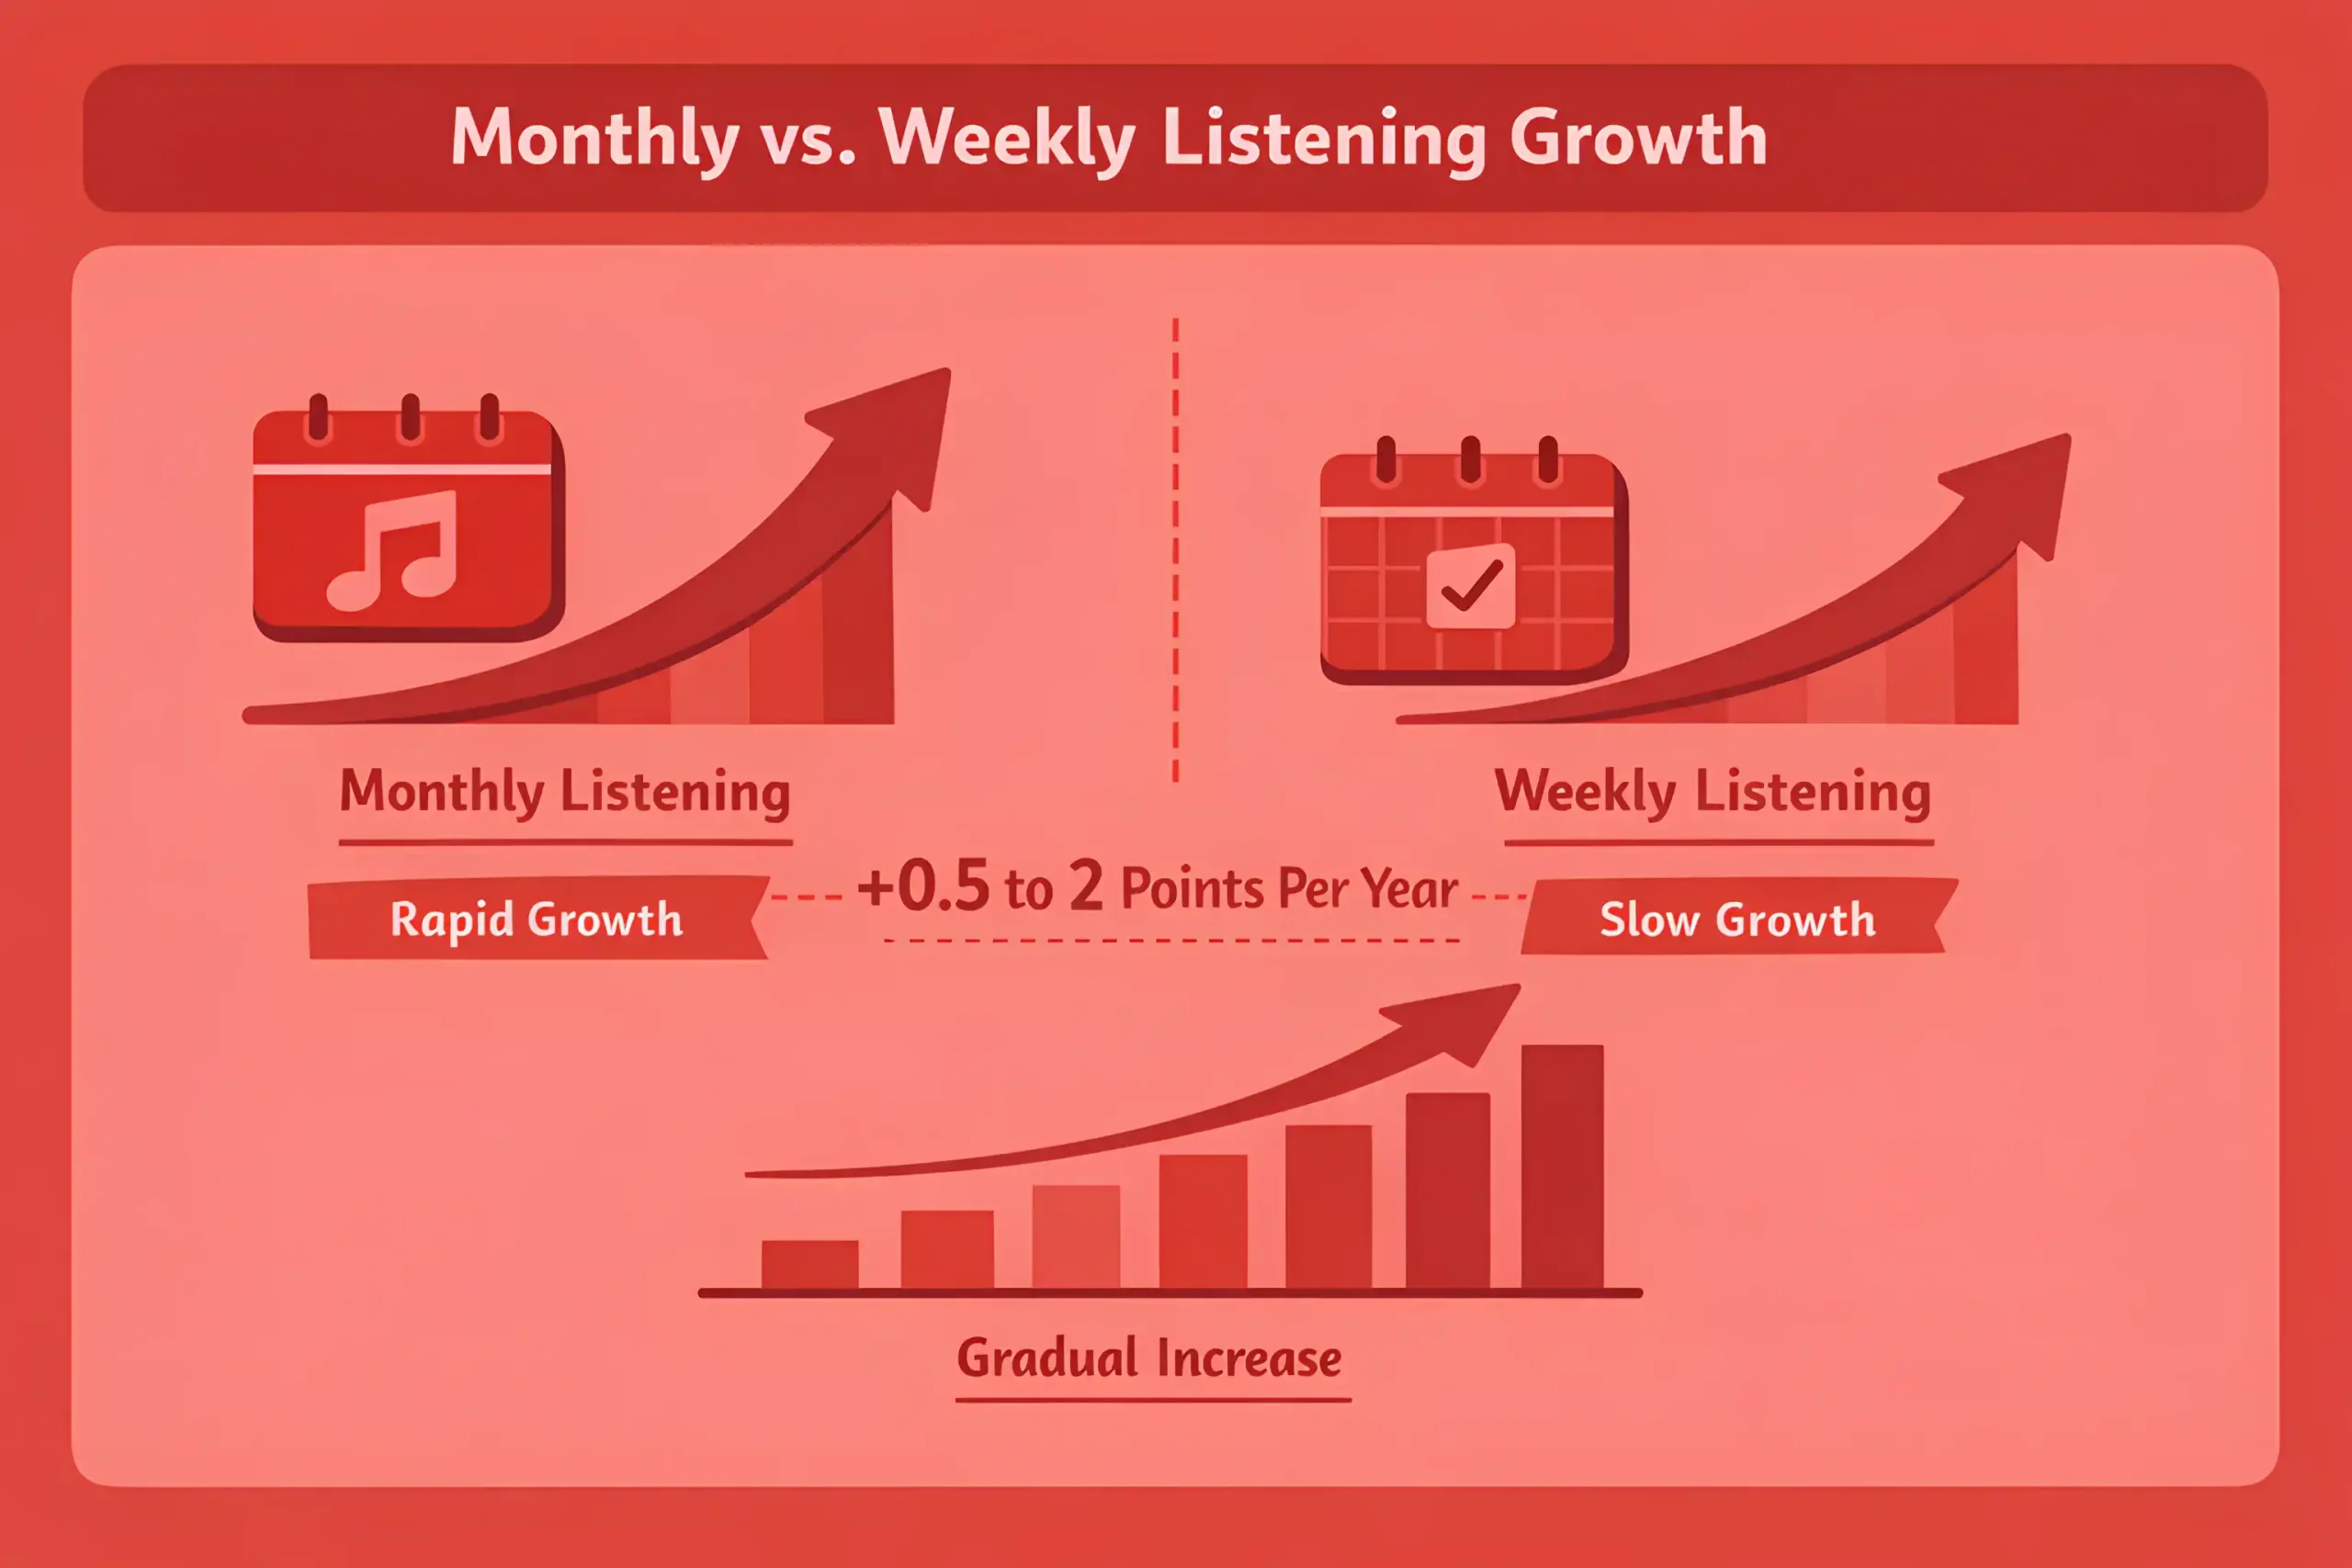
Weekly listening typically grows more slowly than monthly listening, often by 0.5 to 2 points per year.
Total time spent with podcasts tends to grow faster than listener count, commonly 5% to 20% per year in growing markets
Video podcasts are usually the fastest growing format slice, with audience share often rising 5 to 15 points over 2 to 3 years.
Platforms with strong recommendation feeds often capture 30% to 60% of new show discovery, and short clips can drive first exposure, which mirrors the shift you see in broader social media marketing.
Short clips frequently drive first exposure, and can account for 20% to 40% of new audience acquisition for video shows.
The show supply keeps expanding, but active show growth often slows to 5% to 12% per year as churn stays high.
Many podcasts still publish inconsistently, with 30% to 60% going quiet within 6 to 12 months of launch.
Network consolidation often increases, with top networks controlling 20% to 40% of premium ad inventory in a market.
Brand budgets tend to take a larger share over time, often rising 5 to 15 points as measurement improves.
Direct response remains important, but performance can plateau without creative refresh, often after 4 to 8 weeks for high-frequency placements.
Q4 seasonality is strong, and a typical year sees 25% to 35% of ad spend land in the final quarter.
CPMs for host read placements commonly sit in the $18 to $45 range, with premium shows pushing higher.
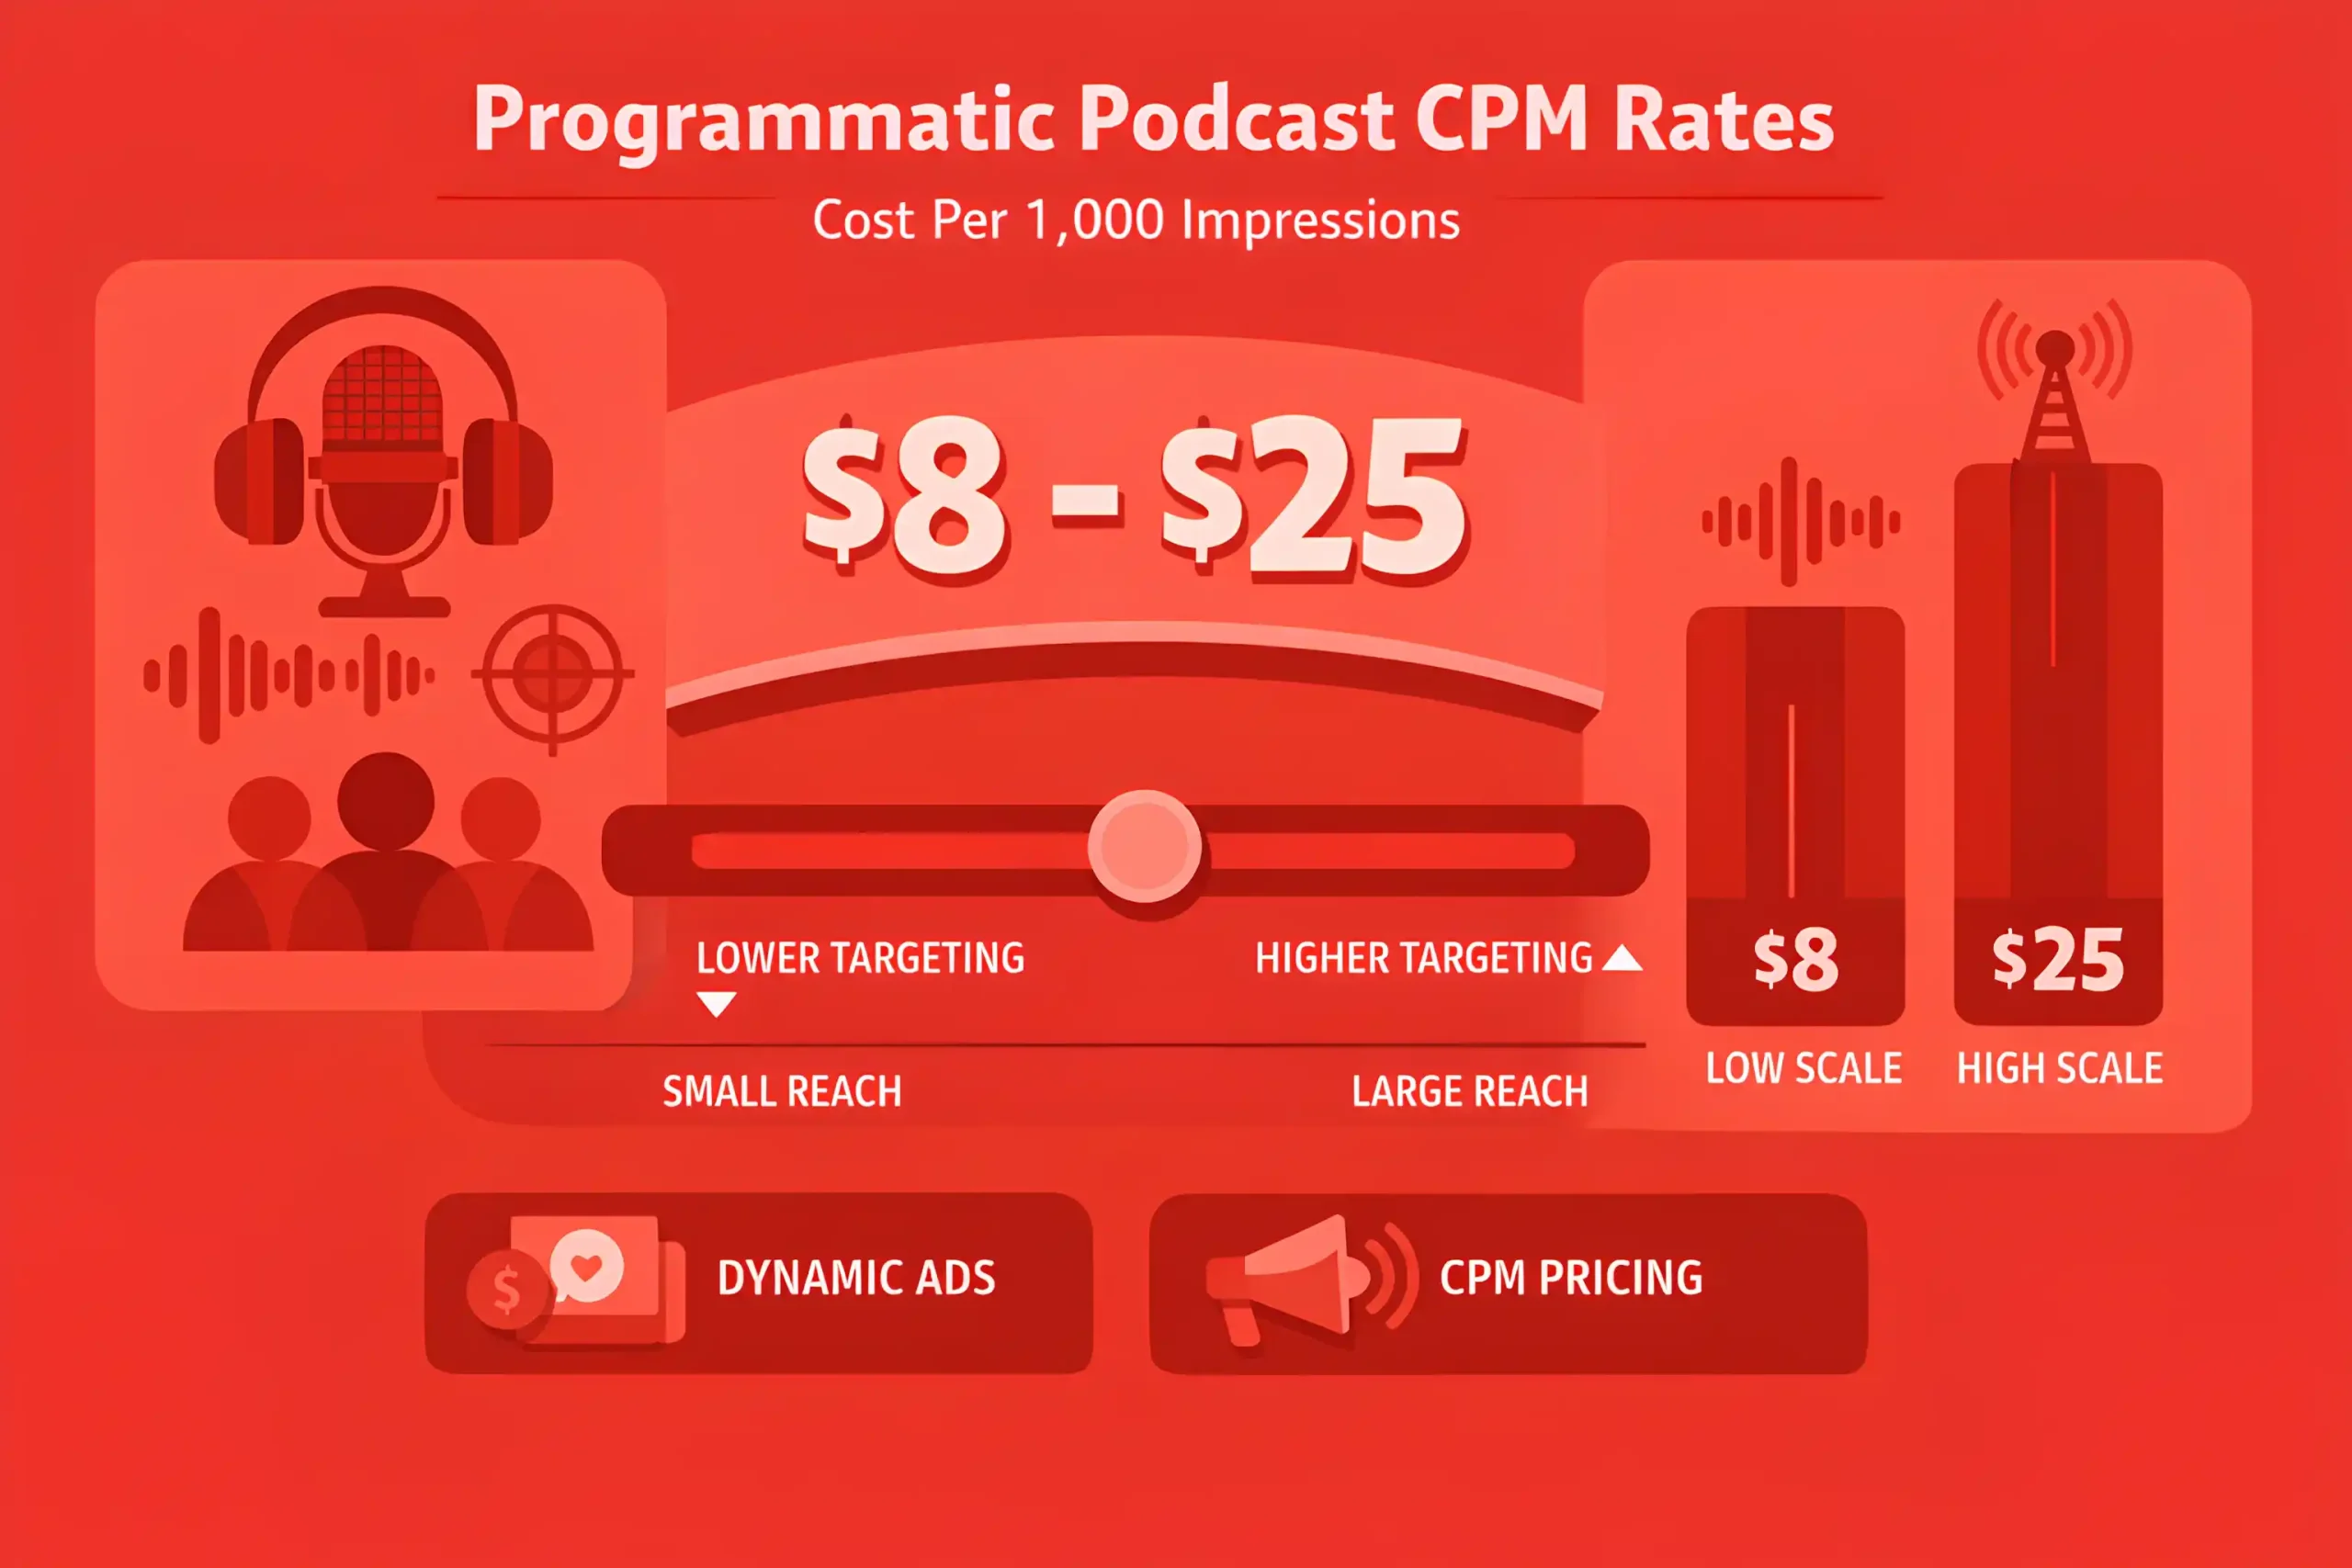
Programmatic or dynamically inserted inventory often prices lower, commonly $8 to $25 CPM, depending on targeting and scale.
Subscription or premium feeds usually represent a smaller slice, often 5% to 20% of total revenue for creator businesses.
Global growth often comes from newer markets, where weekly listening can rise 2 to 6 points per year off a smaller base.
The biggest forecast swing factor is platform behavior, since a discovery shift can change growth curves within one quarter.
Related reading: 100+ AI Marketing Statistics
Podcast Listening Habits & Consumption Behavior
Weekly listeners often consume podcasts on 2 to 4 days per week, with heavy listeners reaching 5 to 7 days.
A typical listening session runs 20 to 45 minutes, with longer sessions common for news, comedy, and interviews.
Average episode completion rates often fall in the 60% to 85% range, driven by show format and pacing.
Completion tends to drop for episodes longer than 60 minutes, unless the audience is highly loyal.
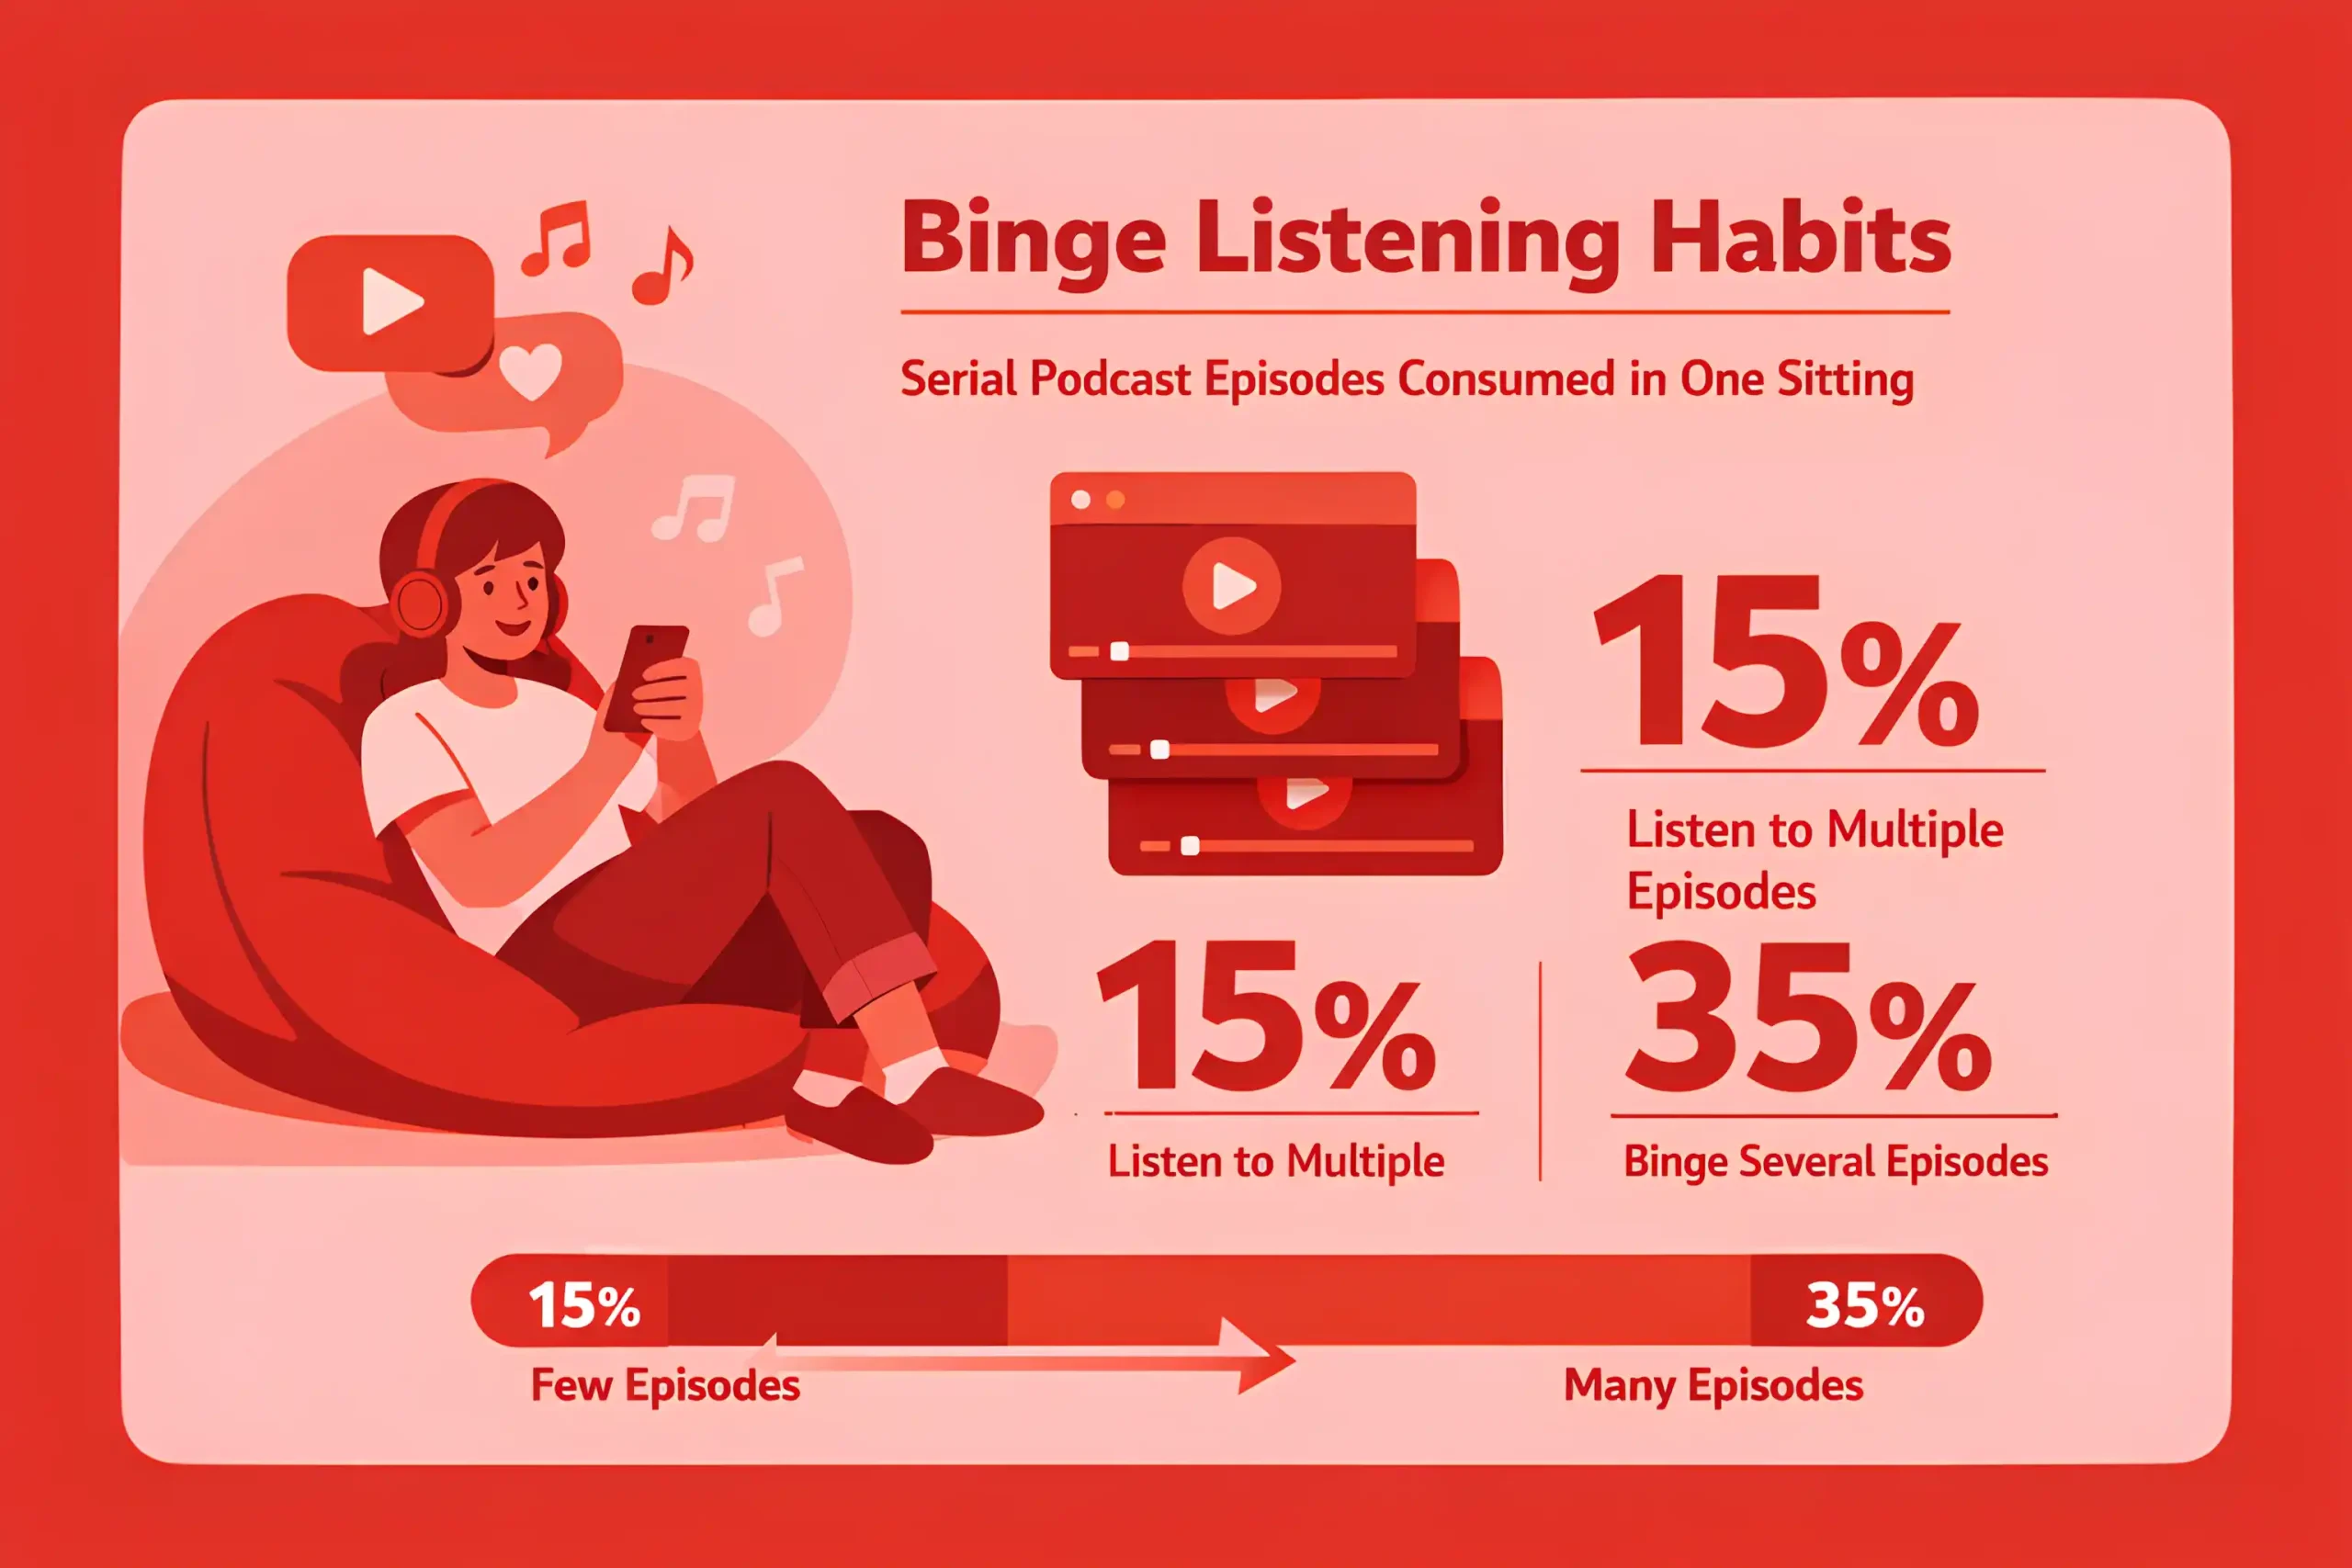
Binge behavior is common, with 15% to 35% of listeners playing more than one episode in a single session.
Most listening happens during routines, and commuting plus errands often account for 30% to 55% of total time.
At home, listening frequently represents 25% to 45% of consumption, especially for longer shows.
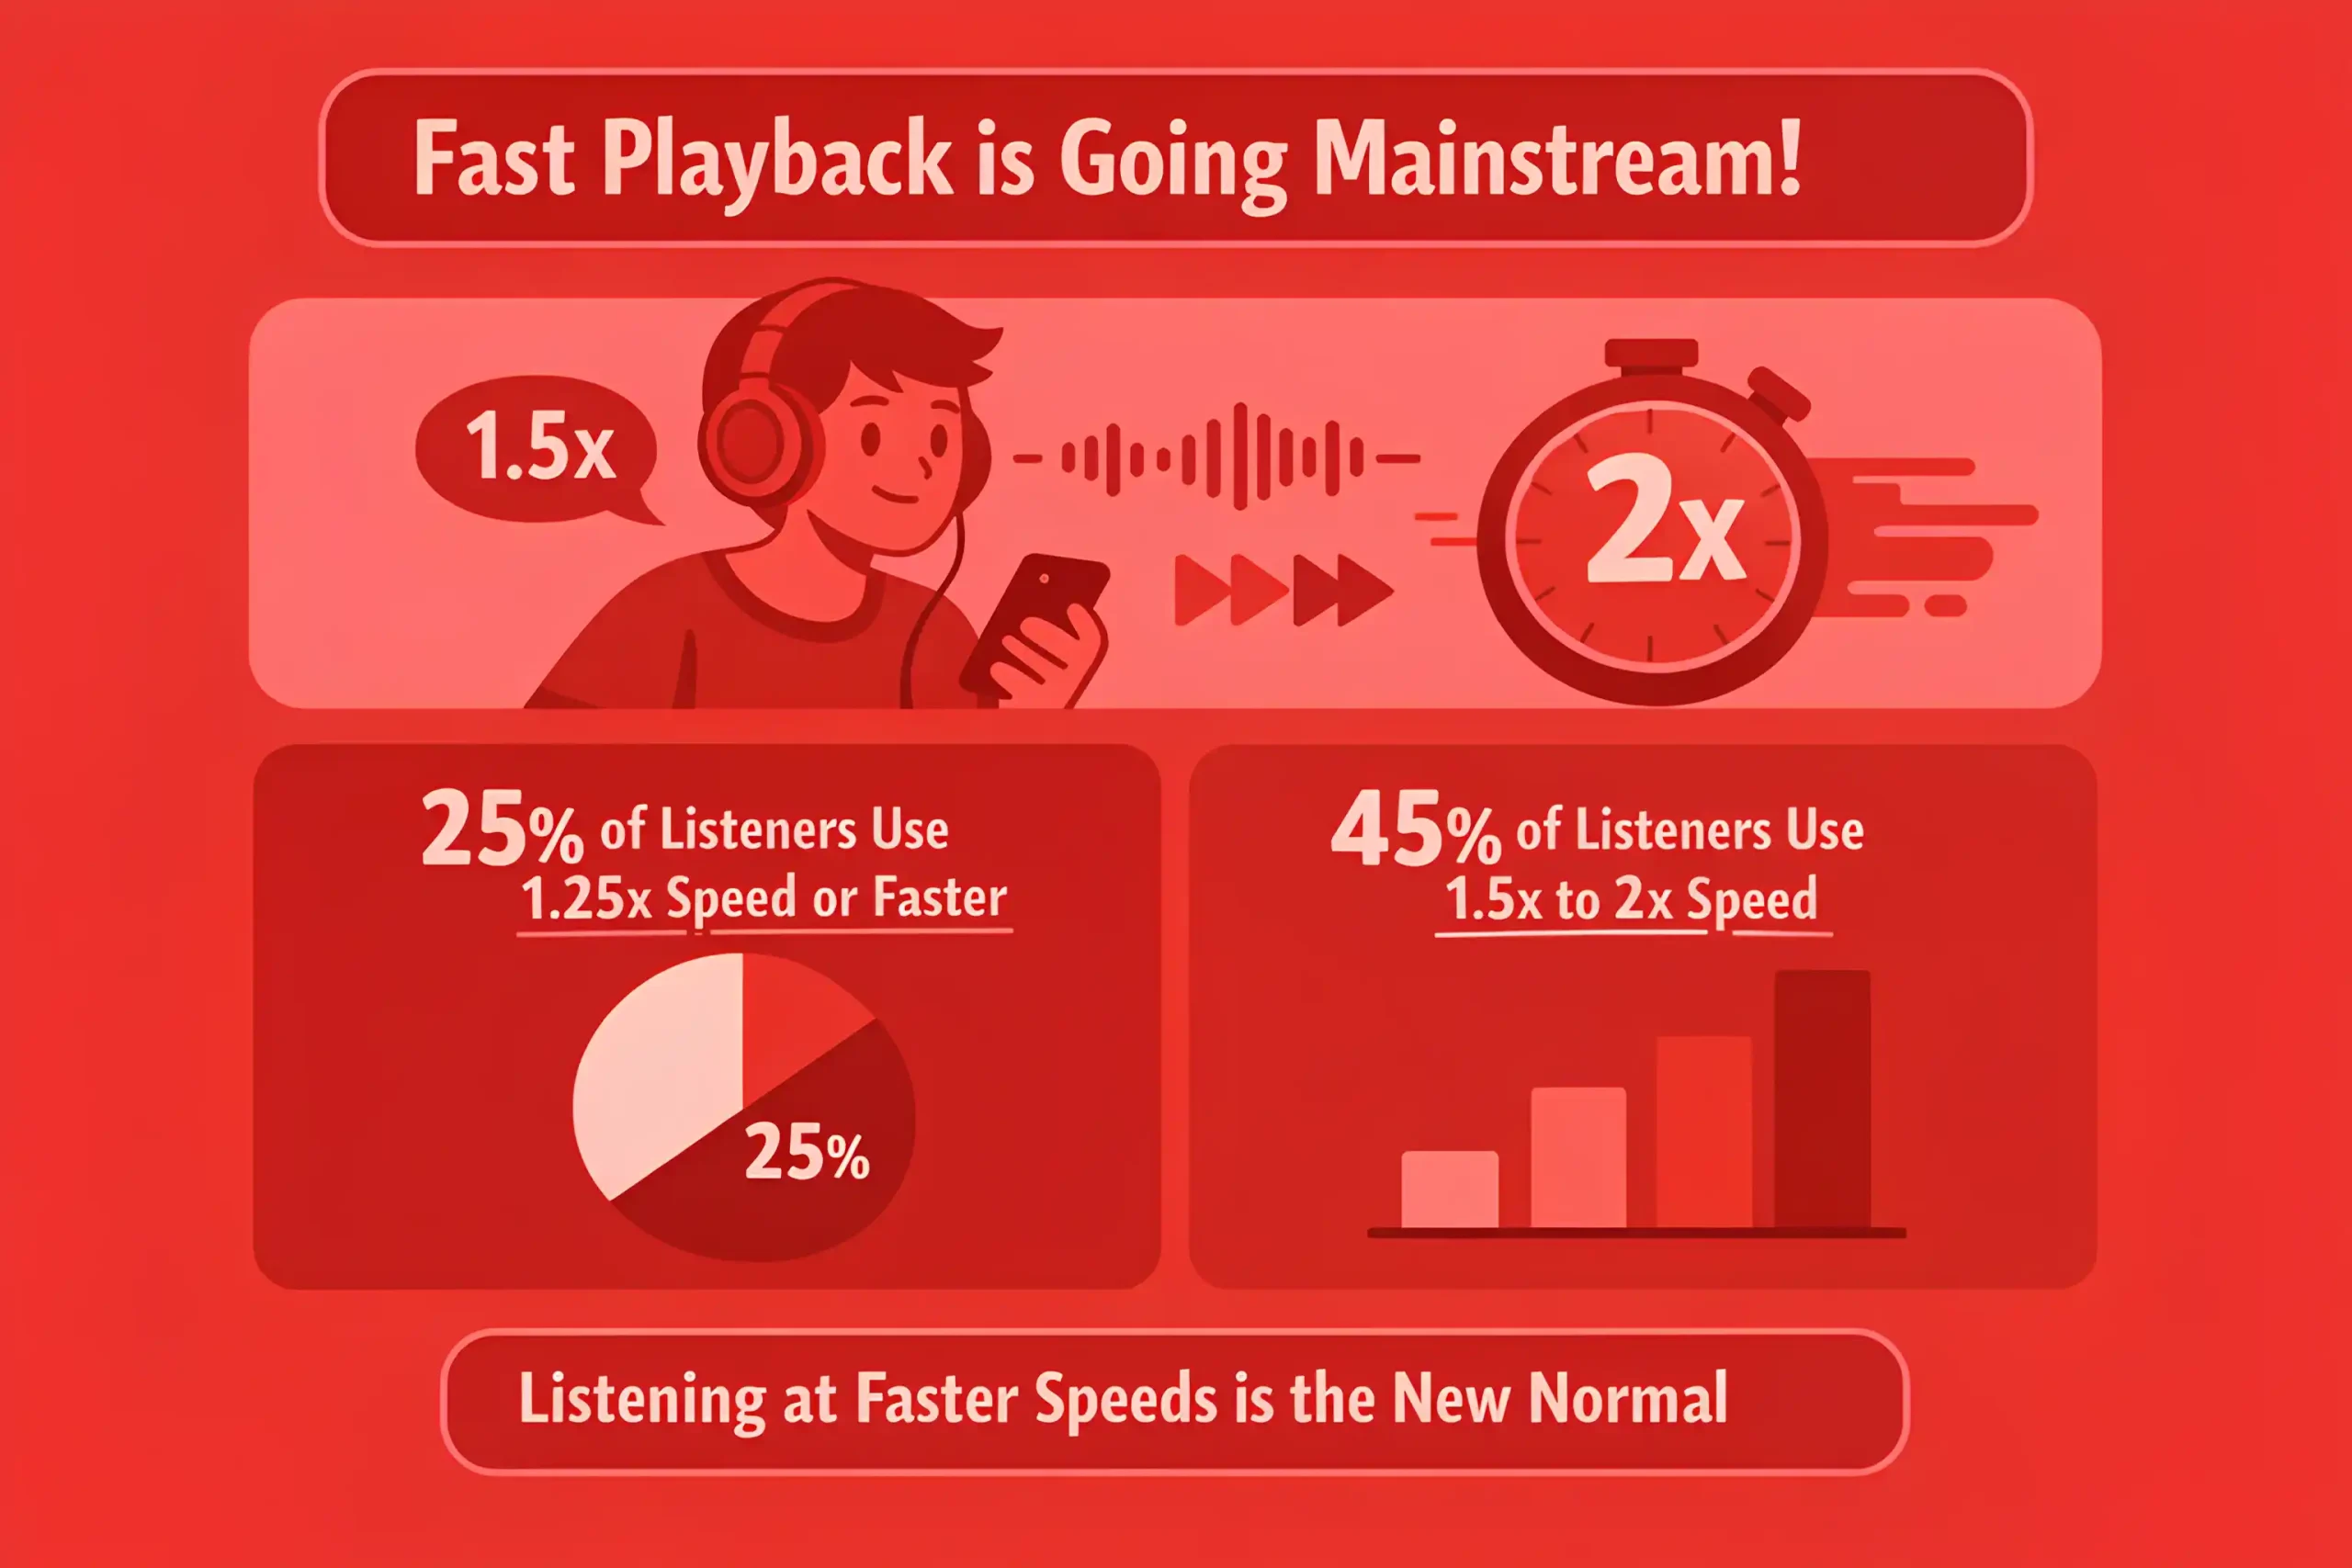
Listening at faster speeds is mainstream, with 25% to 45% of listeners using 1.25x to 2x playback at least sometimes.
Mobile remains the primary device for first plays, commonly 55% to 75% of starts, which aligns with the mobile-first behavior covered in web design statistics.
Connected TV and desktop shares rise for video shows, often reaching 15% to 35% of starts in those audiences.
Discovery often concentrates in a few channels, with platform recommendations and search driving 30% to 60% of new show starts.
Social clips and short videos often drive first exposure, contributing 20% to 40% of new audience growth for video-friendly shows.
Follow or subscribe rates after a first listen commonly land around 10% to 25% for general audiences.
Shows with strong openings can push follow rates to 25% to 40% within the first two episodes.
Ad skipping is common on dynamically inserted placements, with skip rates often 20% to 45% when controls are available.
Host-read ads usually retain attention better, often reducing skipping by 10% to 25% compared to standard inserts.
Drop-off risk is highest early, and many episodes lose 10% to 25% of listeners in the first five minutes, a reminder that pacing and creative testing matter across formats in performance marketing.
Long back catalogs matter, and evergreen shows often see 30% to 60% of downloads coming from older episodes.
Listener sharing is meaningful but not universal, with 5% to 15% sharing an episode in a given month.
Ratings and reviews are low-frequency actions, often completed by 1% to 5% of active listeners without prompting.
Interesting to read: 200+ Social Media Marketing Statistics Every Marketer Should See (2026 Data)
Podcast Discovery & Top Platforms (Search, Social, YouTube, Spotify, Apple)
Platform recommendations and in-app search often drive 30% to 60% of first-time show discovery, which reflects the broader channel concentration trends in digital marketing.
Social discovery typically contributes 10% to 30% of new listeners, and it skews higher for creator shows with a strong clip strategy.
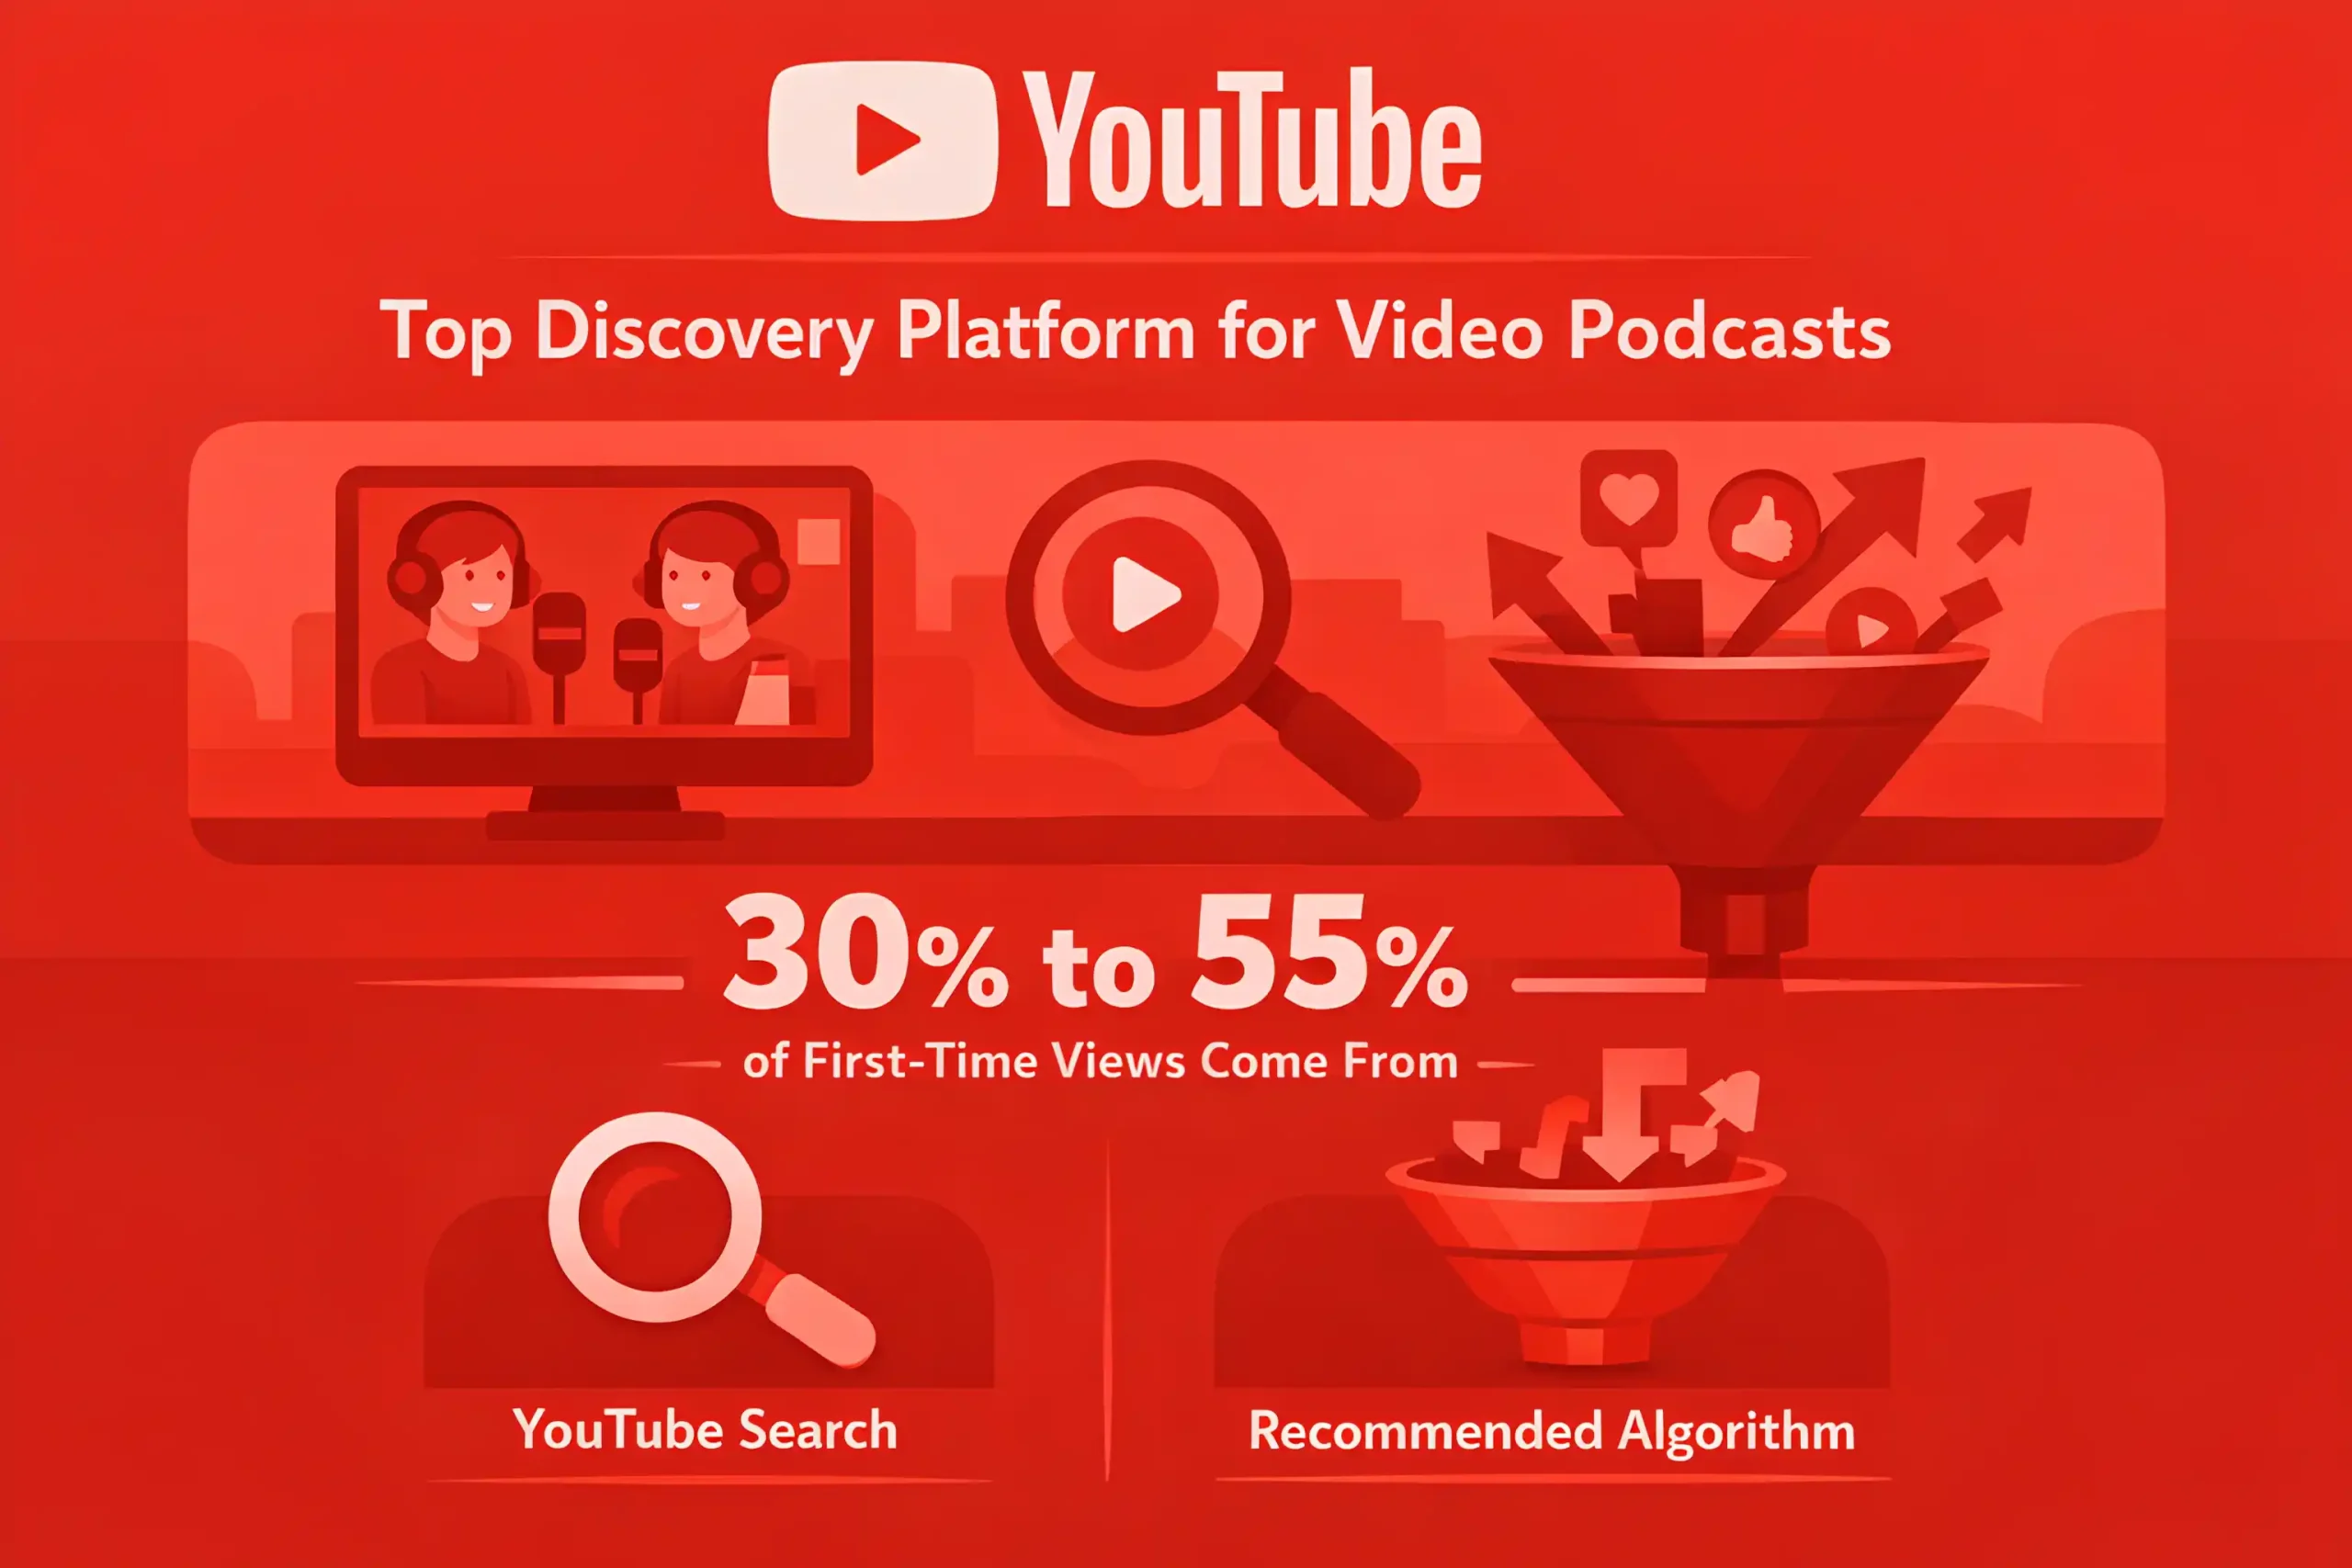
YouTube often becomes the top discovery engine for video-first podcasts, with 30% to 55% of first exposures coming from the algorithm or search.
Spotify discovery tends to lean on recommendations and playlists, often accounting for 20% to 45% of new starts for shows with consistent release cadence.
Apple Podcasts often over-indexes on loyal audio listeners, and it can represent 15% to 35% of total listening for traditional RSS-based distribution.
Cross-platform behavior is normal, with 35% to 60% of listeners using more than one app in a month.
Switching platforms is common when listeners follow a show, and 20% to 40% will move if the show promotes a new primary channel.
Short clips can be a major funnel, often generating 20% to 40% of new audience acquisition for video-friendly shows.
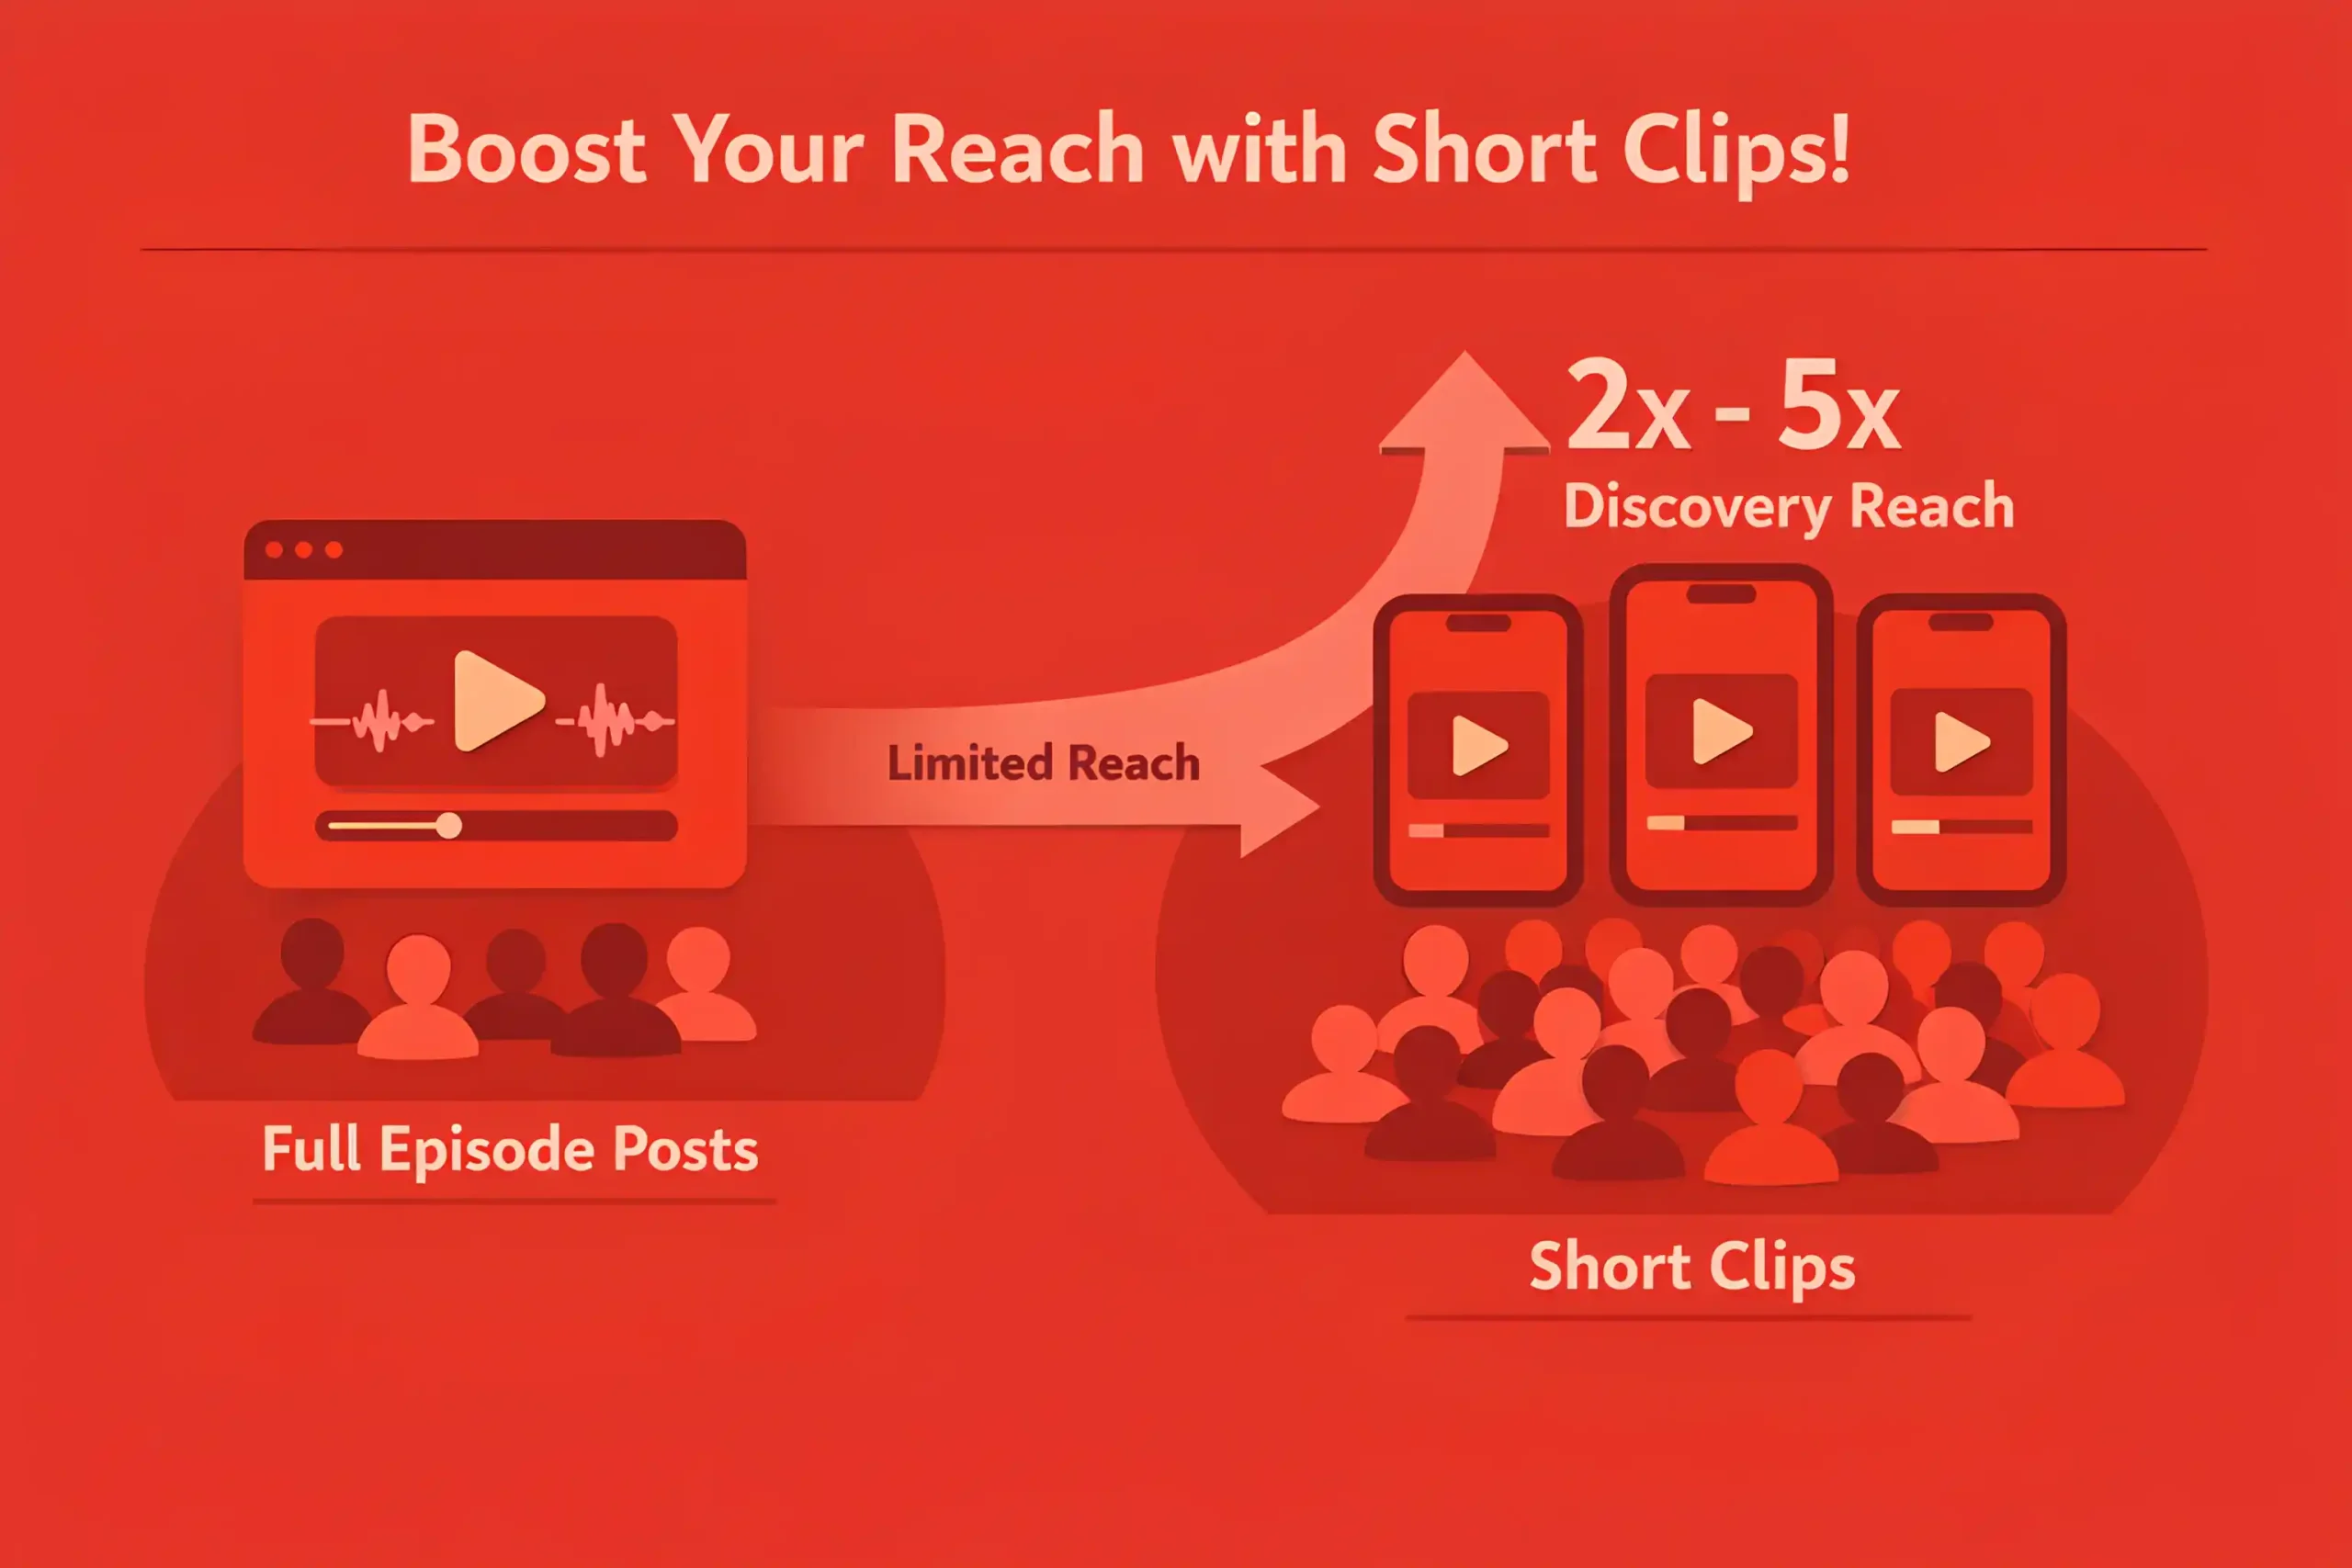
A strong clip program can increase discovery reach 2x to 5x compared to full episode posts alone.
Search intent is highly episodic, and topical episodes often get 30% to 70% of their lifetime discovery in the first 7 to 14 days.
Evergreen episodes have longer tails and can keep pulling discovery for 6 to 18 months if topics stay relevant.
Show titles and episode naming matter for search, and clear intent phrasing often improves clicks by 10% to 25%, the same principle behind strong SEO.
Thumbnails and first seconds matter more on YouTube, where drop off within 30 seconds can be 20% to 40% if the hook is weak.
Spotify and Apple follow rates after first exposure often fall around 10% to 25%, and strong shows can push 25% to 40%.
Notification-driven listening is meaningful for loyal audiences, with 15% to 35% of plays coming within 24 hours of a new episode drop.
For many shows, the top 3 to 5 platforms account for 80% to 95% of consumption, even if clips are posted everywhere.
Ratings and reviews rarely drive discovery directly, but social proof can improve conversion by 5% to 15%.
Paid boosts can accelerate initial traction, but many shows see diminishing returns after 2 to 4 weeks without organic sharing, which mirrors the plateau effect teams manage through PPC management.
You might also find useful: 100+ Email Marketing Statistics
Podcast Ads, Sponsorships & Monetization Benchmarks
Host-read sponsorship CPMs commonly sit in the $18 to $45 range, with premium shows pushing $50 to $100+.
Preroll CPMs often price lower than mid-roll, with a typical gap of 20% to 40%.
Mid-roll placements usually command the highest rates, often 1.2x to 2x the preroll CPM.
Post-roll inventory tends to be discounted, commonly 30% to 60% below mid-roll pricing.
Dynamically inserted or programmatic podcast CPMs often land around $8 to $25, depending on targeting and scale.
Video podcast sponsorship packages are often priced based on blended value, with CPM equivalents commonly $15 to $40 when YouTube views are included.
A typical show monetization mix often includes 60% to 85% sponsorship revenue and 15% to 40% from subscriptions, affiliates, or products.
Direct response advertisers often measure success by promo code or vanity URL use, and response rates can vary widely from 0.1% to 2%.
For strong host fit offers, response can reach 2% to 5%, especially with clear incentives.
Brand lift-focused buys often accept lower immediate response, aiming for reach and frequency instead of clicks.
Q4 seasonality is strong, and many networks see 25% to 35% of annual spend land in the final quarter, so teams often map spend timing inside their marketing strategy.
Ad load is still a tradeoff, and many shows keep it around 2 to 6 ad spots per episode to avoid churn.
Higher ad loads can raise revenue, but can increase drop off by 5% to 20% if pacing is poor.
Host-read ads often retain attention better, reducing skip behavior by 10% to 25% compared to standard inserts.
Category performance varies, but business, finance, and tech often command higher CPMs by 10% to 30% due to higher LTV audiences.
Small shows typically monetize through direct deals once they reach 5,000 to 20,000 downloads per episode, depending on the niche.
Networks usually prioritize scaled inventory, and buying minimums often start around 50,000 to 250,000 impressions per flight.
Makegoods and under delivery are common, and campaigns often plan a buffer of 5% to 15% on delivered impressions.
Subscription offerings often convert 0.5% to 3% of active listeners, and strong communities can reach 3% to 8%.
Live events and merch can be meaningful, with creator businesses often seeing 5% to 20% of revenue from these lines.
Related article: 250+ Digital Marketing Statistics
Podcast Content Trends & Popular Genres
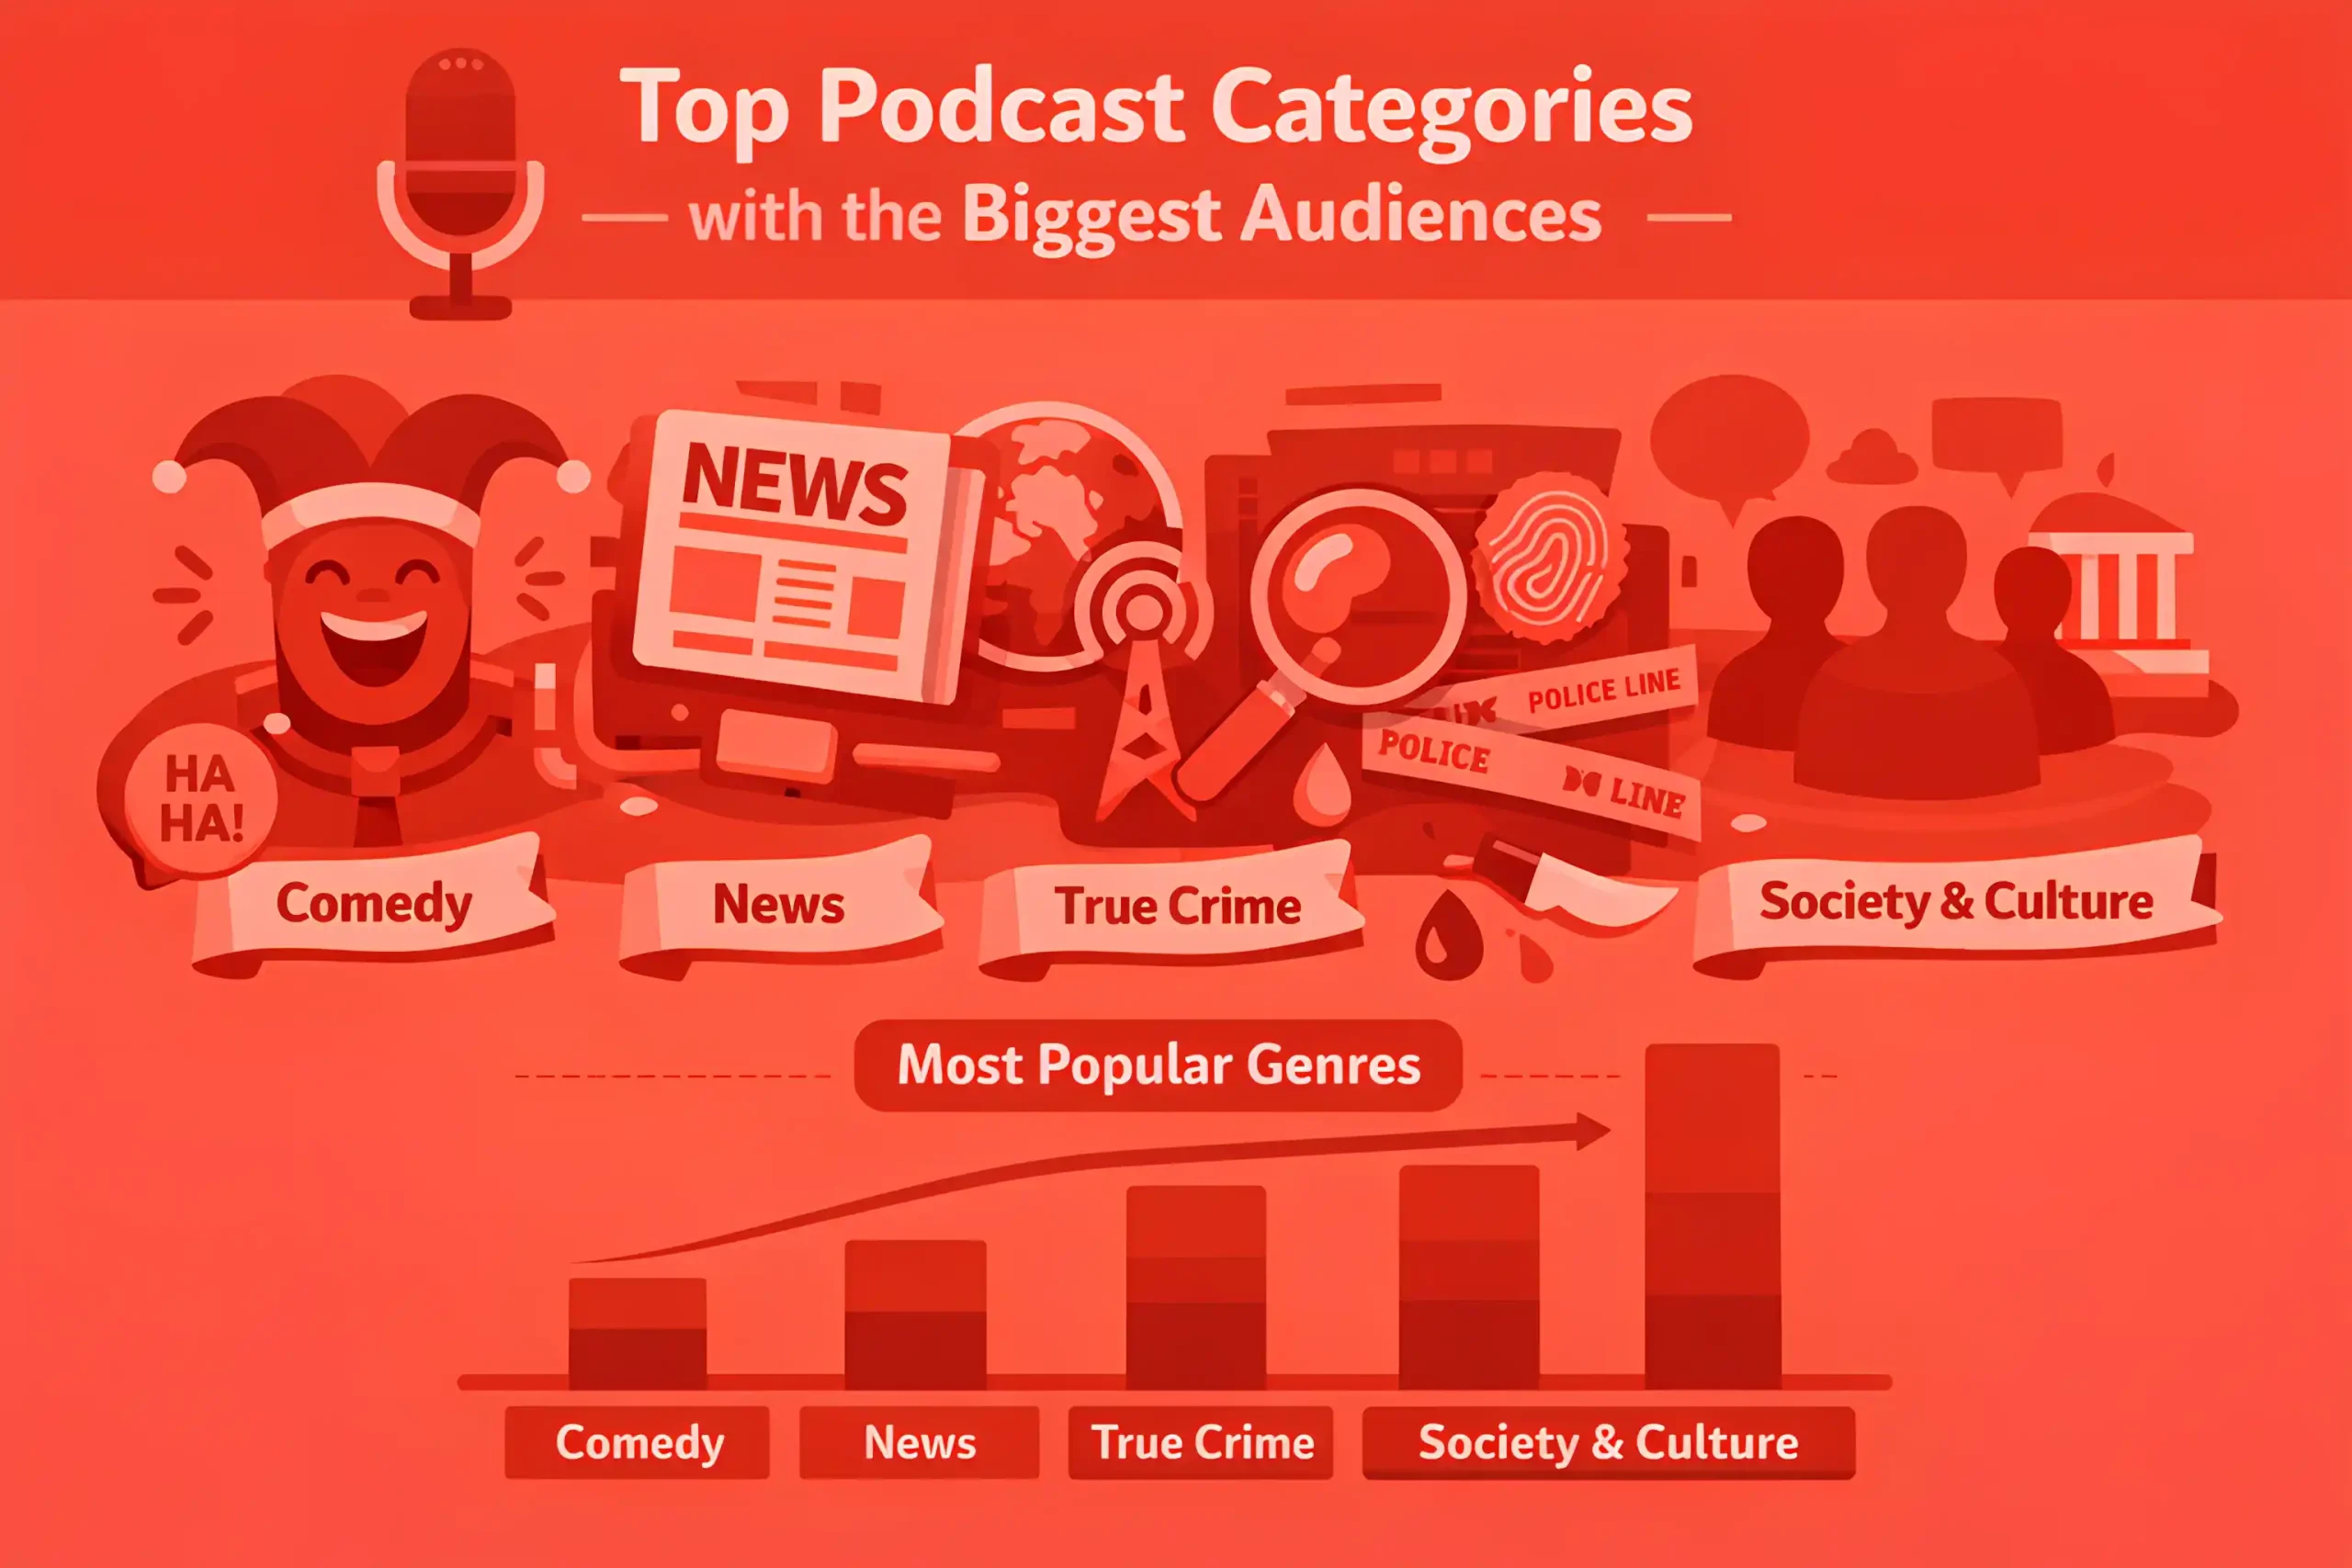
Comedy, news, true crime, and society and culture often sit among the biggest audience categories year after year.
Video formats keep gaining share, especially interviews, commentary, and panel shows built around strong personalities.
The biggest growth often shows up in shows that can be clipped, where 20% to 40% of discovery comes from short-form video.
True crime remains durable, but growth tends to shift toward fresher angles, with audience fatigue showing after 6 to 12 months of similar formats.
News and current events tend to spike around major moments, with listening swings of 20% to 60% in high news cycles.
Business and personal finance categories often attract higher CPMs, commonly 10% to 30% above general entertainment due to buyer intent.
Health, wellness, and psychology content continues to grow, often driven by evergreen problems and repeat listening habits.
Sports shows usually peak around seasons and playoffs, with downloads climbing 15% to 50% during tentpole events.
Kids and family podcasts remain smaller but loyal, and completion rates can run 5% to 15% higher because listening is often supervised.
Education and how-to shows tend to build long tails, with 30% to 60% of downloads coming from back-catalog episodes.
Shorter episode formats often improve completion, with 5% to 20% higher finish rates when episodes stay under 30 minutes.
Long-form interviews still work, but retention is more sensitive, and drop off rises when intros run past 2 to 4 minutes.
Serial storytelling formats can drive binge behavior, with 15% to 35% of listeners consuming multiple episodes per session.
Niche communities are getting stronger, and smaller shows can grow faster when the audience is tightly defined.
Cross over formats that mix audio with video, newsletters, and social clips often grow 2x to 5x faster than audio launches.
“Companion content” is rising, and many shows now package each episode with clips, summaries, and an email send to stabilize discovery.
International and bilingual shows keep growing as platforms push localized discovery.
Creator-led networks and collectives are expanding, and many scale by launching 3 to 10 shows per year around a shared audience.
Celebrity launches still spike early, but retention depends on publishing consistency and format fit.
Podcast Production & Publishing Benchmarks
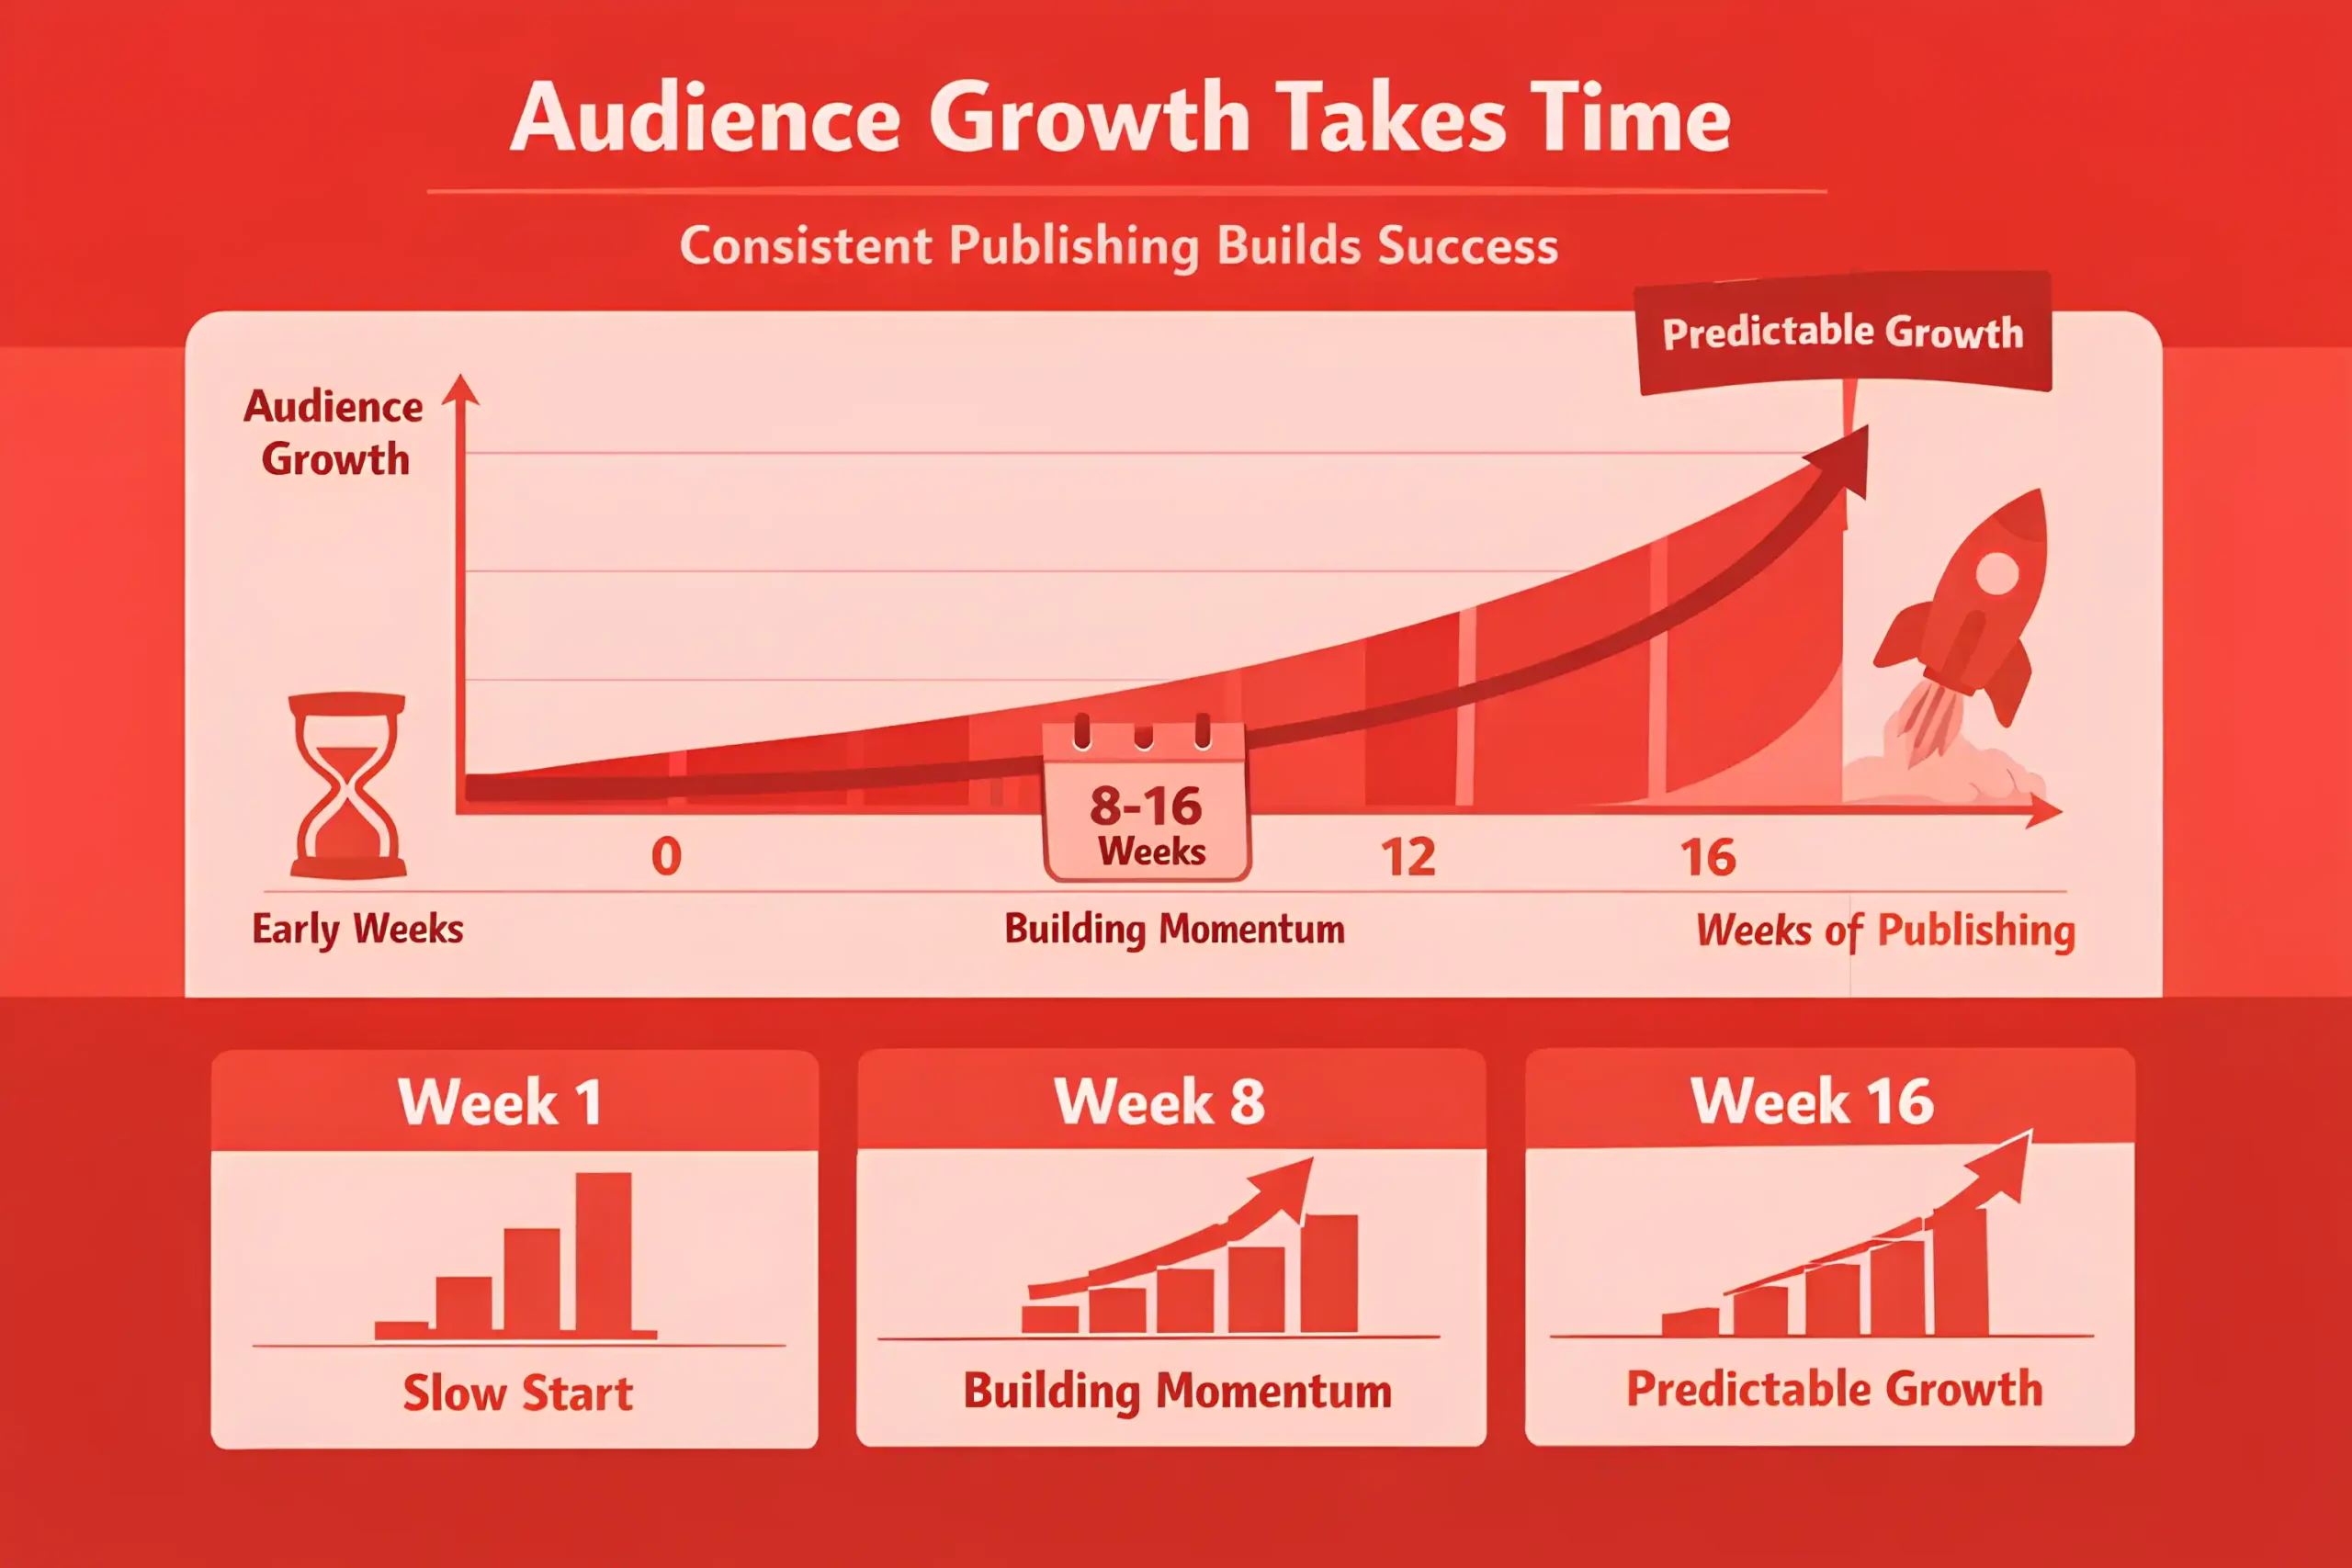
Most podcasts publish weekly or biweekly, and consistent cadence is one of the strongest predictors of steady growth.
New shows often need 8 to 16 weeks of consistent publishing before audience growth becomes predictable.
A common production rhythm is batching, with creators recording 2 to 6 episodes in a single day to stay ahead.
Editing time often runs 2x to 6x the raw recording time, depending on format and how polished the show is.
Video podcasts usually add complexity, and total post-production time can increase 30% to 80% once video editing is included.
Most shows rely on a repeatable template, and tightening intros and transitions often improves completion by 5% to 15%.
Episode length varies by genre, but many shows cluster around 20 to 60 minutes.
Retention often drops when episodes exceed 60 minutes unless the host and topic have a strong pull.
The first 5 minutes often decide the rest of the episode, with 10% to 25% drop off common when openings drag.
Shows that release on the same day each week often see 10% to 25% higher first-day downloads than those with inconsistent schedules.
Back catalogs matter, and evergreen shows often get 30% to 60% of total downloads from older episodes.
A realistic benchmark for show churn is high, and 30% to 60% of new podcasts go quiet within 6 to 12 months.
Most growth comes from improving the packaging, and showing title, artwork, and episode naming can lift clicks by 10% to 25%.
Trailer episodes often increase follow rates, with lifts of 5% to 15% when the trailer is under 2 minutes.
Guest episodes can spike downloads, but retention depends on topic alignment, with a drop back of 10% to 30% common after a big guest.
Posting clips consistently can raise discovery reach 2x to 5x, but it also adds ongoing production overhead.
Many teams use a season model, often 8 to 12 episodes per season, with planned breaks to avoid burnout.
Publishers that track production like a pipeline often reduce missed deadlines by 20% to 40%.
Audio quality issues cause silent churn, and improving baseline audio can reduce early drop-off by 5% to 10%.
Explore also: 100+ Content Marketing Statistics (Updated for 2026)
The Key Takeaways
Most podcasts do not end with a big announcement. The upload schedule just slips. An episode gets pushed to next week, then next month, and the feed goes quiet. The show did not fail because the idea was bad. It failed because production and distribution were not built to last.
The podcasts growing in 2026 treat the format like a system. The promise is clear, the release cadence is predictable, and every episode is packaged for discovery. Clips bring people in, recommendation feeds decide reach, and video keeps pulling podcasts onto bigger screens. Marketing and ad money follow the same pattern, so CPMs, ad load, and response benchmarks matter before any spend gets locked in.
Use the statistics in our guide as guardrails. Set targets for retention and follow behavior, choose sponsorship pricing with sanity checks, and pick a format the team can produce every week without burning out.


