
In 2026, inboxes are more crowded, people are more selective, and generic campaigns disappear faster than ever. What works now is timing, relevance, and understanding how people behave when no one is watching.
In our collection of email marketing statistics, we cut through opinions and trends and focus on what’s happening: open rates that still convert, emails that get ignored, tactics that quietly outperform social, and mistakes that cost brands money every day.
Use these figures to set clear targets and see what is working and what is not across signup, onboarding, and retention. They also help you explain performance, justify budget decisions, and align the team on the next priorities.
If you’re looking to turn these email marketing insights into real results, NEWMEDIA.COM helps brands build and scale email strategies that actually convert.
Email List Growth & Subscriber Behavior
Typical net list growth per month lands around 0.5% to 2% for B2B lists and 2% to 6% for e-commerce lists.
Across a year, many lists lose 15% to 30% of contacts to churn, job changes, and invalid addresses.
Embedded forms usually convert about 0.3% to 1.5% of unique site visitors into subscribers.
Popups commonly lift that range to roughly 1.5% to 5%, depending on traffic intent and offer strength.
Lead magnets on high-intent pages often convert in the 3% to 10% range.
Exit intent capture can account for 10% to 25% of monthly signups on content-heavy sites.
Each extra required field after email typically reduces completions by 10% to 25%.
Double opt-in tends to cut total signups by 15% to 45%, but it often improves engagement quality by 10% to 30%.
Double opt-in confirmation rates often sit between 65% and 85%, with the best results coming from brand-aware traffic.
Time to confirm is fast: about 40% to 60% confirm within an hour, and 70% to 90% confirm within a day.
Welcome emails usually produce 2x to 4x higher click rates than standard campaigns.
Subscribers who click in the first 14 days are often 2x to 3x more likely to stay active over the next quarter.
Without onboarding and basic segmentation, 20% to 45% of new subscribers can go inactive within the first month.
For most campaigns, unsubscribe rates fall around 0.1% to 0.3%; consistent 0.5% or higher points indicate a relevance or frequency problem.
Spam complaint risk starts to rise when complaints push past 0.05% to 0.10% per send.
Preference centers are typically used by 5% to 15% of subscribers, and they can cut unsubscribes by 10% to 30% in high-frequency programs.
Doubling send frequency can increase unsubscribes by 20% to 60% unless targeting and content match improve at the same time.
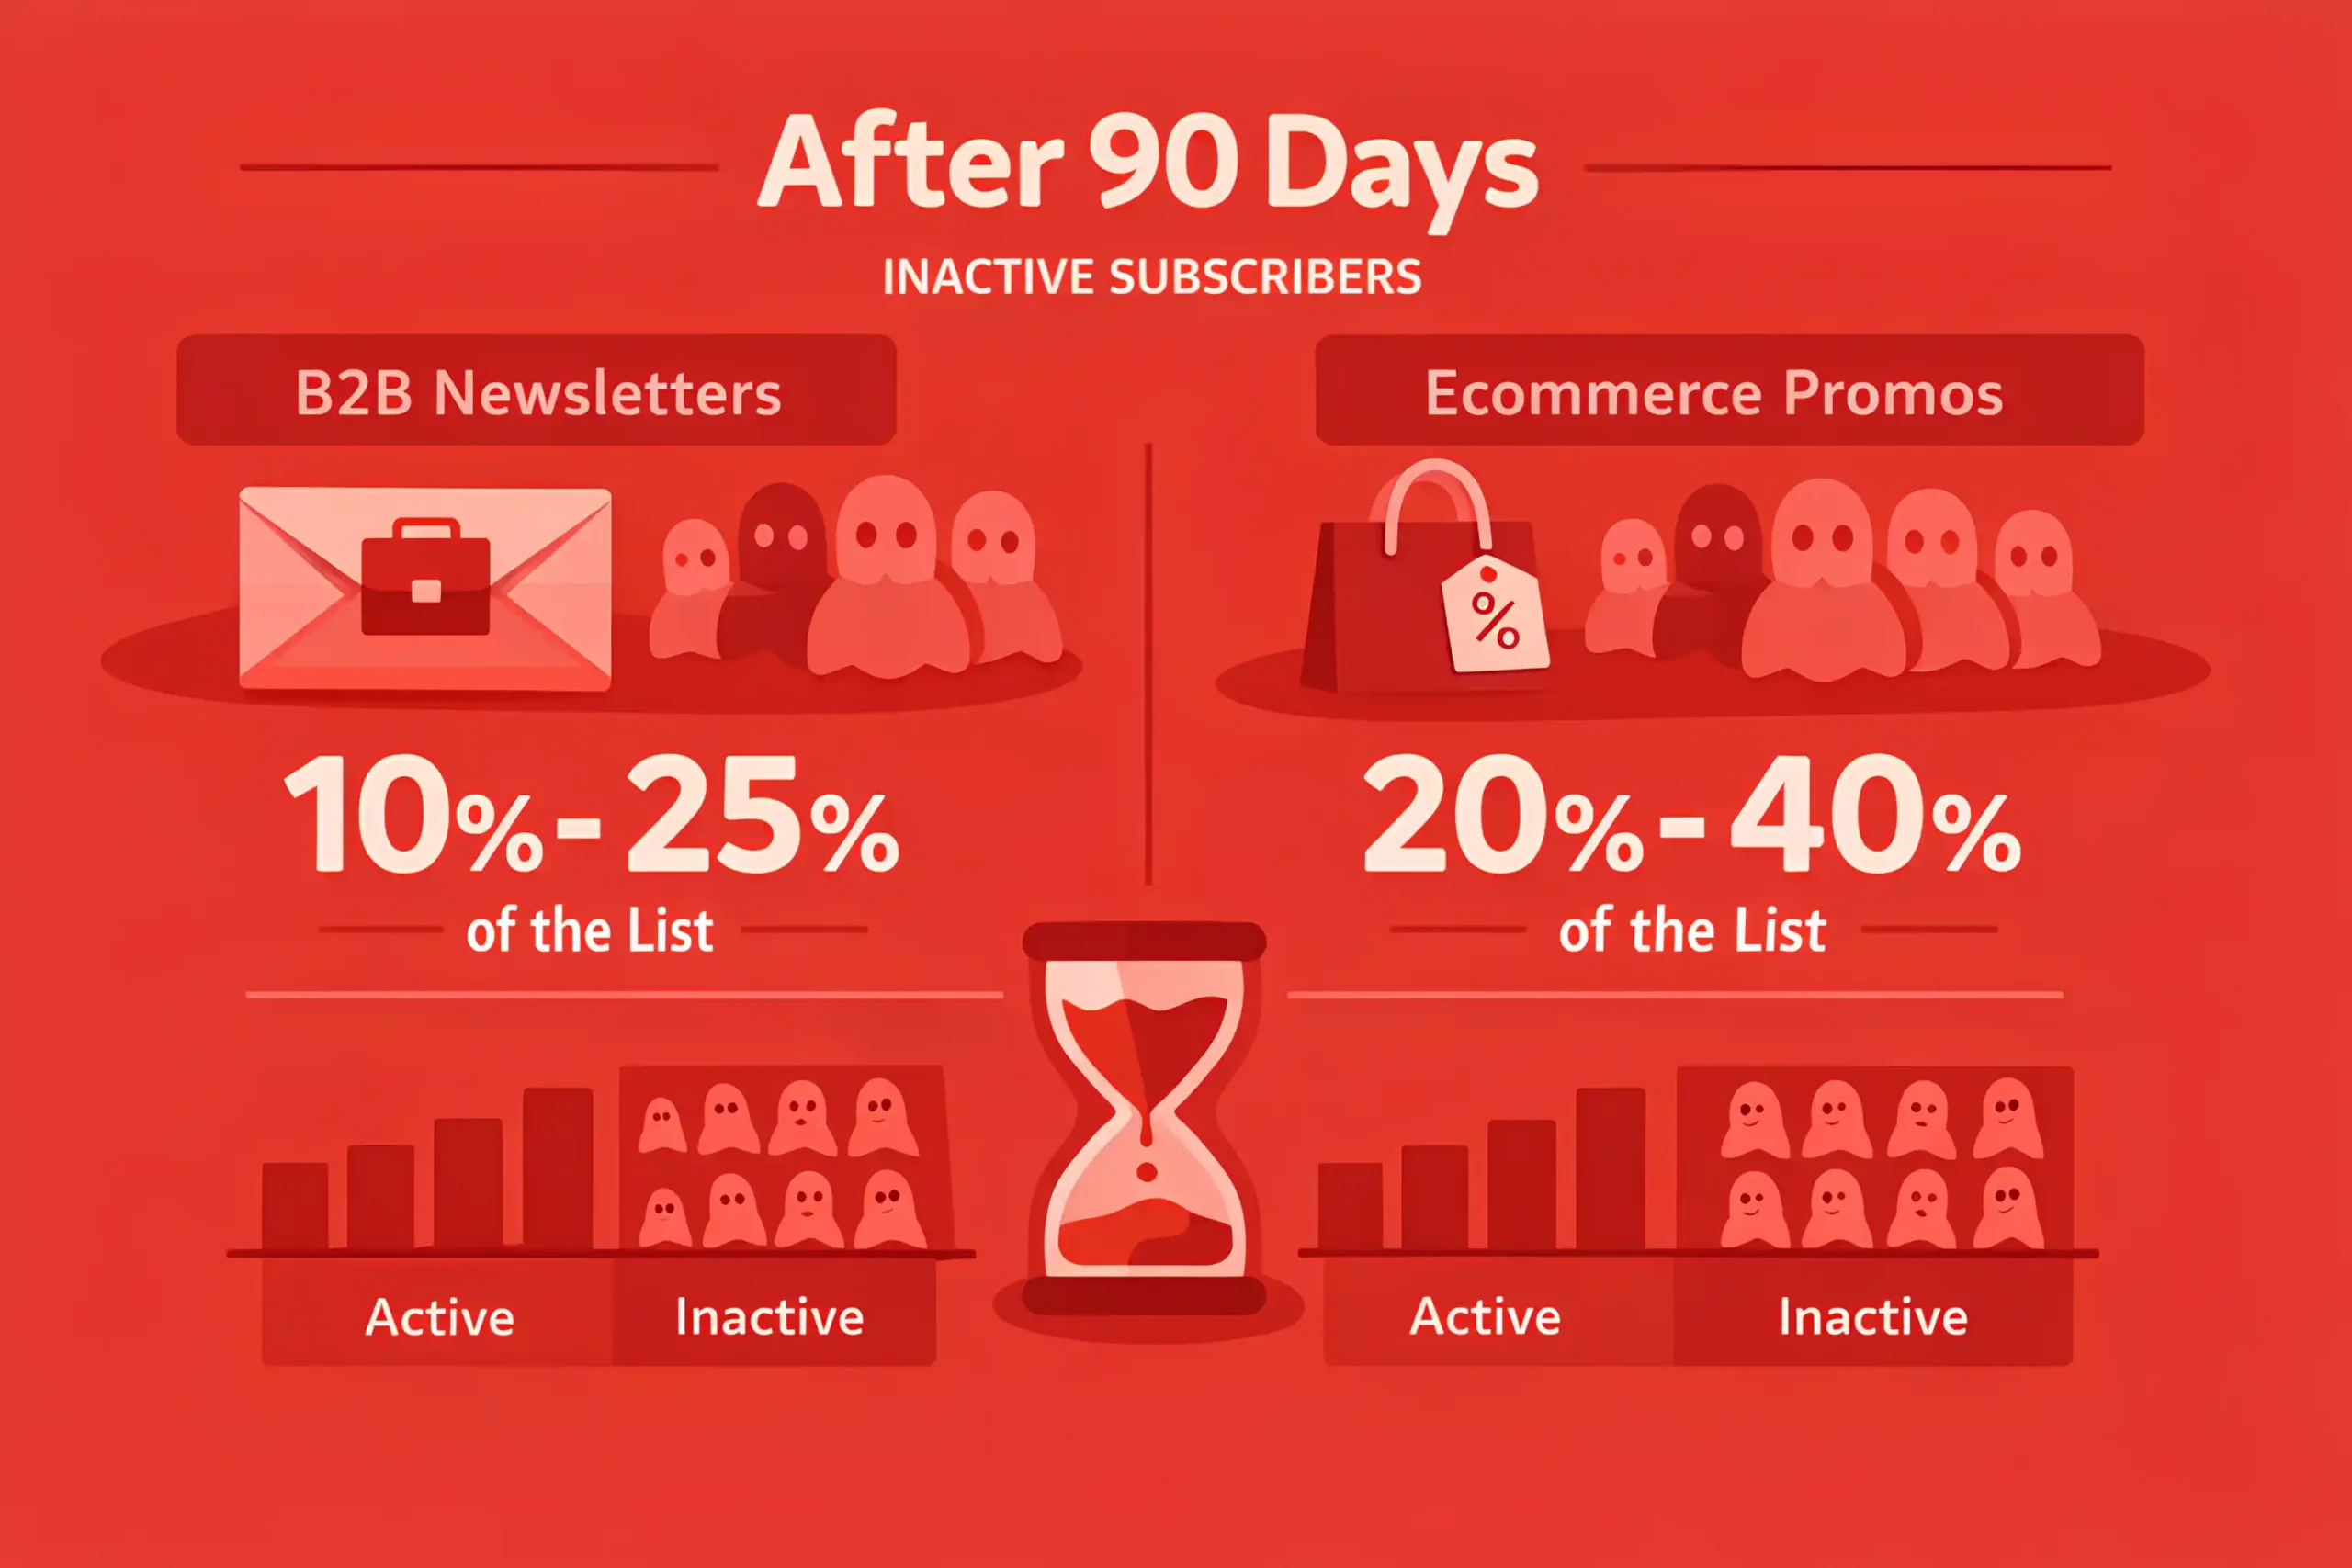
After 90 days, “silent” subscribers commonly make up 10% to 25% of B2B newsletter lists and 20% to 40% of promo ecommerce lists.
Reengagement flows often win back 3% to 12% of inactive subscribers when success is measured by clicks or replies.
Quarterly list hygiene can reduce hard bounces by 15% to 40% and stabilize deliverability within about 2 to 8 weeks.
Also explore: 250+ Digital Marketing Statistics
Email Marketing Performance Benchmarks
Delivery rates often sit around 95% to 99% when list hygiene is consistent.
Inbox placement commonly ranges from 80% to 95%, depending on sender reputation and engagement.
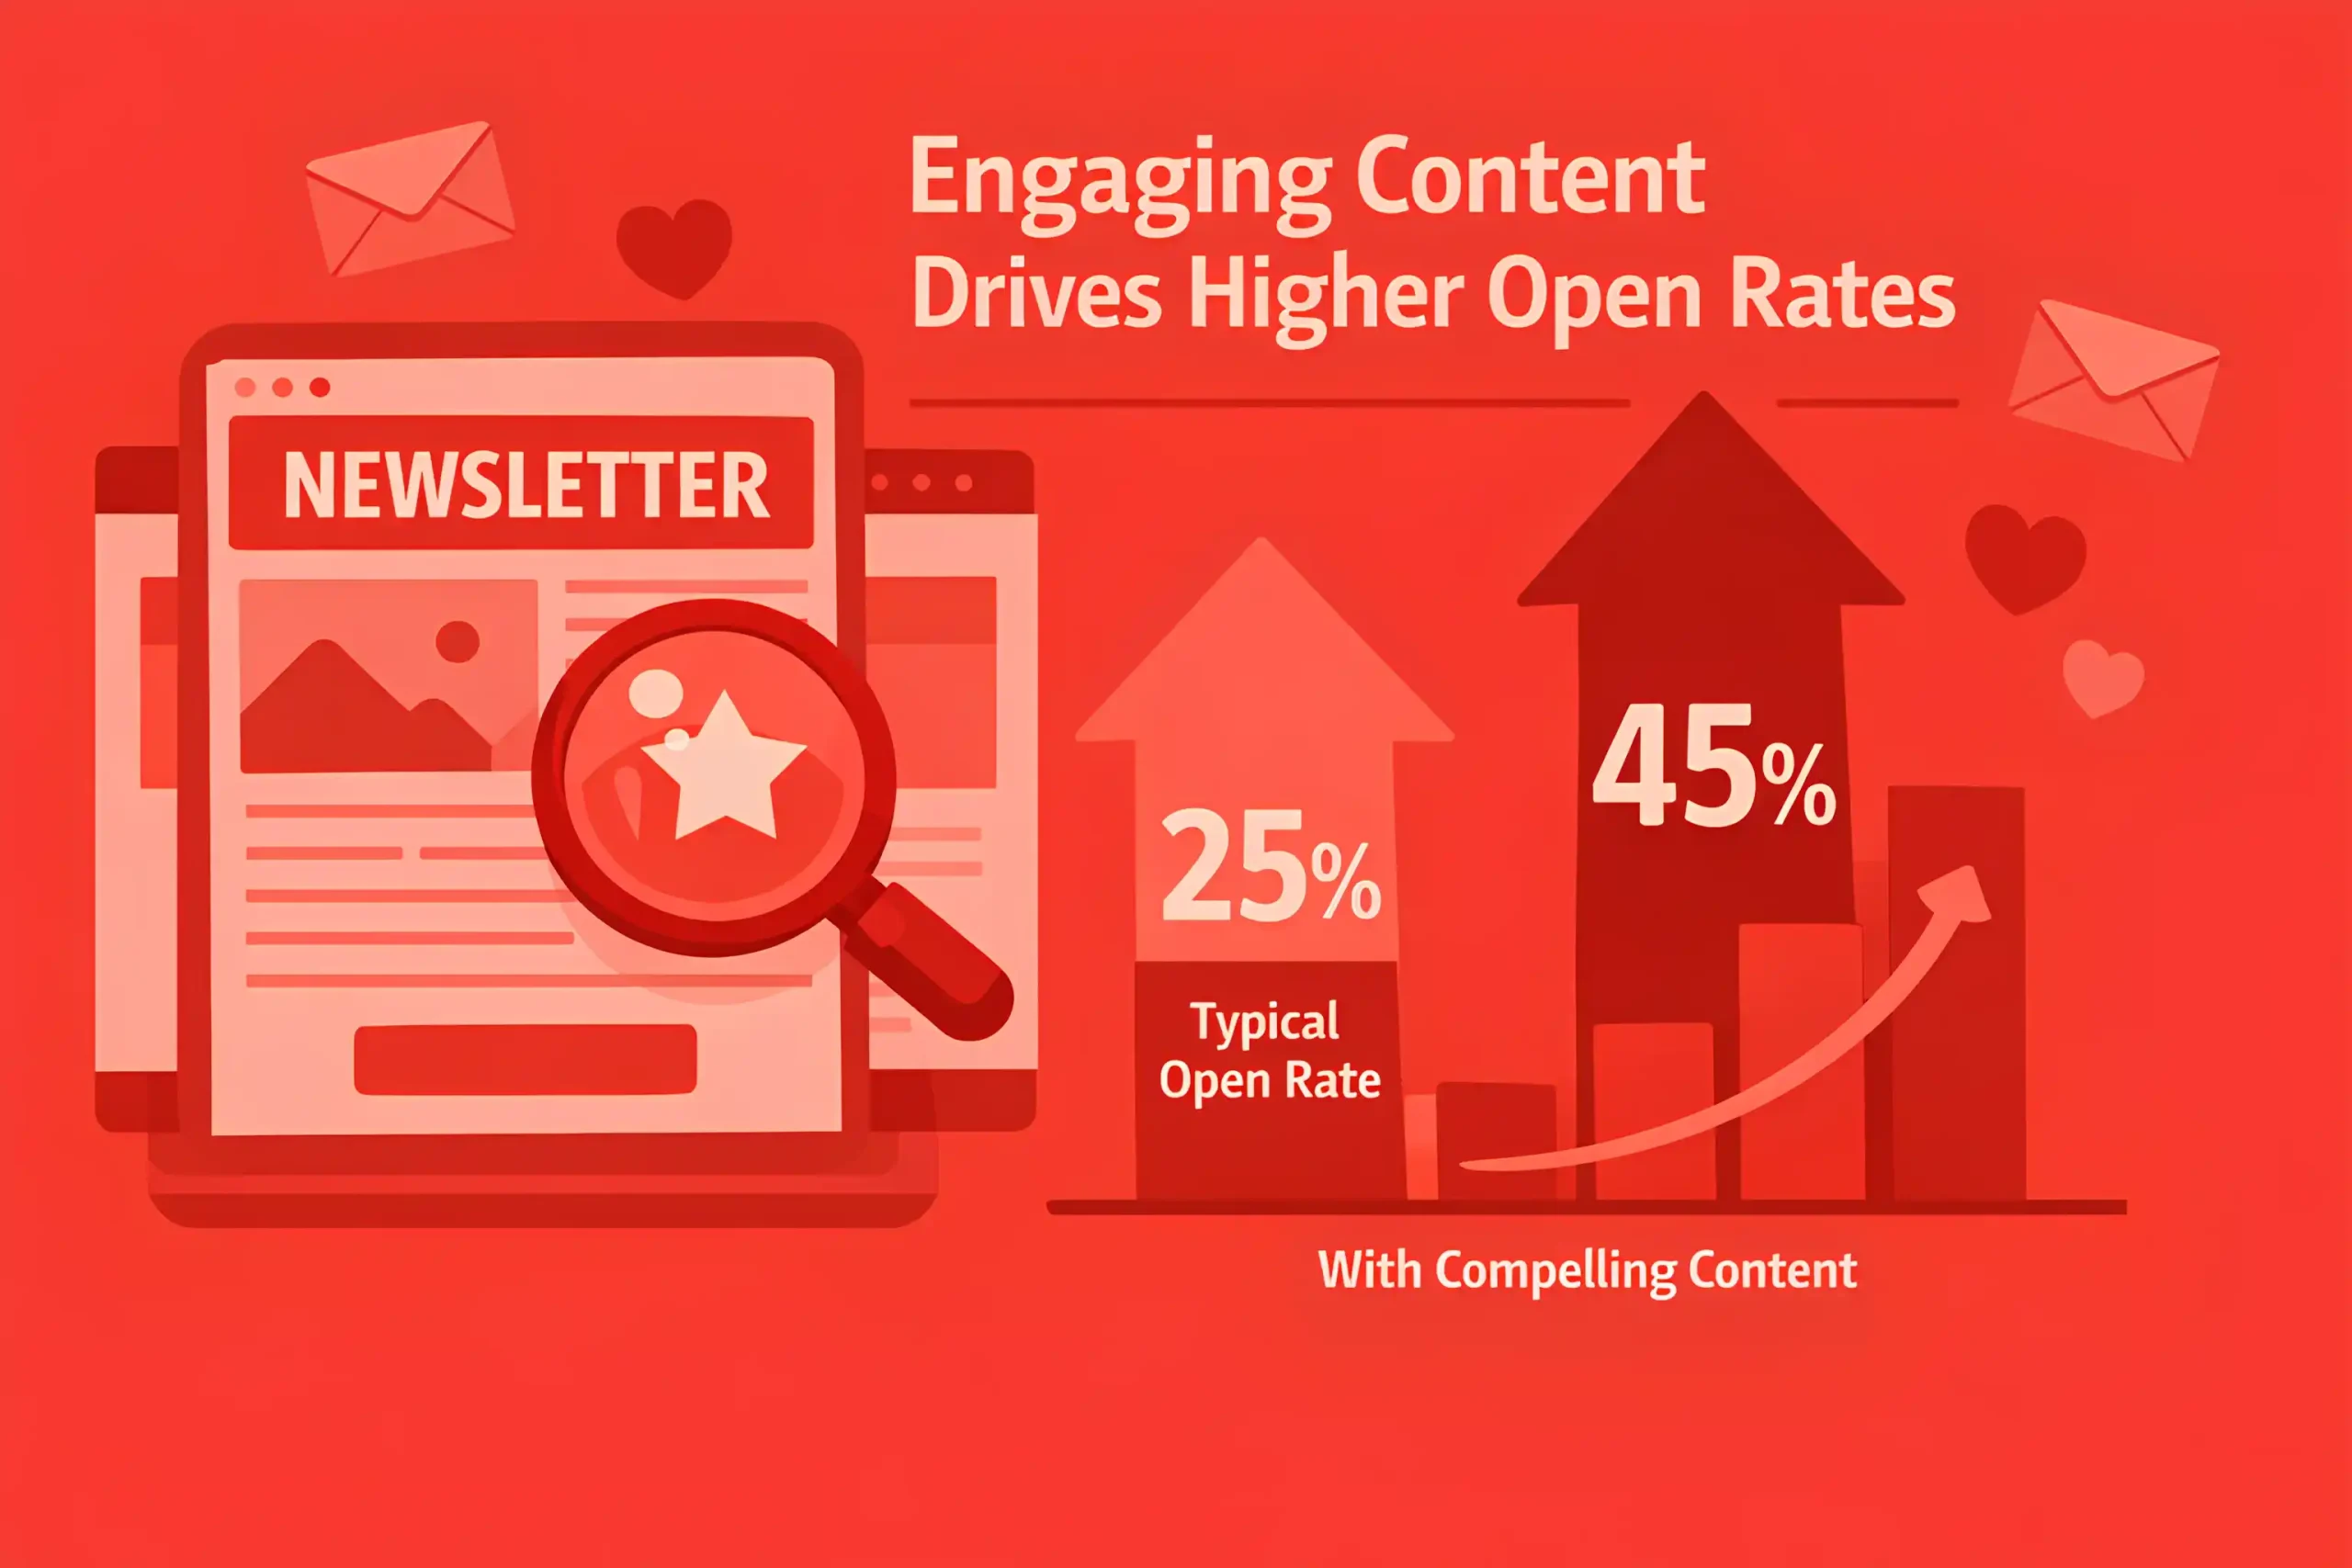
Average open rates tend to land at 20% to 35% for B2B and 18% to 28% for e-commerce.
Newsletter-style sends can reach 25% to 45% when the content earns attention.
Click rates usually fall in the 1% to 4% range, with many programs clustering around 1.5% to 3%.
Click to open rate often sits between 8% and 18%, and strong programs push 18% to 30%.
Conversion rates from clicks are often 1% to 5% for e-commerce and 2% to 8% for B2B lead capture.
Unsubscribe rates per campaign typically stay around 0.1% to 0.3%.
Consistent unsubscribe rates above 0.5% usually signal a relevance or frequency issue.
Spam complaints usually stay below 0.01% to 0.05%, and 0.1% is a serious warning line.
Hard bounces are commonly kept under 0.2% to 0.5% per send with regular validation.
Automated lifecycle emails frequently outperform broadcasts by 2x to 6x in clicks and conversions.
Welcome sequences often land 2x to 4x higher click rates than standard campaigns.
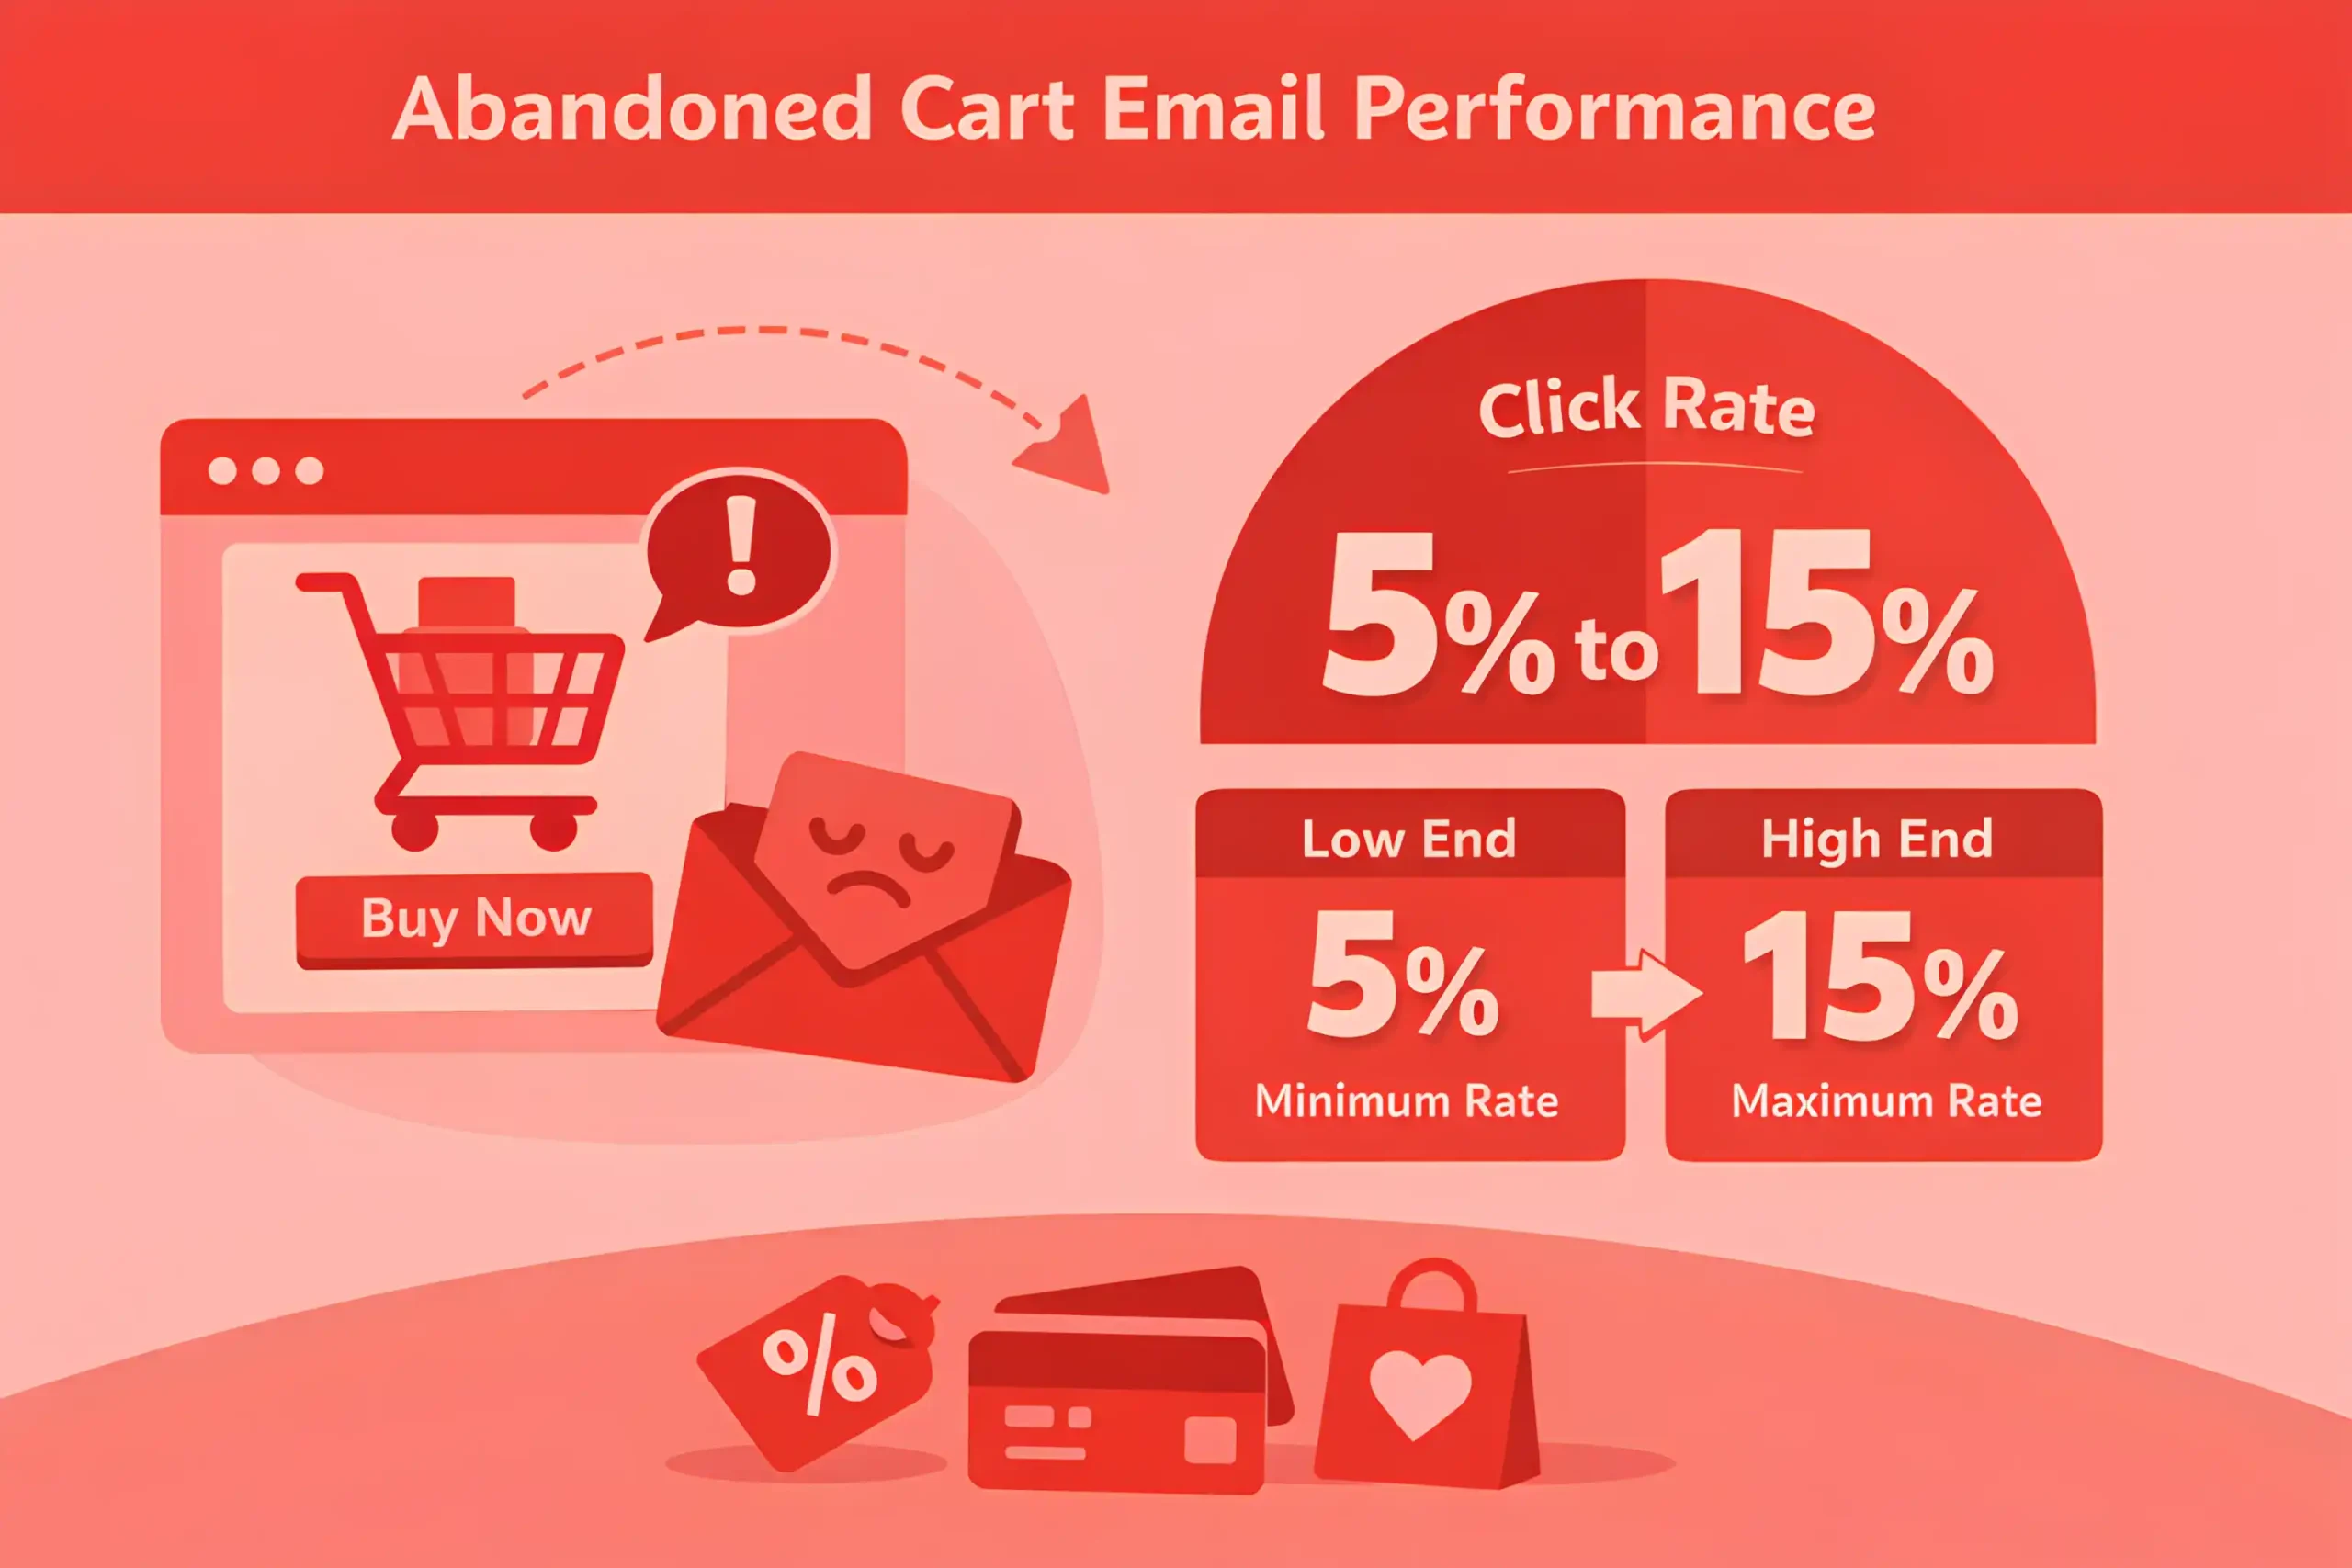
Abandoned cart flows commonly see click rates of 5% to 15%.
Purchase conversion from abandoned cart clicks often falls between 2% and 10%.
Post-purchase flows often hold open around 30% to 55%.
Most opens happen quickly, with roughly 60% to 80% within 24 hours.
Mobile often accounts for 45% to 70% of first reads, which makes responsive website design a direct factor in click-through and conversion
A single clear call to action often lifts click-to-open rate by 10% to 25% versus multi-offer layouts.
Doubling send frequency often increases unsubscribes by 20% to 60% unless targeting improves at the same time.
Related article: 100+ Reputation Management Statistics
Deliverability, Spam & Inbox Placement
Healthy programs often see inbox placement of around 80% to 95% across major providers.
When reputation is weak, inbox placement commonly drops into the 60% to 80% range until sending patterns stabilize.
Spam folder placement is often 2% to 8%, and anything above 10% is a clear warning sign.
Spam complaint rates typically need to stay under 0.01% to 0.02% to protect long-term inbox placement.
Sustained complaints near 0.05% start to limit reach, and 0.1% can trigger rapid filtering.
Hard bounces are usually kept below 0.3%, and 0.5% or higher points to list quality problems.
Total bounces often stay under 1% to 2% when addresses are actively maintained.
Removing invalid and risky addresses can cut hard bounces by 30% to 60% in the next sends.
Sending to dormant subscribers can double spam placement, especially after 120 to 180 days of no engagement.
Pruning the least engaged 10% to 25% of a list often lifts inbox placement by 3 to 10 points within 2 to 6 weeks.
A sudden volume increase of 2x to 5x can reduce inbox placement by 5 to 20 points until reputation recalibrates.
Large spikes after long gaps tend to perform worse than gradual ramps over 2 to 4 weeks.
Missing or hard-to-find unsubscribe options can raise complaint rates by 2x to 5x.
High complaint periods often cluster in the first 24 to 48 hours after a send, so early monitoring matters.
Authentication alignment and clean headers commonly improve inbox placement by 5 to 15 points over time.
Content changes alone rarely fix deliverability if list quality is poor, since reputation damage can persist for 4 to 12 weeks.
Shared sending infrastructure shows wider variance, with inbox placement swings of 5 to 15 points across providers.
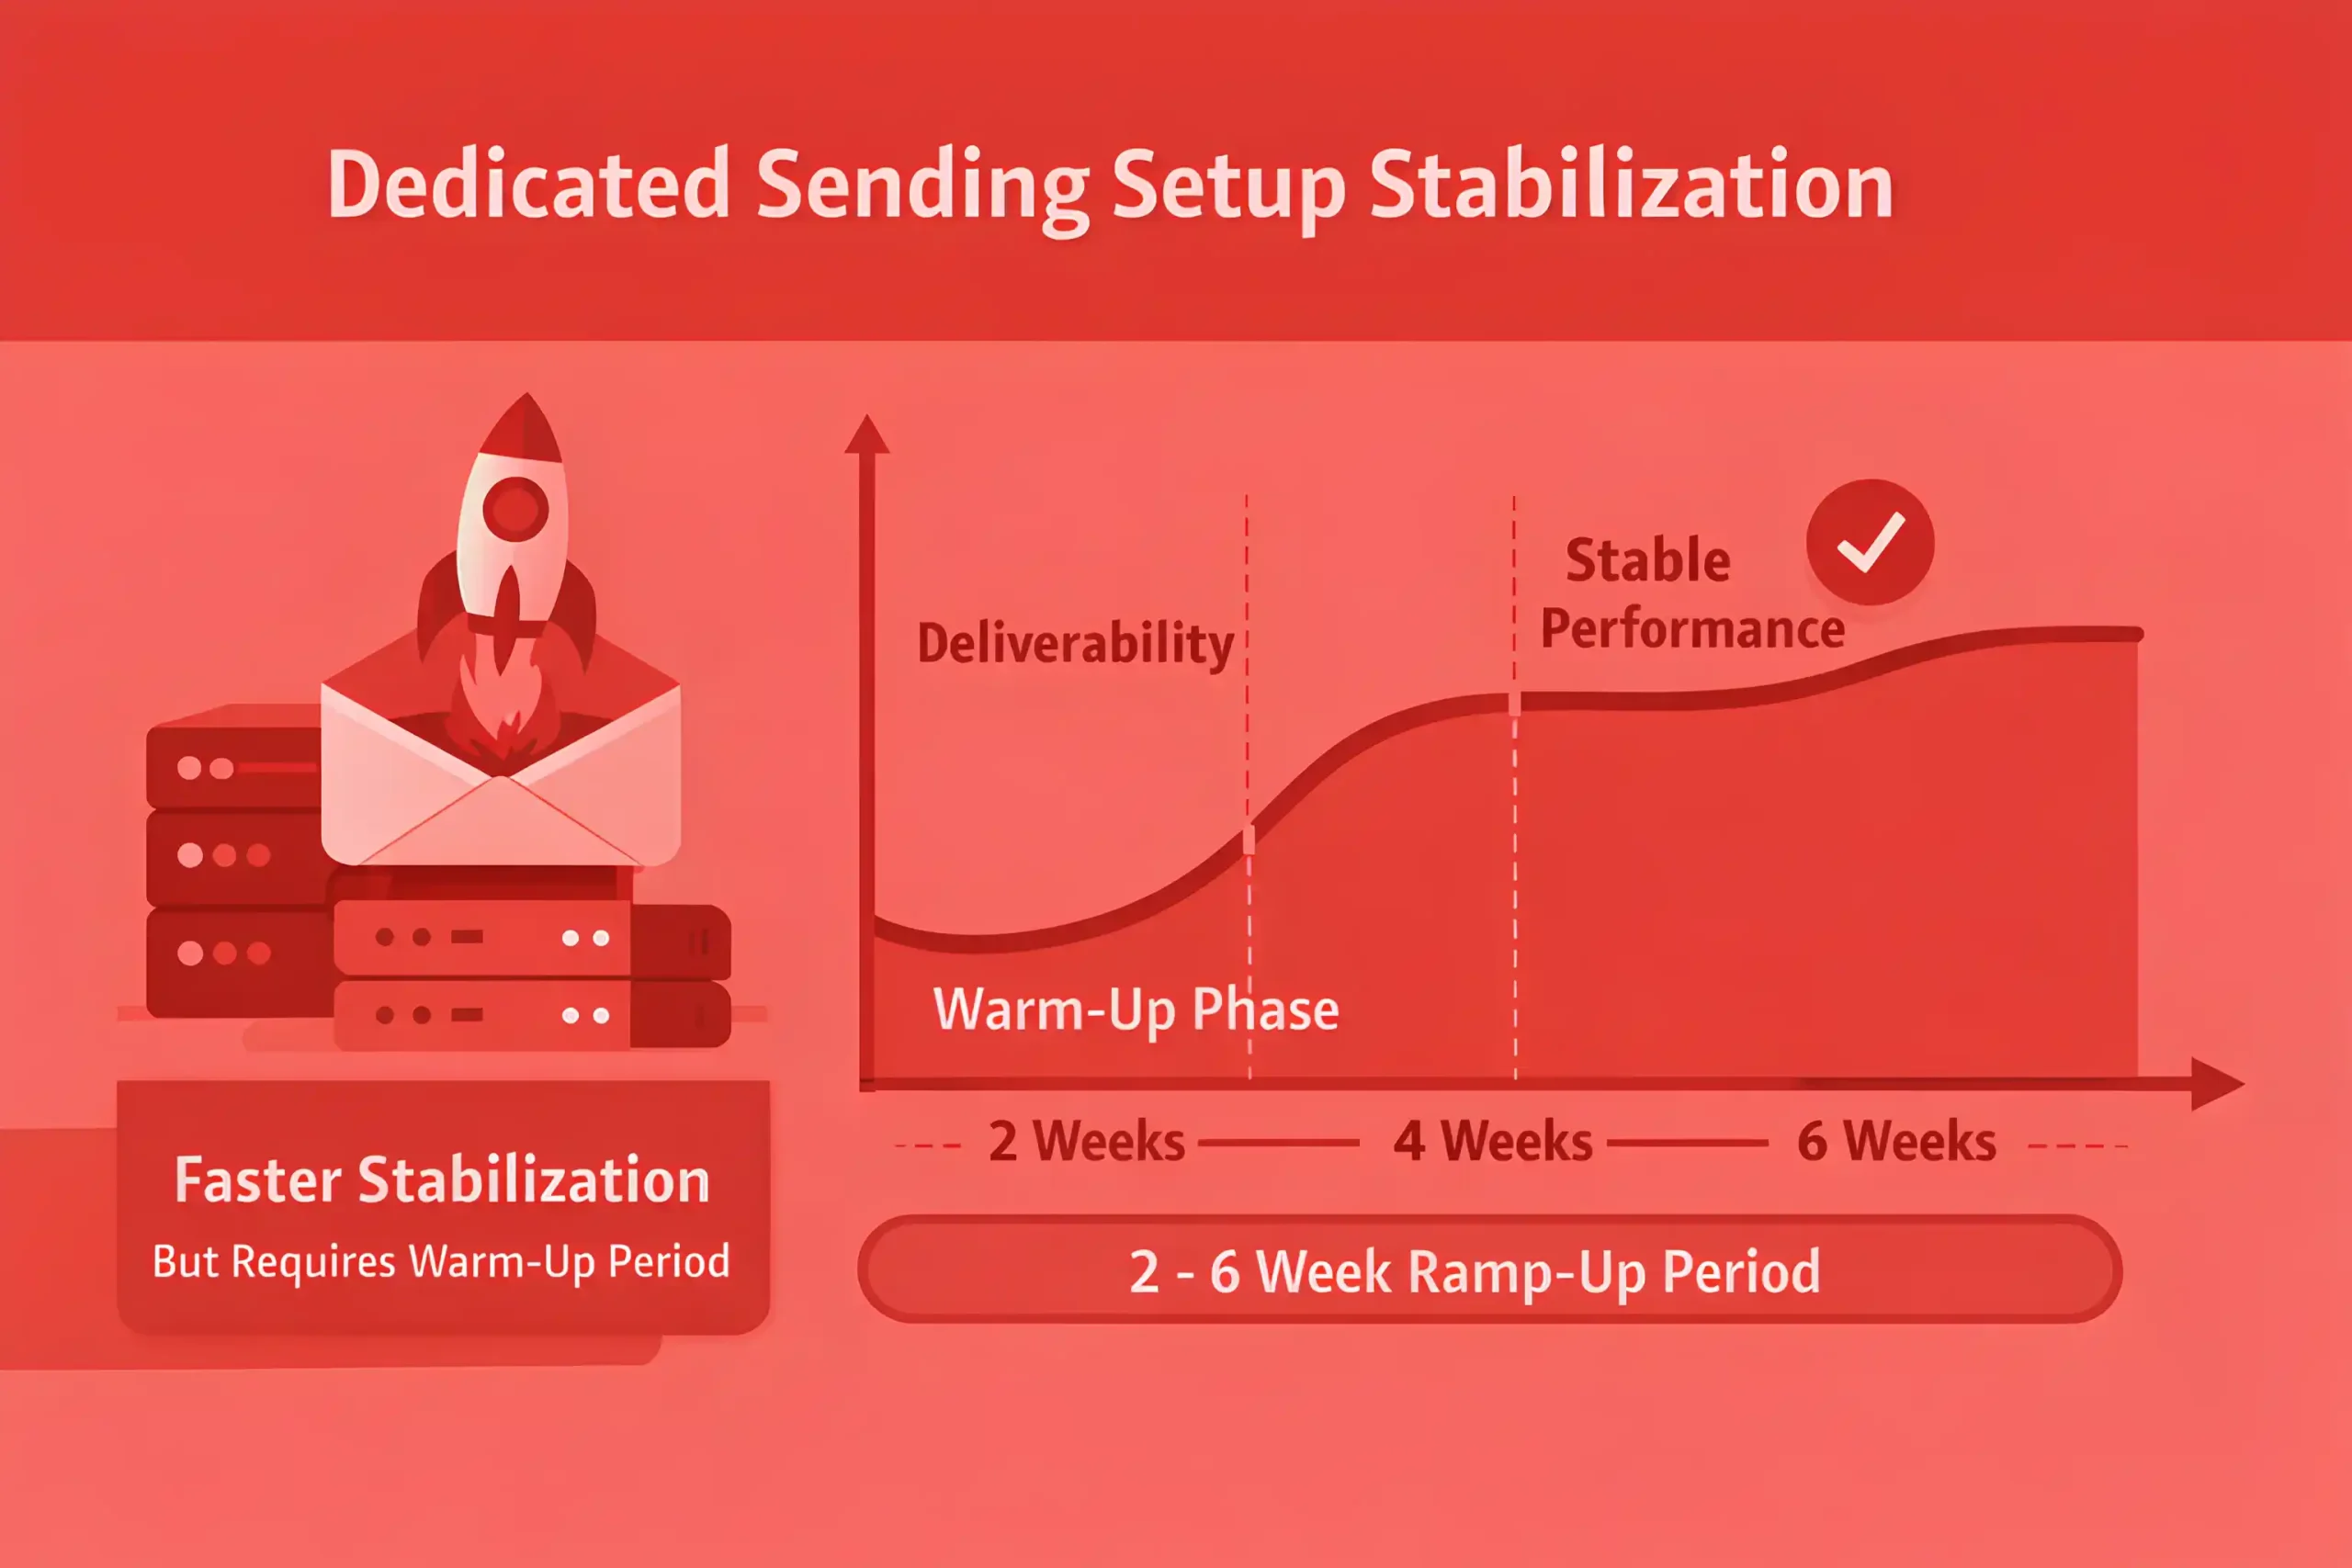
Dedicated sending setups typically stabilize faster, but still need a warm-up window of 2 to 6 weeks.
Continuous list hygiene and consistent cadence usually outperform aggressive reactivation, which often produces 2x higher complaints.
A program that stays under 0.02% complaints and under 0.3% hard bounces tends to protect inbox placement even at higher volume.
Automation, Personalization & Segmentation Impact
Automated emails often generate 2x to 6x higher revenue per recipient than one-off broadcasts.
Well-built lifecycle flows commonly drive 25% to 45% of total email revenue with fewer sends.
Segmentation typically lifts click rates by 10% to 35% versus sending the same campaign to the full list.
Strong segmentation can push that improvement to 40% to 80% when offers and timing match intent.
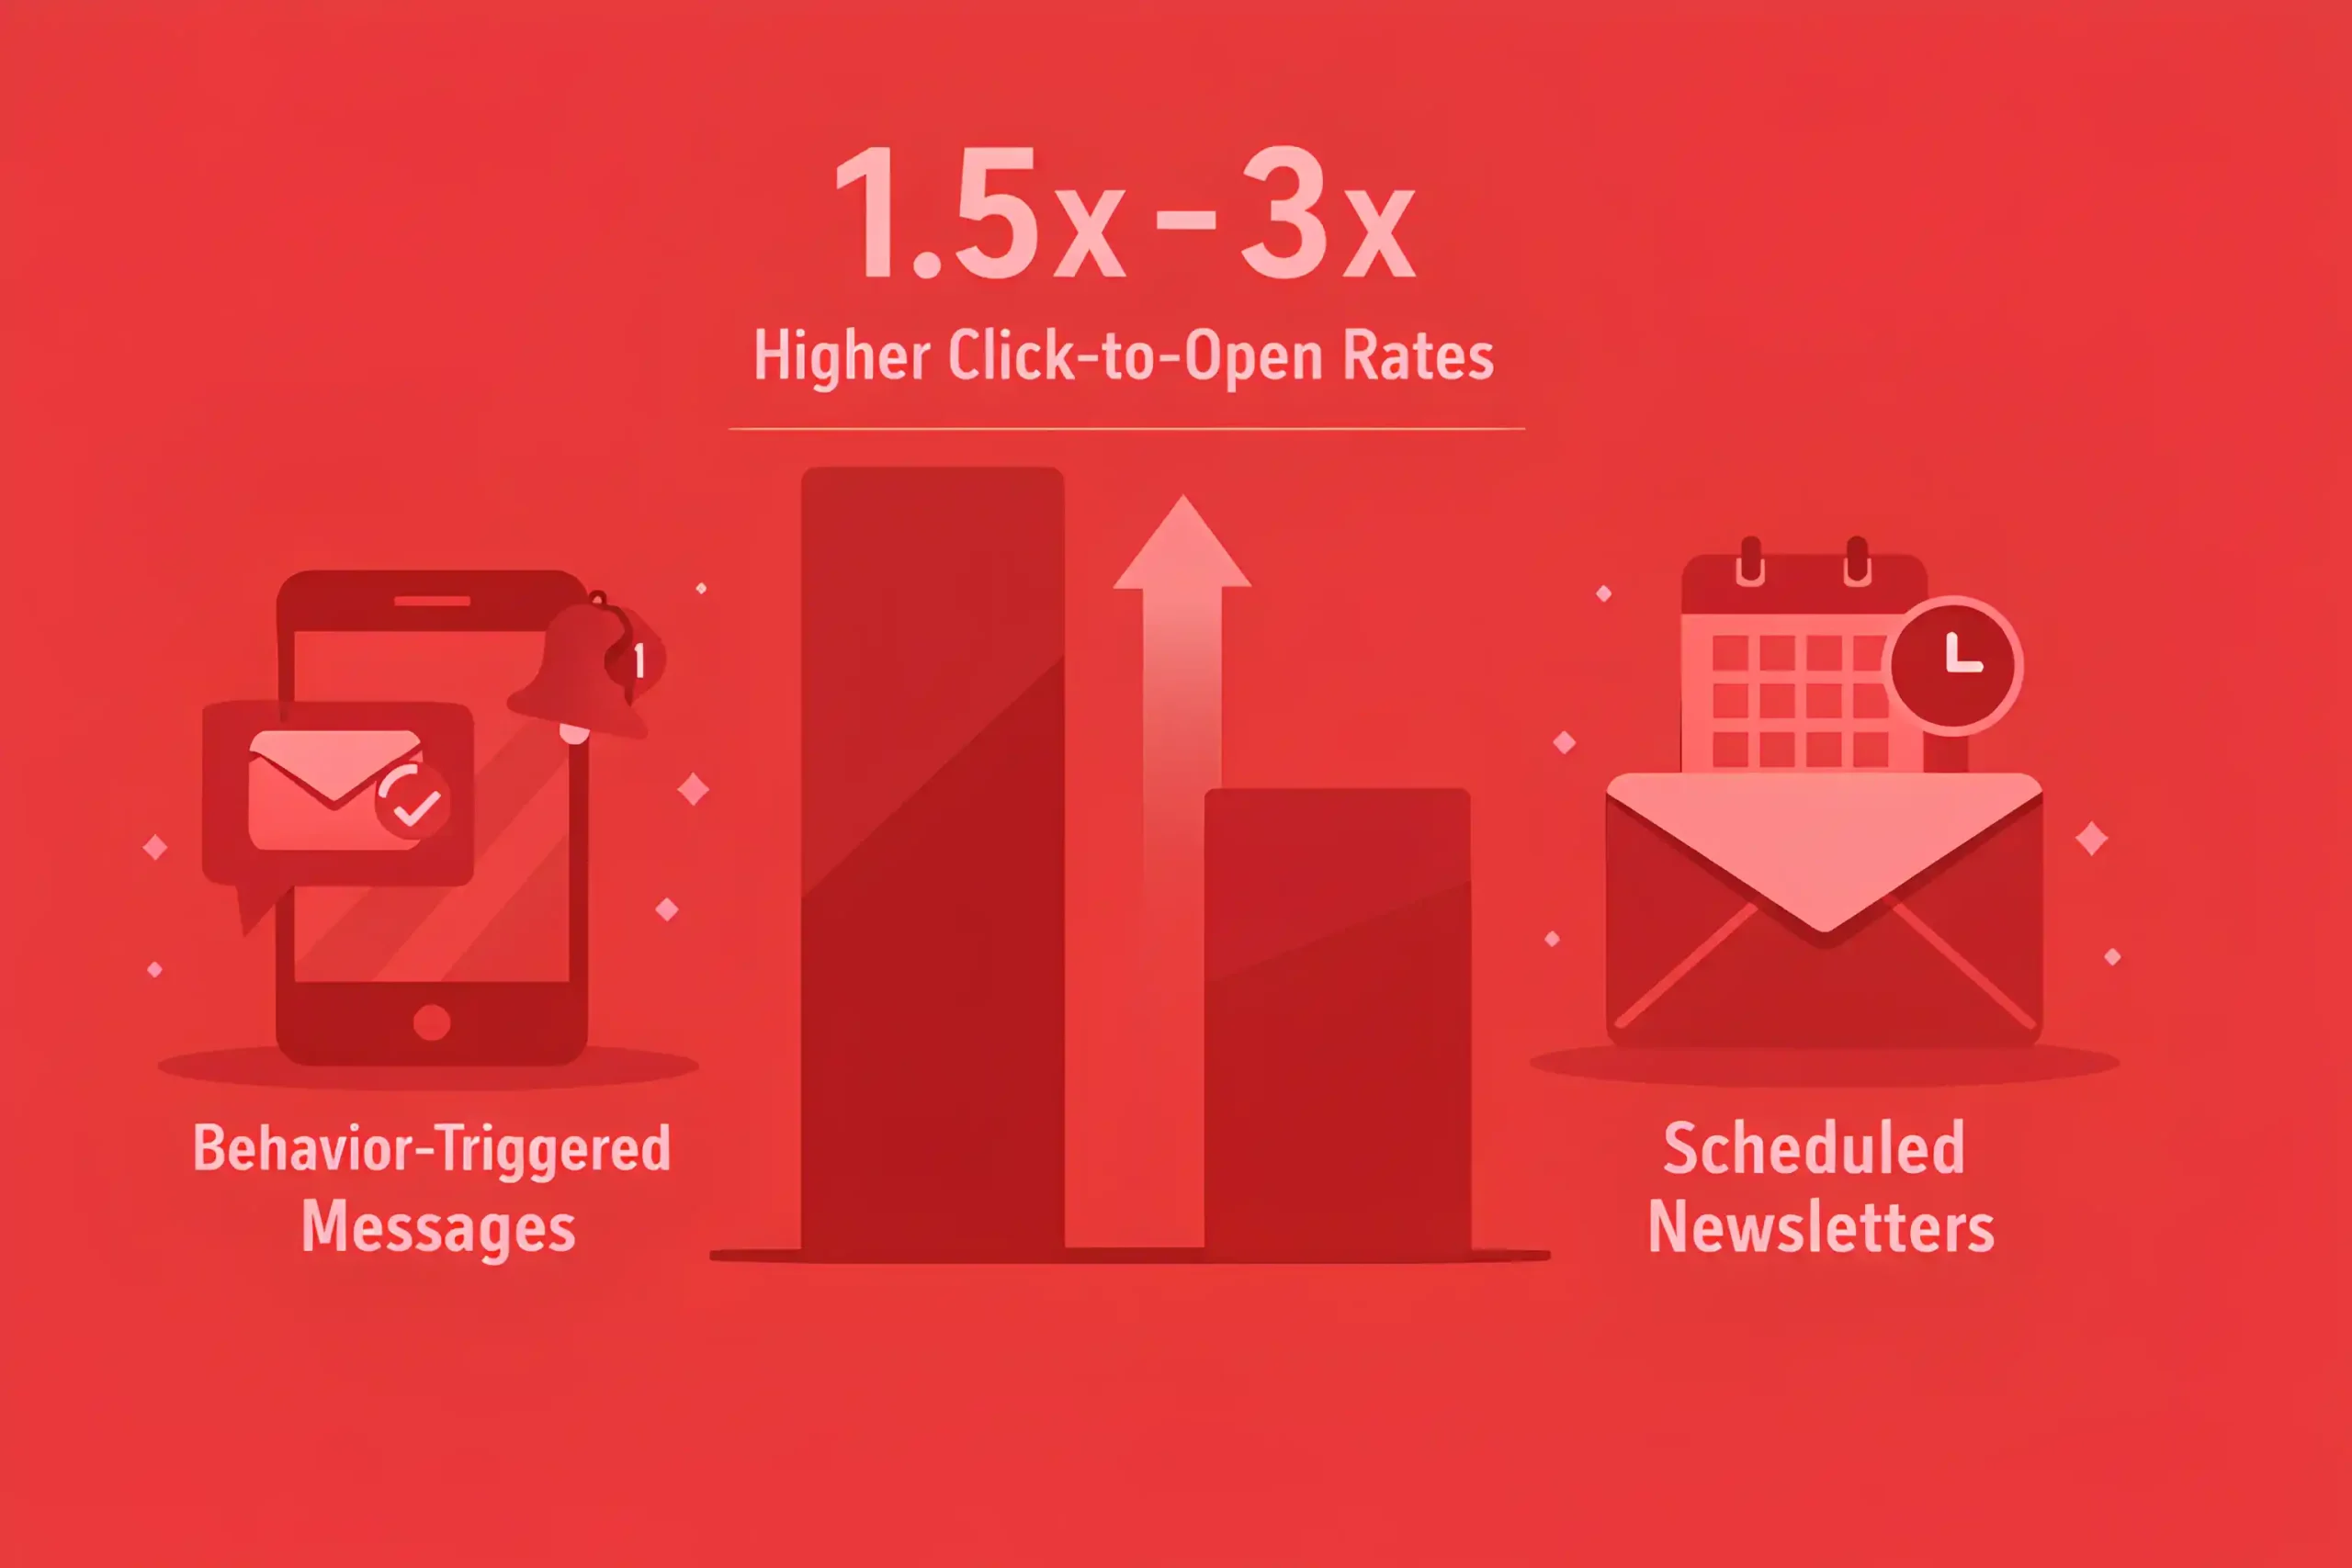
Behavior-triggered messages often earn 1.5x to 3x higher click-to-open rates than scheduled newsletters.

Welcome sequences commonly deliver 2x to 4x higher click rates and 30% to 60% higher conversion rates than standard promotions.
Abandoned cart automation often sees click rates of 5% to 15%, with purchase conversion from clicks around 2% to 10%.
Browse abandonment flows usually perform lower than cart flows, but still lift conversions by 5% to 20% when the timing is tight.
Post-purchase automation can account for 10% to 25% of repeat purchases when it runs consistently.
Personalized product or content blocks often improve click rates by 5% to 20%, and in strong catalogs it can reach 20% to 40%.
Subject line personalization alone tends to move results by 0% to 10%, unless it is tied to real context.
Dynamic content that reflects category interest can improve click-to-open rate by 10% to 30%.
Using first-party behavior signals to suppress irrelevant sends can reduce unsubscribes by 10% to 25%.
Preference centers commonly lower opt-outs by 10% to 30% when subscribers can pick topics and cadence.
Simple segmentation by lifecycle stage often outperforms demographic splits, improving conversion by 10% to 35%.
Triggered sends that fire within 1 hour of intent signals often outperform those delayed by 24 hours by 15% to 50%.
Reengagement automation typically recovers 3% to 12% of inactive subscribers, measured by clicks or replies.
Overtargeting can backfire when segments become too small, and performance tends to flatten below 500 to 2,000 recipients per send.
Automation reduces frequency dependence, since brands often see similar revenue with 10% to 30% fewer broadcast sends.
Teams that audit flows quarterly often lift flow revenue by 10% to 25%, jas part of a more complete optimization approach across all services.
Also read: 200+ Social Media Marketing Statistics
Revenue, ROI & Conversion Stats
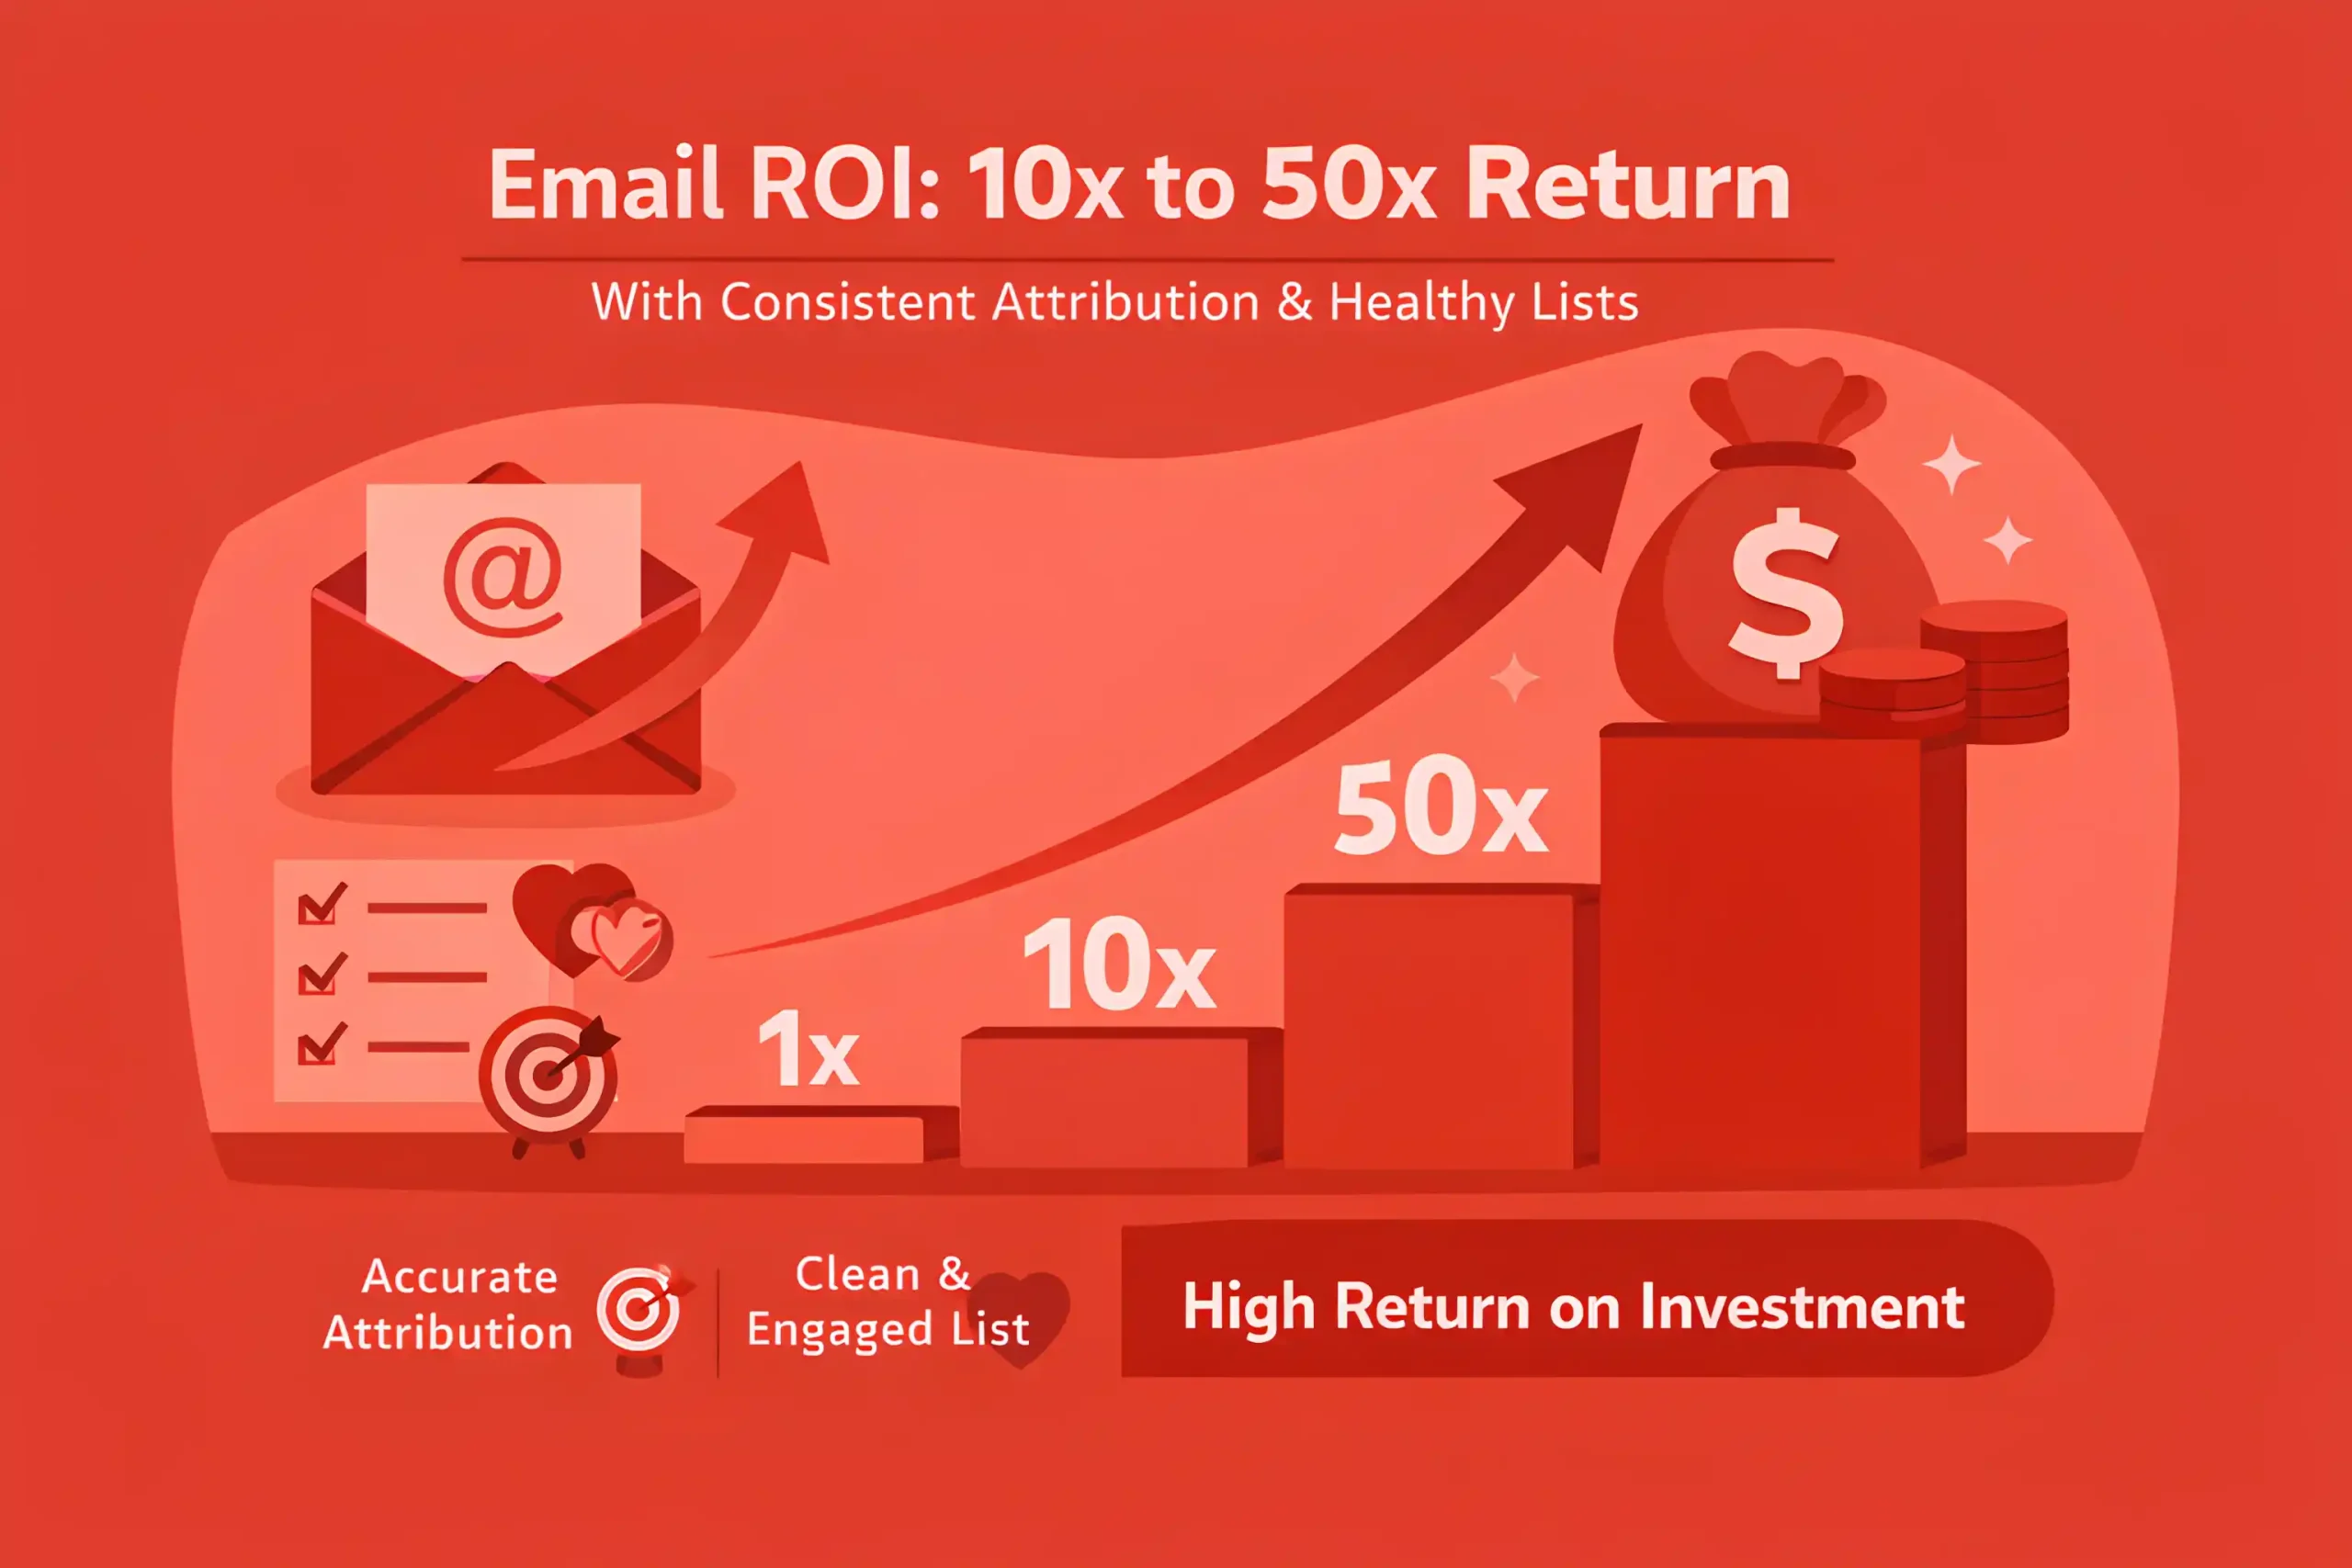
Email channel ROI is commonly described in the 10x to 50x return range when attribution is consistent, and teams usually keep that discipline through ongoing performance marketing.
Revenue per email delivered often lands between $0.02 and $0.15, with top-tier ecommerce programs reaching $0.20 to $0.60 during peak seasons.
Revenue per recipient is usually higher than revenue per delivered when deliverability issues exist, since weak placement hides losses.
Revenue per email delivered often lands between $0.02 and $0.15, with top ecommerce programs pushing higher during peak seasons when demand capture is supported by ecommerce PPC services.
Automated flows frequently convert better, with purchase conversion commonly in the 1% to 5% range from delivered to purchase.
Welcome flows often drive 5% to 15% of first purchases for new subscribers when the incentive is clear and time-limited.
Abandoned cart programs commonly recover 3% to 10% of abandoned checkouts, and strong setups can reach 10% to 20%.
Cart emails that send within 1 hour typically outperform those sent after 24 hours by 15% to 50%.
Personalized recommendations often lift revenue per send by 5% to 20%, and sometimes 20% to 40% in large catalogs.
Segmentation usually increases revenue per recipient by 10% to 30% compared to one message blast.
Suppression of low intent segments can reduce total sends by 10% to 30% while keeping revenue flat or higher.
Click to purchase conversion often falls between 1% and 5% for e-commerce, and stronger intent plus better product discovery usually starts with e-commerce SEO.
Lead gen programs often see click-to-lead conversion in the 2% to 8% range, and high-intent assets perform best when they sit inside a focused B2B SEO strategy.
Email-driven average order value commonly runs 10% to 30% higher than social-driven orders when the audience is repeat buyers.
Repeat purchase rates from post-purchase email can lift overall repeat revenue by 5% to 15% when the sequence is sustained.
Win-back flows often recover 1% to 4% of lapsed customers, with the biggest gains coming from recent churn.
A one-point improvement in click-to-open rate can translate into 3% to 10% more revenue when conversion rates hold steady.
Improving inbox placement by 5 points often increases revenue by 3% to 15%, since more emails reach the primary inbox.
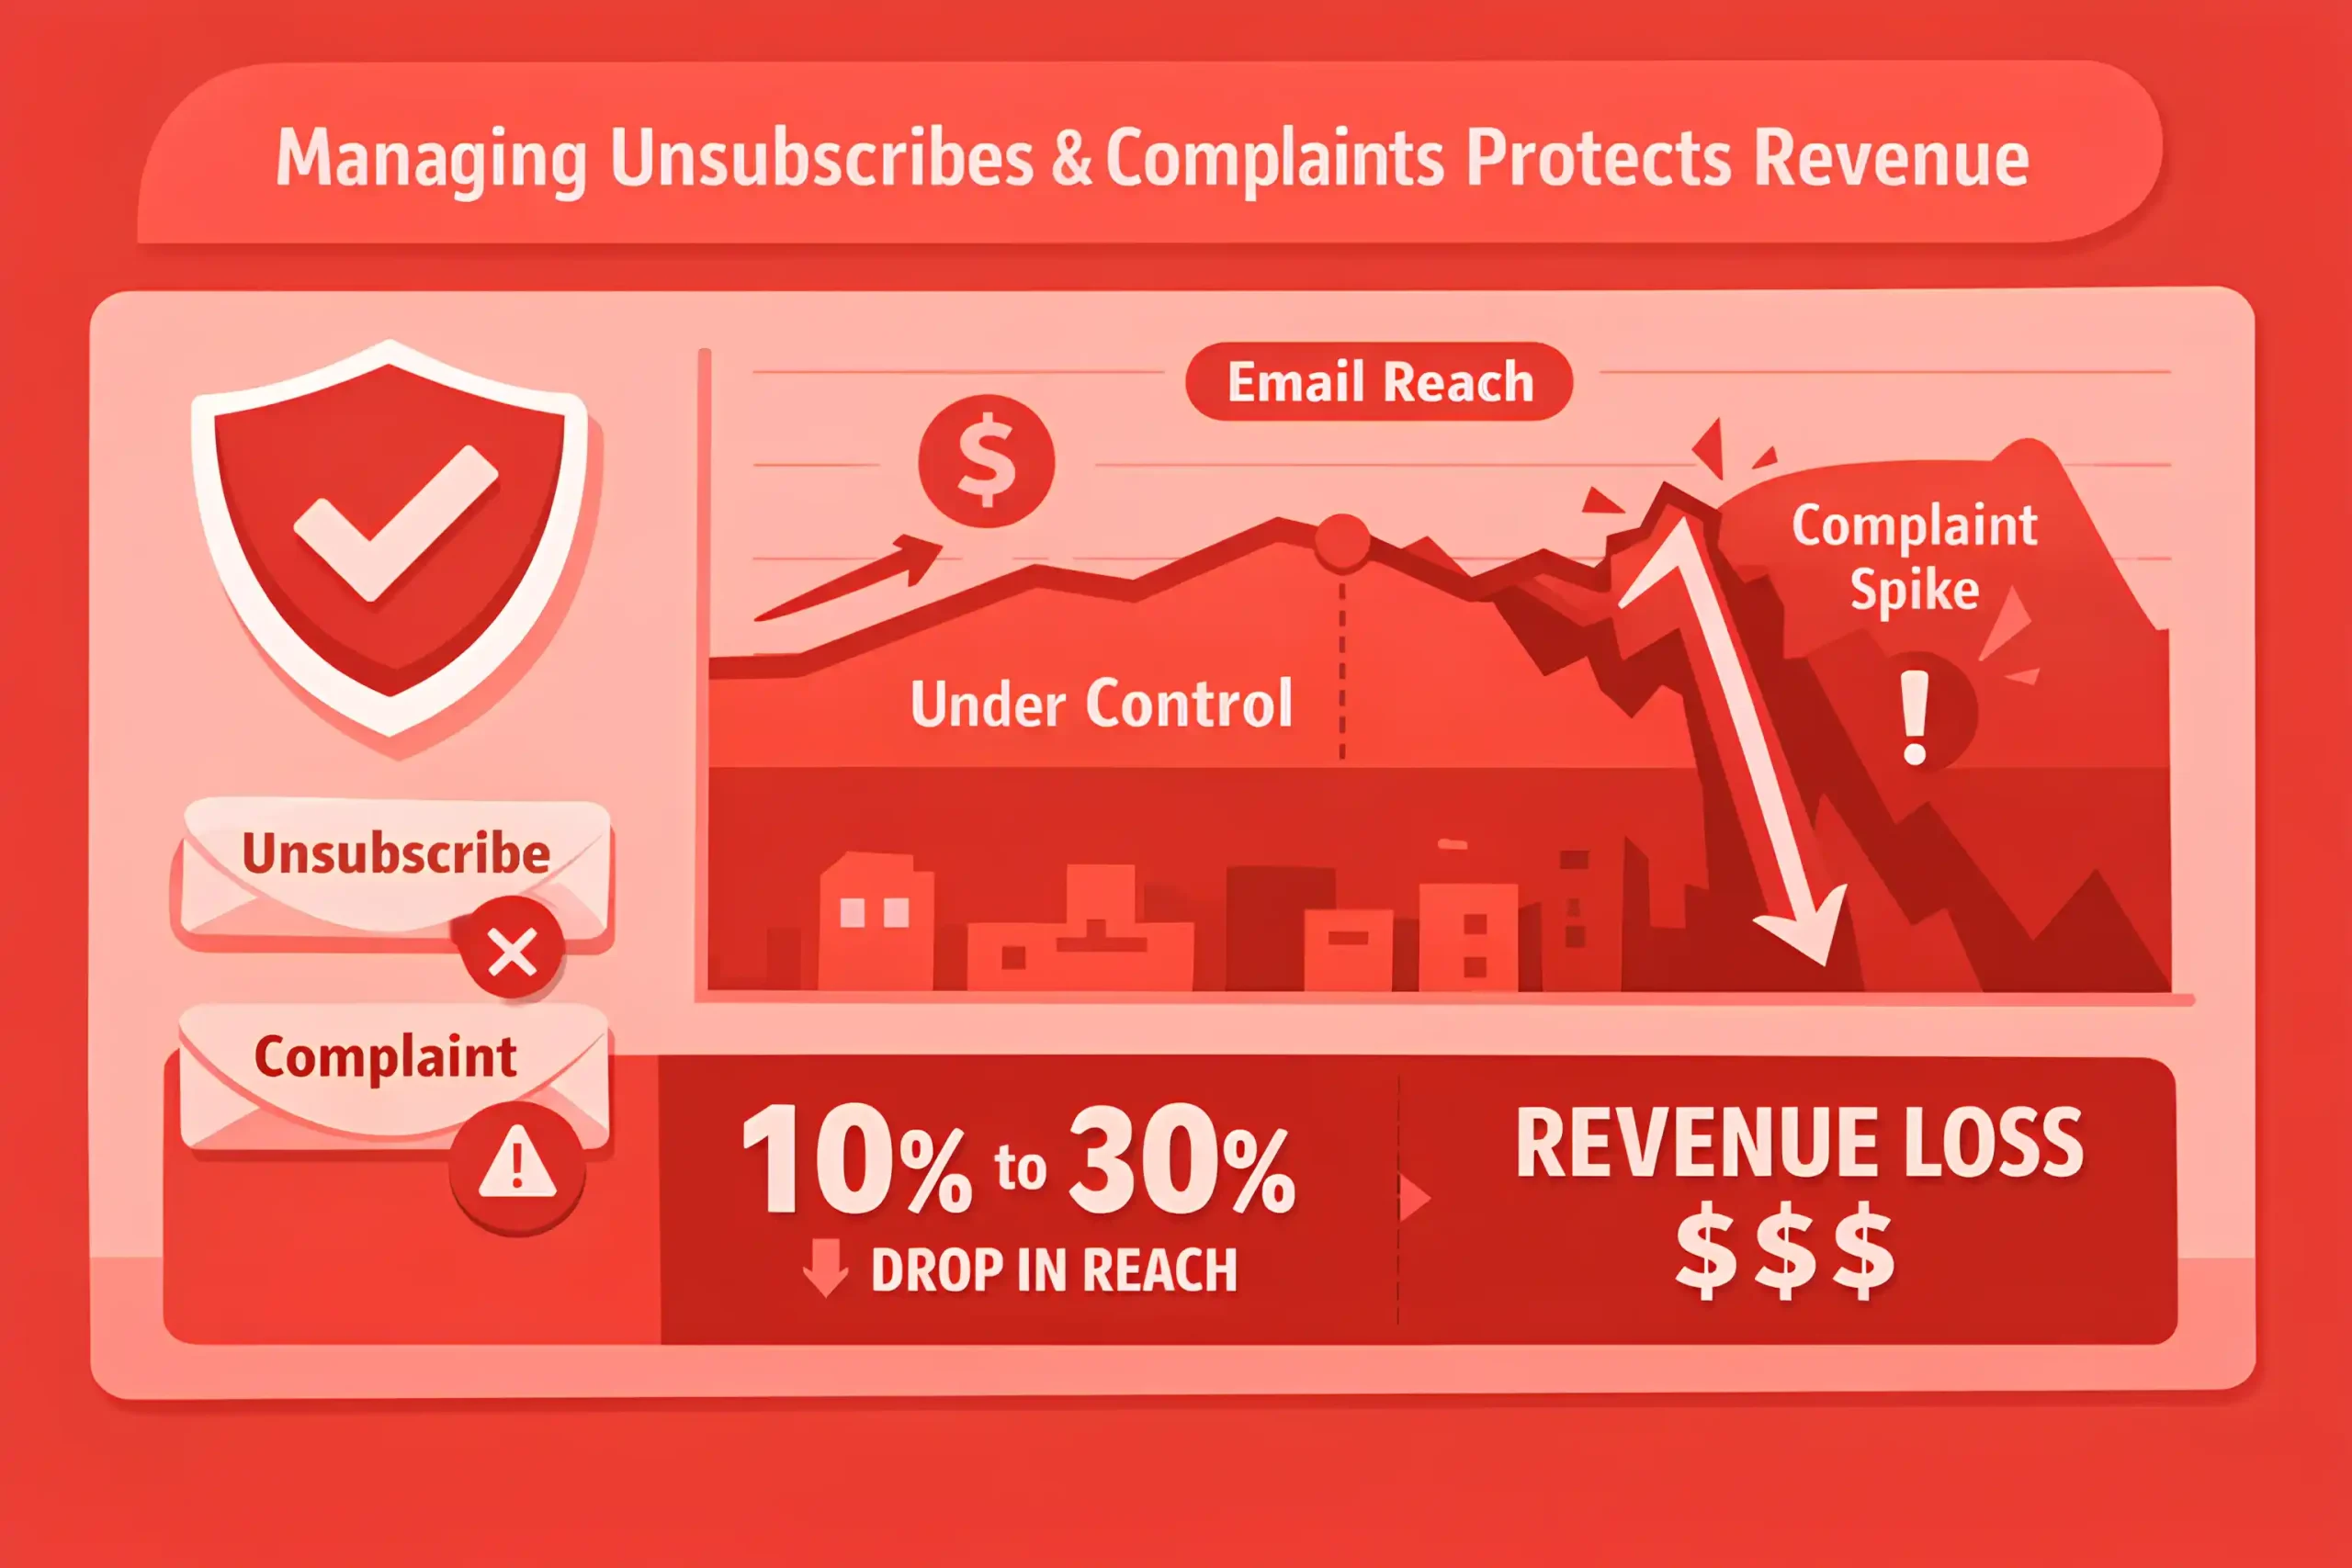
Unsubscribe and complaint control protects revenue, since complaint spikes can cut reach by 10% to 30% in a short window.
Teams that run structured A/B tests monthly often see 5% to 20% incremental revenue gains over a quarter, mostly from offer and timing improvements.
The Key Takeaways
Email performance is won on list quality. First, inbox placement and complaint rates are the clearest early signals because they determine how many subscribers see your campaigns.
Benchmarks help set expectations, but the targets that matter should come from your own baselines, tracked by cohort and segment; something well-structured email marketing services are built to support over time.
Automation should carry more of the workload than broadcasts. Lifecycle messages tend to convert better because timing and intent are built in, not guessed. Segmentation reinforces that by keeping content relevant, which protects retention and lifts clicks without increasing frequency.
Open rate is context, not the goal. Strong programs prioritize clicks, conversions, and revenue per delivered email, then tie each metric back to a clear decision so improvements are repeatable, not accidental.


