
SaaS growth is harder to justify than to headline. CAC is rising, payback periods are stretching, and too many companies still push acquisitions harder than retention, expansion, and efficiency.
NEWMEDIA.COM put together this collection to highlight what the data actually shows: where costs are climbing, how LTV shifts across models, which channels support efficient growth, and what benchmarks separate strong SaaS performance from expensive momentum.
Use these numbers to test assumptions, sharpen budget decisions, and evaluate growth with more discipline. In SaaS, real progress is not just faster growth. It is growth with durable economics.
Also read: 150+ eCommerce Marketing Statistics
Customer Acquisition Cost Statistics for SaaS
Average SaaS CAC increased roughly 14 to 18% between 2024 and 2025.
B2B SaaS companies now spend about 11 to 13% of ARR on customer acquisition on average.
Enterprise SaaS CAC is often 3 to 5× higher than SMB SaaS CAC due to longer sales cycles.
Paid search CAC for SaaS rose roughly 12% YoY in 2025 across competitive categories, which makes PPC management essential.
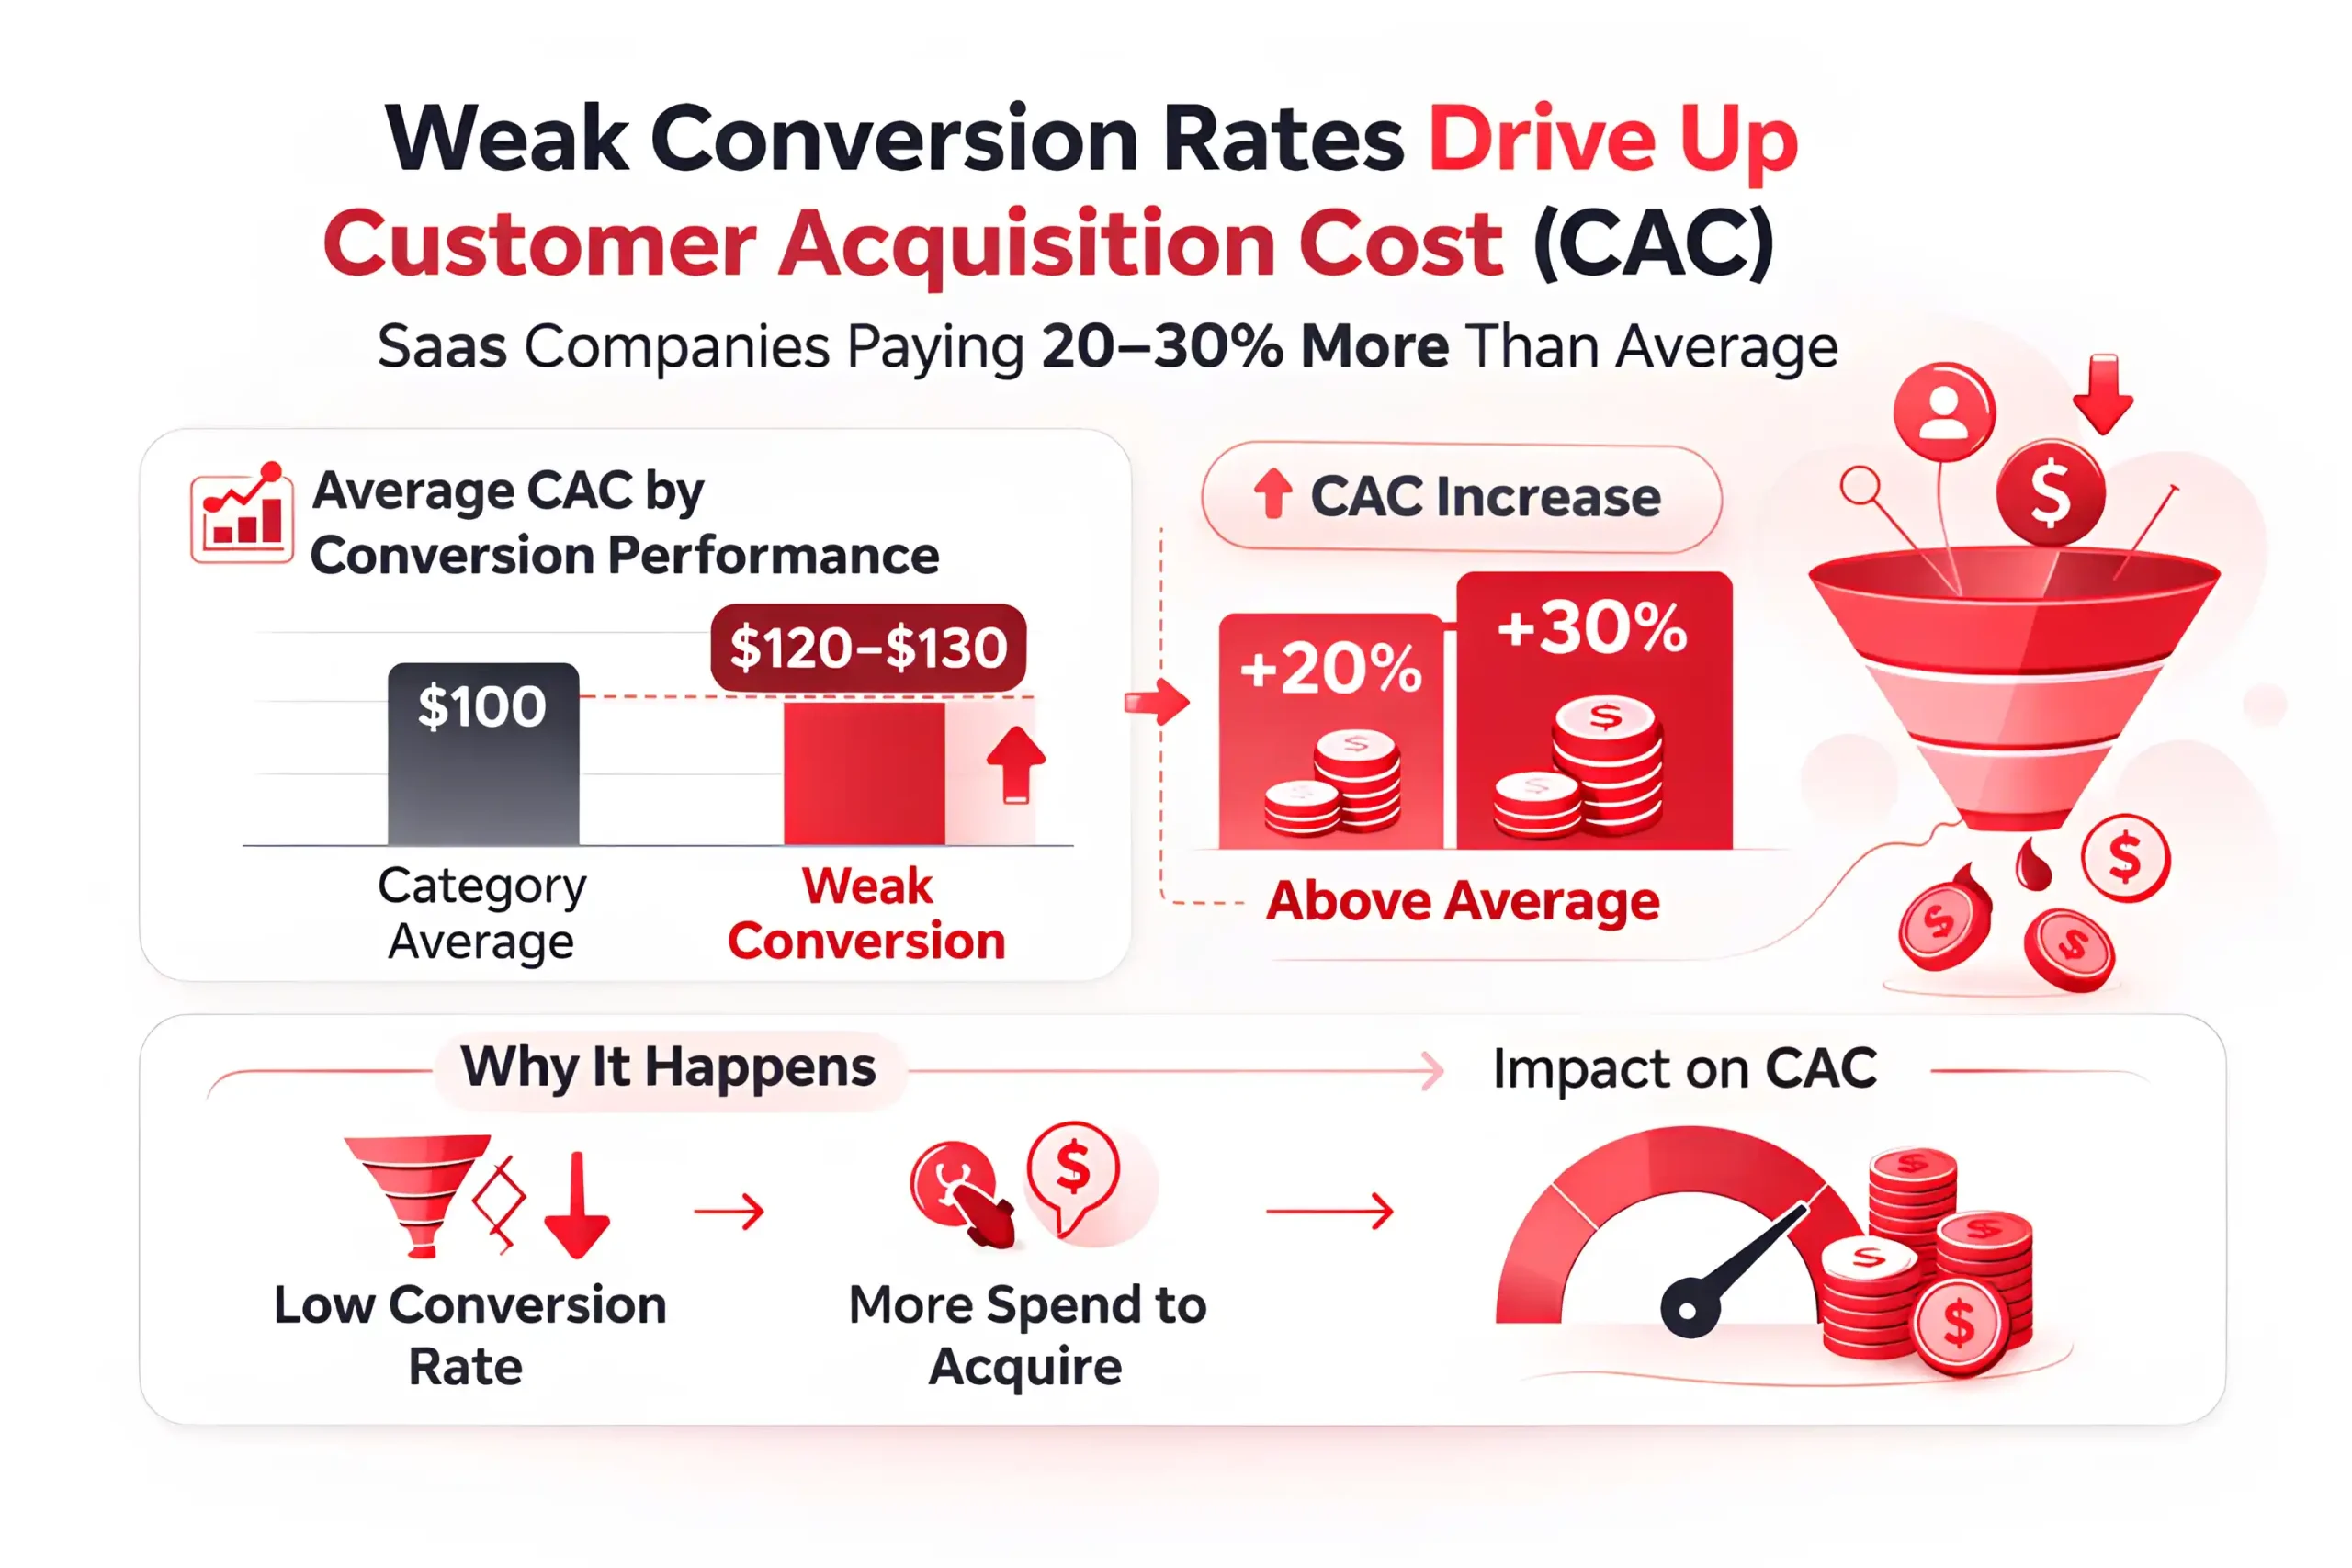
SaaS companies with weak conversion rates often carry 20 to 30% higher CAC than category averages.
Organic-led SaaS brands report roughly 28% lower blended CAC than paid-heavy competitors, strongly supporting linking to SaaS SEO.
Product-led SaaS companies often reduce CAC by 18 to 25% compared with sales-led models.
SaaS CAC from outbound sales is typically 35 to 45% higher than inbound acquisition.
Companies with strong brand search demand see about 22% lower paid CAC.
Referral-driven SaaS acquisition delivers roughly 30% lower CAC than paid social in most segments.
Mid-market SaaS CAC commonly ranges from $450 to $900 per customer, depending on channel mix.
Enterprise SaaS CAC often exceeds $7,000 per customer when sales and marketing costs are fully loaded.
Free-trial SaaS funnels reduce top-of-funnel CAC but can raise cost per activated user by 10 to 15%.
SaaS firms with poor lead qualification waste roughly 17% of acquisition spend on low-fit prospects.
Paid social CAC in SaaS is often 18 to 25% higher than paid search for high-intent categories.
SaaS companies with strong remarketing programs see about 14% lower blended CAC.
Email nurture workflows can reduce CAC by roughly 9 to 12% by improving lead-to-customer conversion.
Brands that align sales and marketing tightly report about 16% lower acquisition costs.
CAC payback pressure is rising, with many SaaS firms now targeting under 18 months as a core benchmark.
High-efficiency SaaS companies reduce CAC by roughly 18 to 22% by improving funnel conversion rather than cutting spend.
Useful to know: 100+ Reputation Management Statistics
LTV Statistics for SaaS
Average SaaS LTV is roughly 3.5 to 4.5× CAC in healthy growth-stage companies.
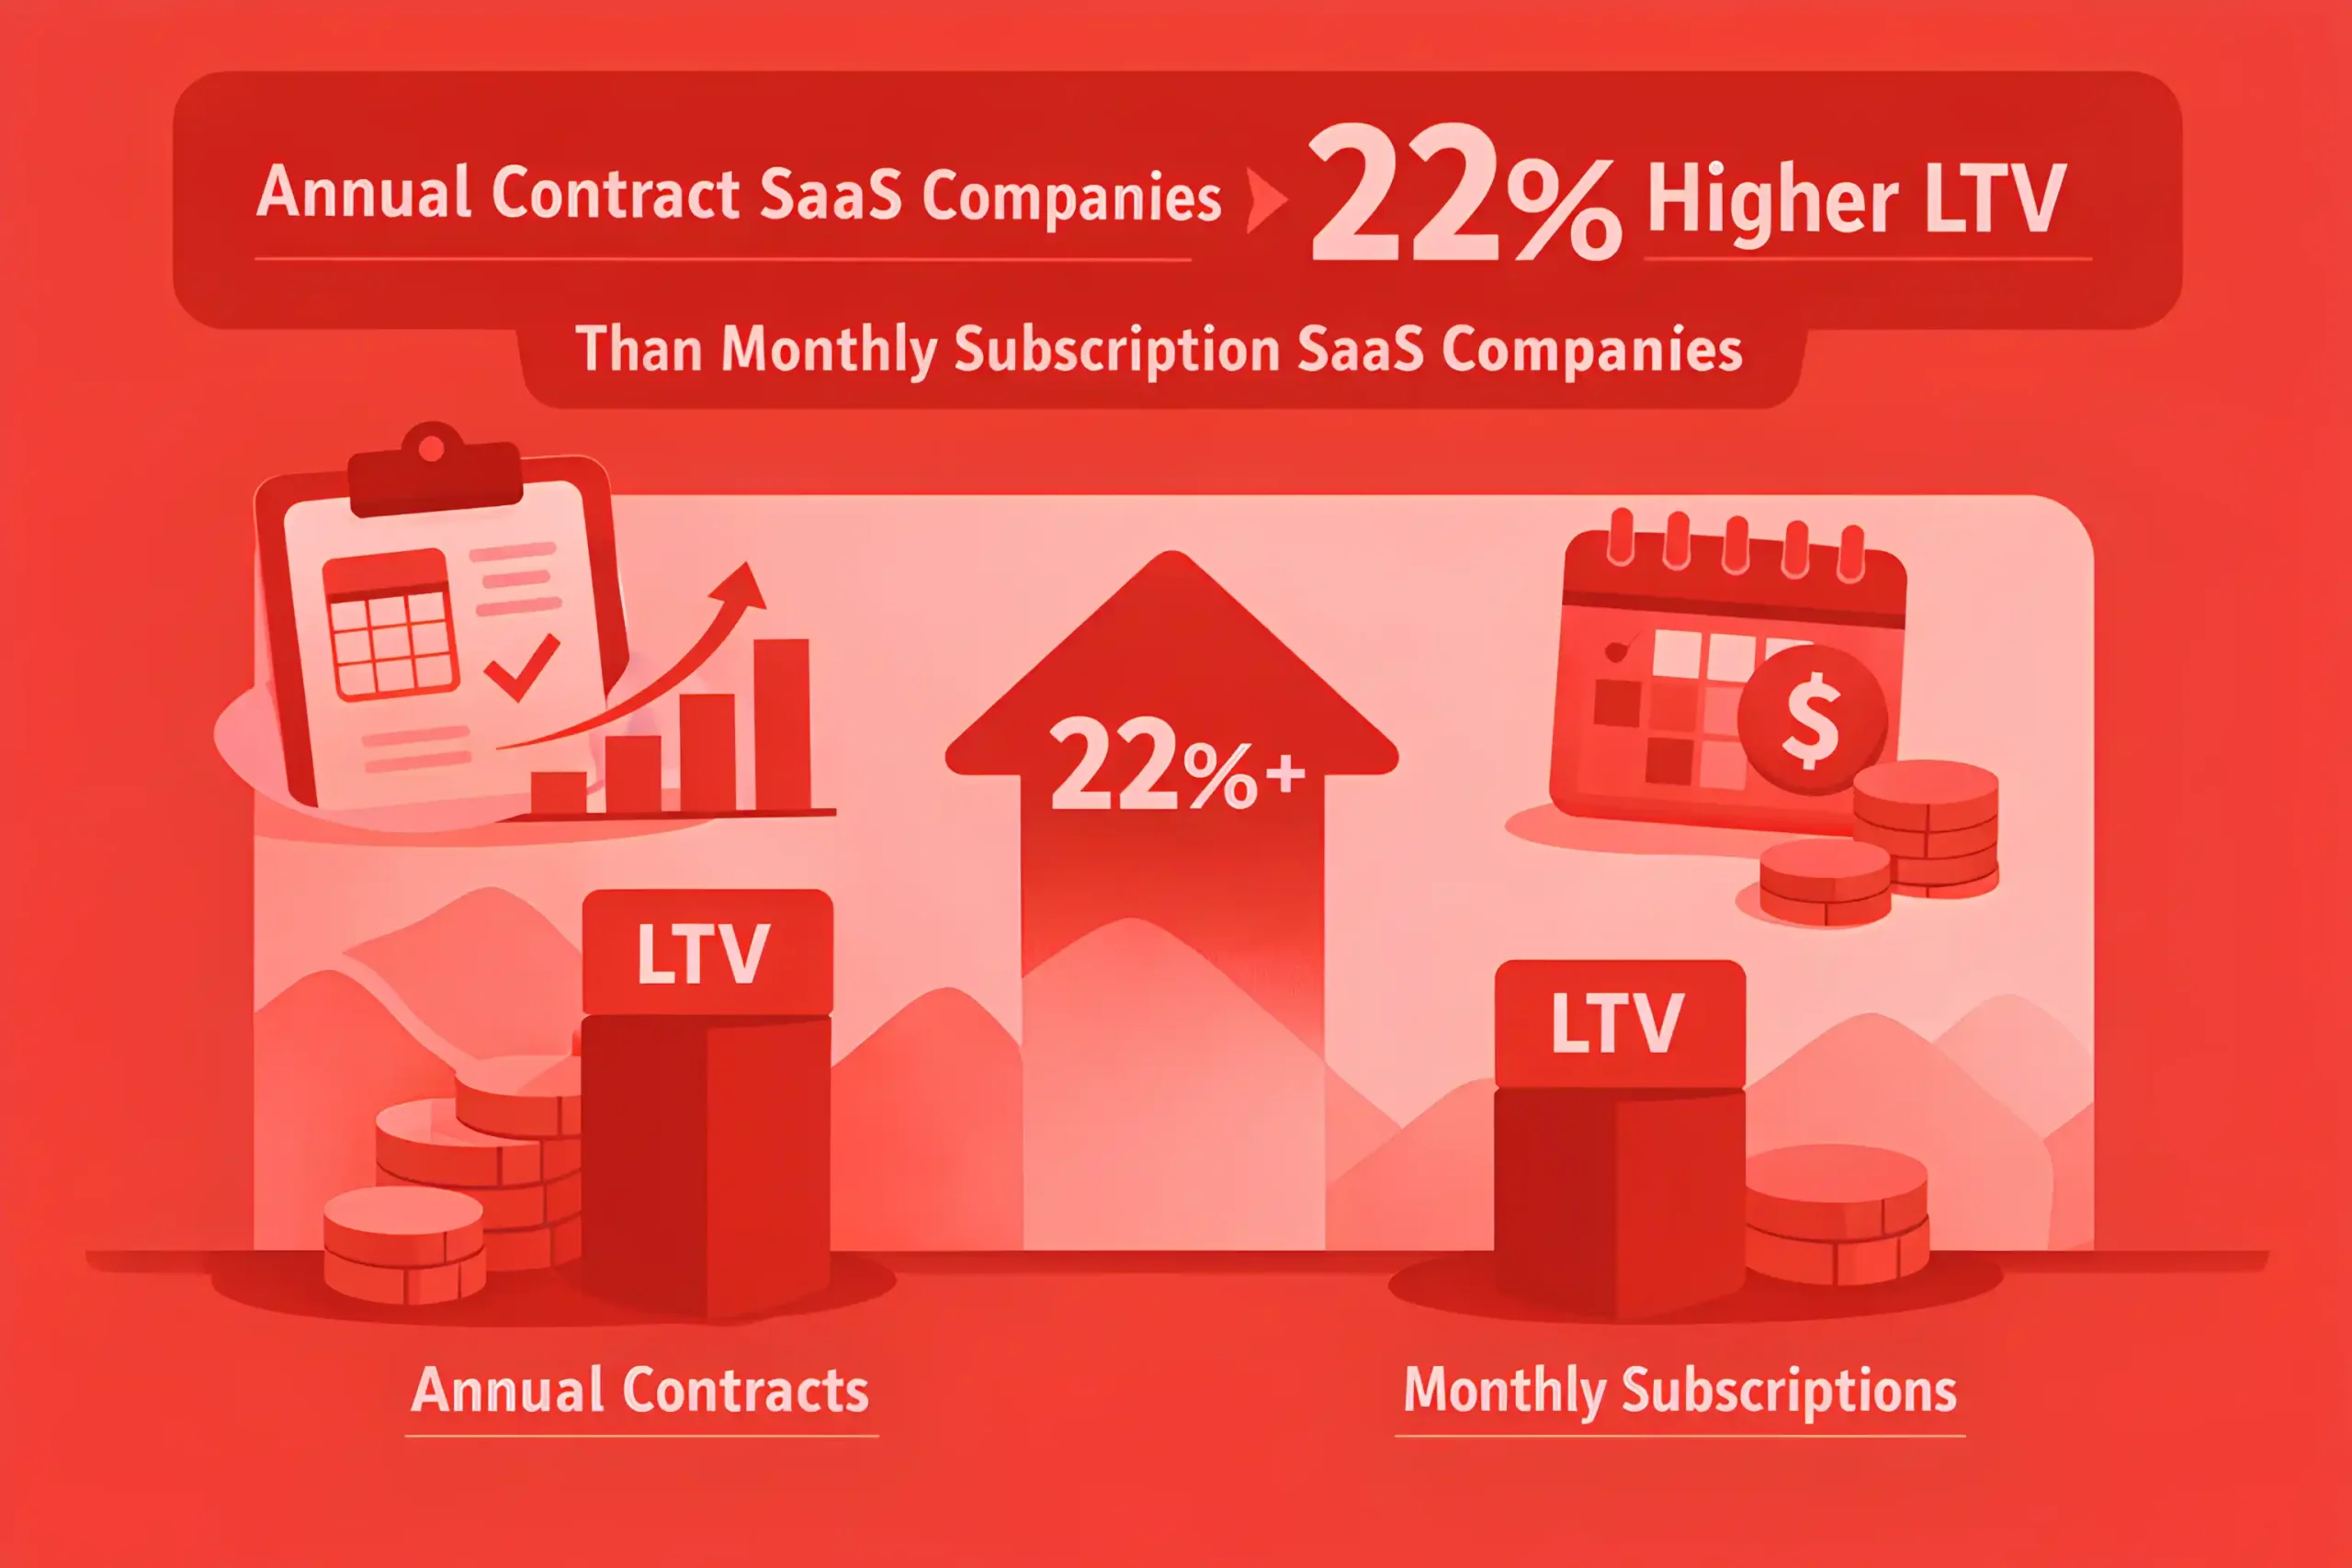
SaaS companies with annual contracts report about 22% higher LTV than monthly-first businesses.
Enterprise SaaS customers typically generate 3 to 6× higher LTV than SMB accounts.
SaaS brands with strong onboarding see roughly 18% higher customer lifetime value.
A 5% improvement in retention can increase SaaS LTV by 20 to 30%, which supports a broader digital marketing strategy approach.
Product-led SaaS companies often achieve 15 to 20% higher LTV through stronger activation and expansion, making it a strong place to link SaaS web design.
SaaS businesses with net revenue retention above 110% report roughly 25% stronger LTV performance.
Customers acquired through referrals deliver about 16% higher LTV than paid-only cohorts.
SaaS companies with multi-product adoption see roughly 1.7× higher LTV than single-product customers.
Accounts that reach full activation in the first 30 days show about 21% higher long-term value.
SaaS companies with annual prepay plans reduce churn enough to lift LTV by roughly 19%.
Expansion revenue contributes about 18 to 25% of total LTV in mature SaaS businesses.
High-touch customer success programs improve LTV by roughly 14% in mid-market and enterprise SaaS.
SaaS customers who adopt three or more core features generate about 24% higher lifetime value.
Companies with poor early retention often lose 30 to 40% of potential LTV in the first six months.
SaaS businesses with usage-based pricing report roughly 12 to 18% higher LTV when expansion is strong.
Customers acquired through content and organic search often produce about 13% higher LTV than paid social leads.
SaaS companies with strong upsell paths generate roughly 20% more LTV per account over time.
Teams that segment retention by customer cohort improve LTV forecasting accuracy by about 17%.
Best-in-class SaaS companies generate roughly 25% higher LTV by improving retention and reducing churn.
Don’t miss out: 100+ Content Marketing Statistics
Growth & Revenue Metrics Statistics
Healthy SaaS companies target 20 to 30% annual revenue growth beyond the early startup stage.
Top-performing SaaS firms sustain net revenue retention above 110% as a growth benchmark.
SaaS companies with strong expansion revenue grow roughly 1.4× faster than those relying only on new acquisitions.
Monthly recurring revenue growth for healthy mid-stage SaaS businesses often ranges from 2.5% to 4.5%.
Annual contract models generate about 18% more predictable revenue than monthly-heavy pricing structures.
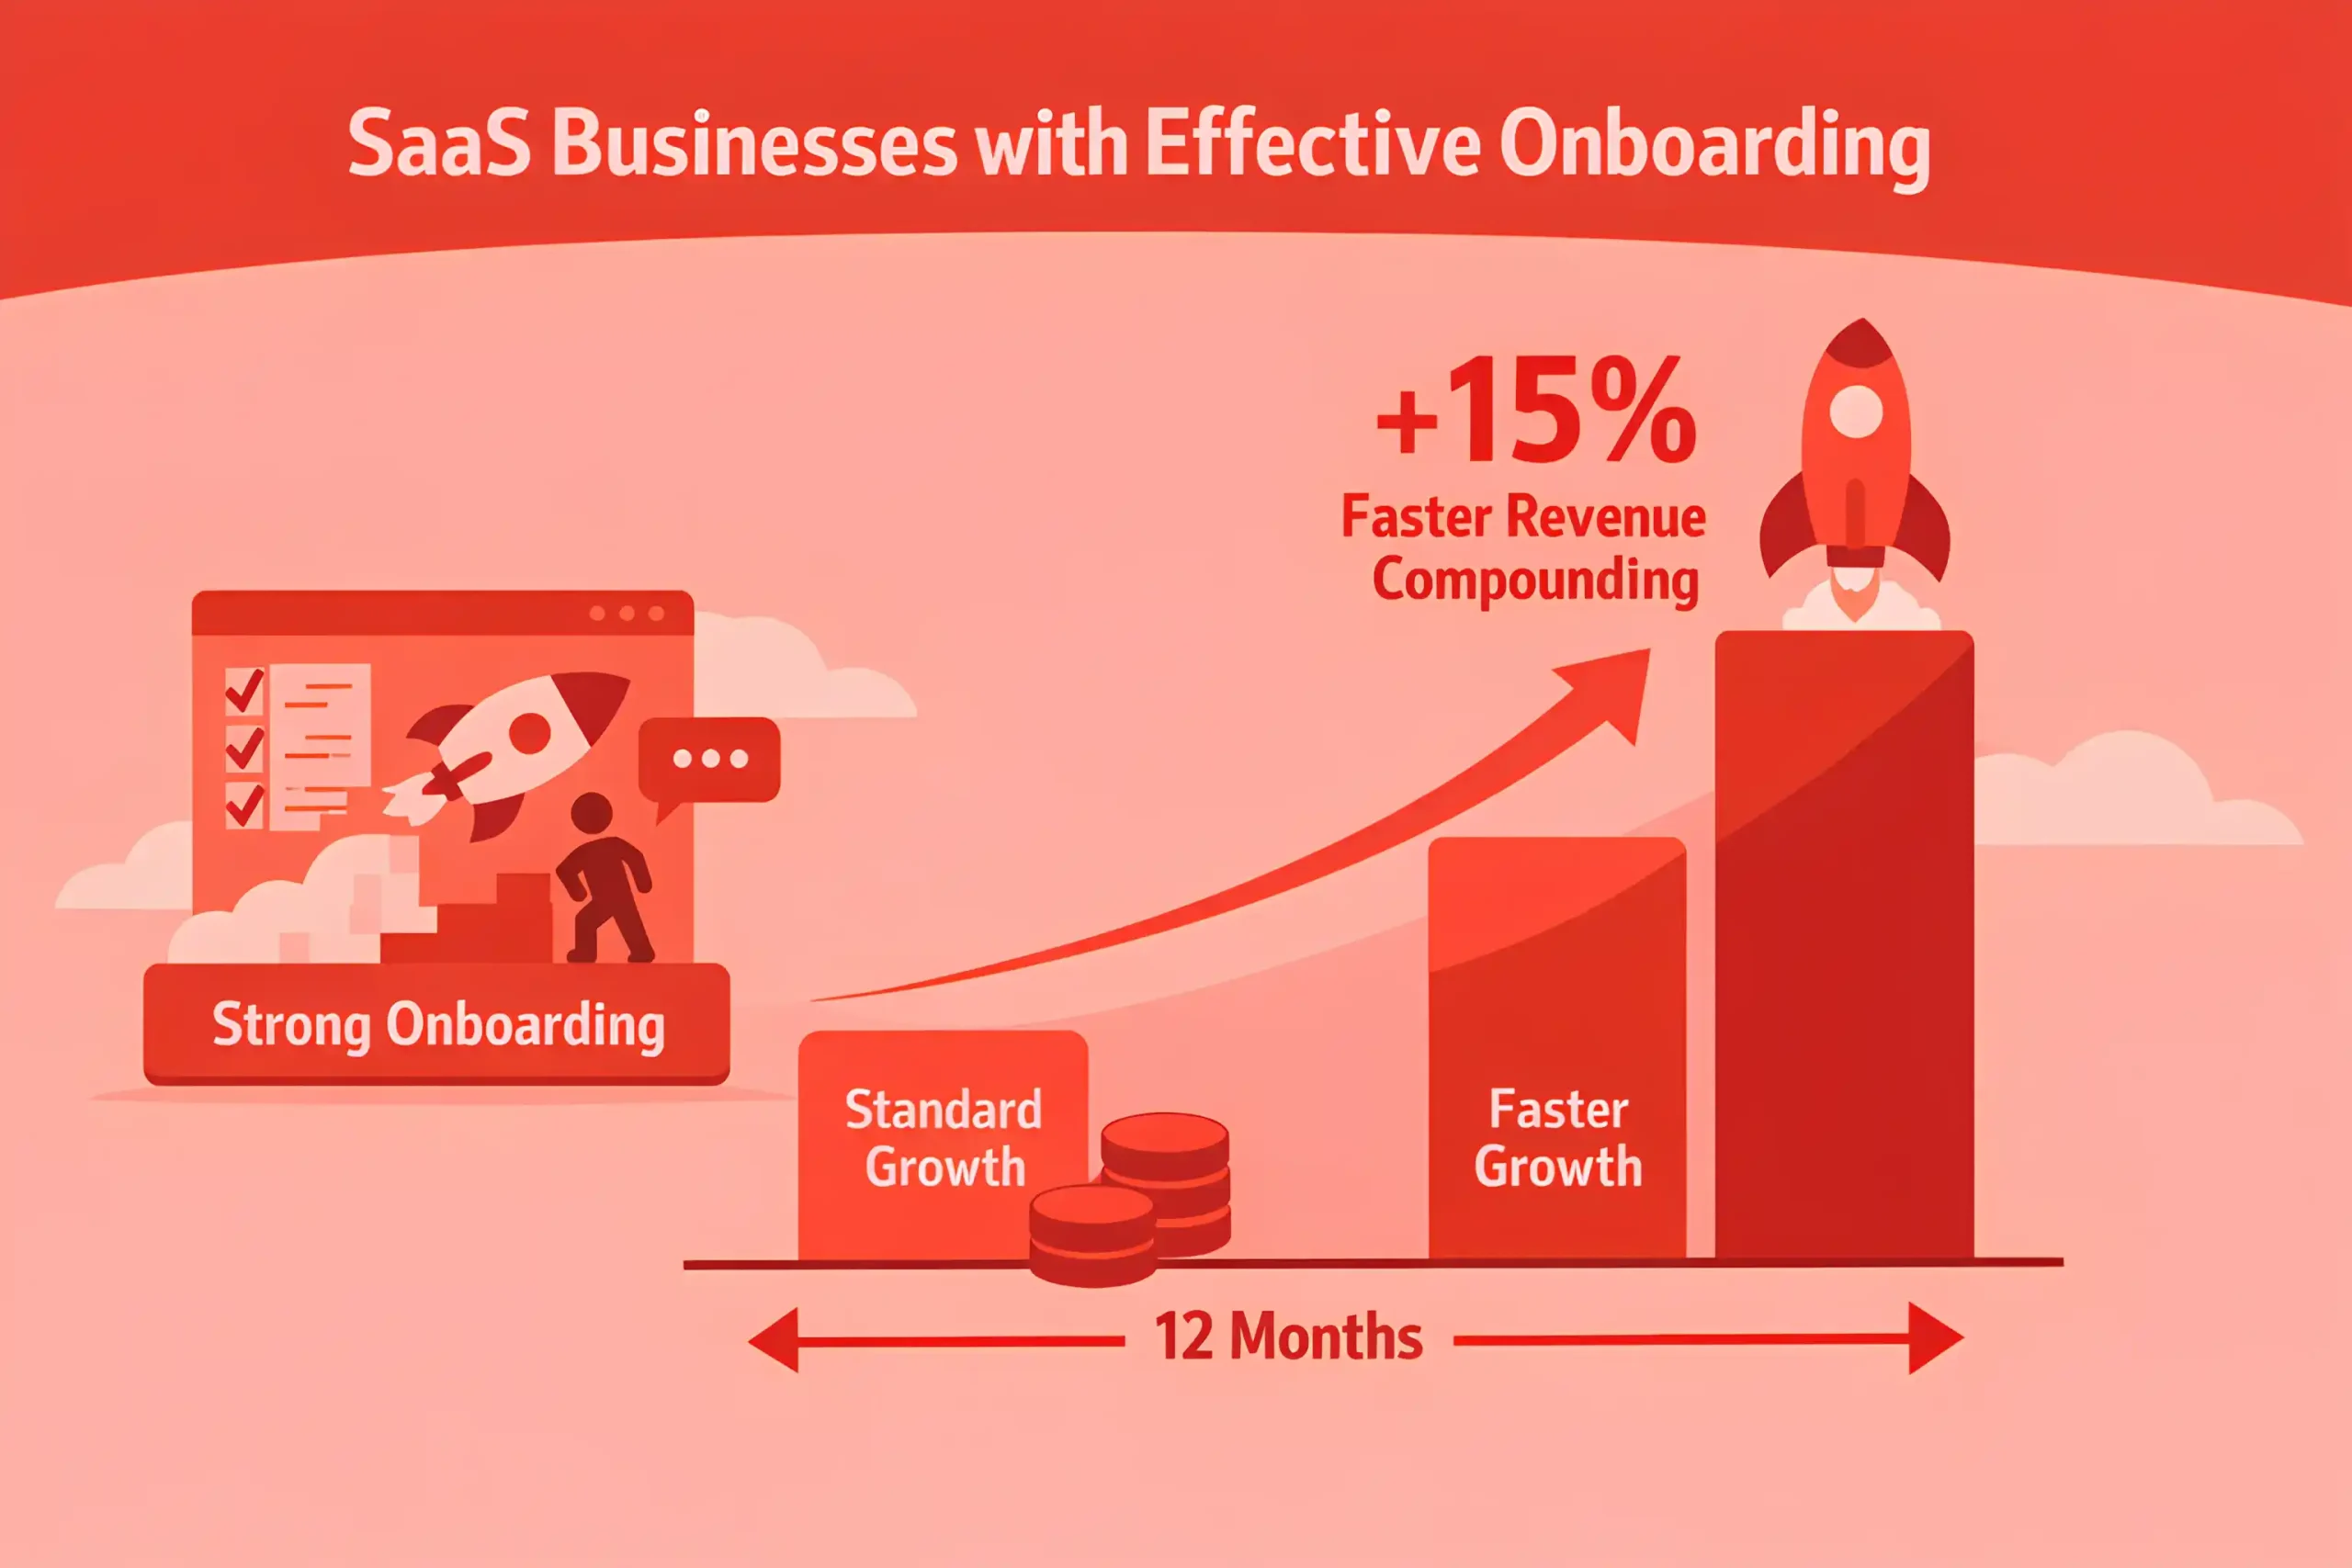
SaaS businesses with strong onboarding see roughly 15% faster revenue compounding over 12 months.
Companies with payback periods under 12 months typically scale more efficiently than peers with longer recovery cycles.
Expansion revenue contributes about 20 to 30% of total growth in mature SaaS companies.
SaaS brands with churn below 5% annually report roughly 22% stronger long-term revenue performance.
Product-led SaaS businesses often convert free users into paid revenue at 3 to 7%, depending on category and pricing.
SaaS firms with usage-based pricing report about 12% higher revenue per account when adoption expands over time.
High-growth SaaS companies often generate over 40% of new ARR from existing customer expansion.
Businesses with multi-product offerings see roughly 25% higher average revenue per customer than single-product companies.
SaaS firms that align sales, marketing, and customer success report about 17% stronger revenue efficiency.
Companies with strong retention and upsell motion can grow revenue without matching that pace in acquisition spend, making CRO a clean supporting link.
SaaS teams with accurate forecasting improve revenue planning precision by roughly 14%.
Enterprise SaaS businesses often grow slower in logo count but faster in revenue due to higher contract values.
SaaS companies with disciplined pricing reviews improve annual revenue yield by about 8 to 10%.
SaaS companies where growth outpaces retention see revenue efficiency fall by roughly 15 to 20%, especially in paid-heavy models.
SaaS companies that balance acquisition, retention, pricing, and expansion grow 24% more efficiently than those relying on a single lever.
Conversion Funnel & Sales Efficiency Statistics
Average visitor-to-lead conversion rates in SaaS range from 2.3% to 5.1%.
SaaS landing pages with clear product value propositions convert roughly 18% better than vague feature-led pages.
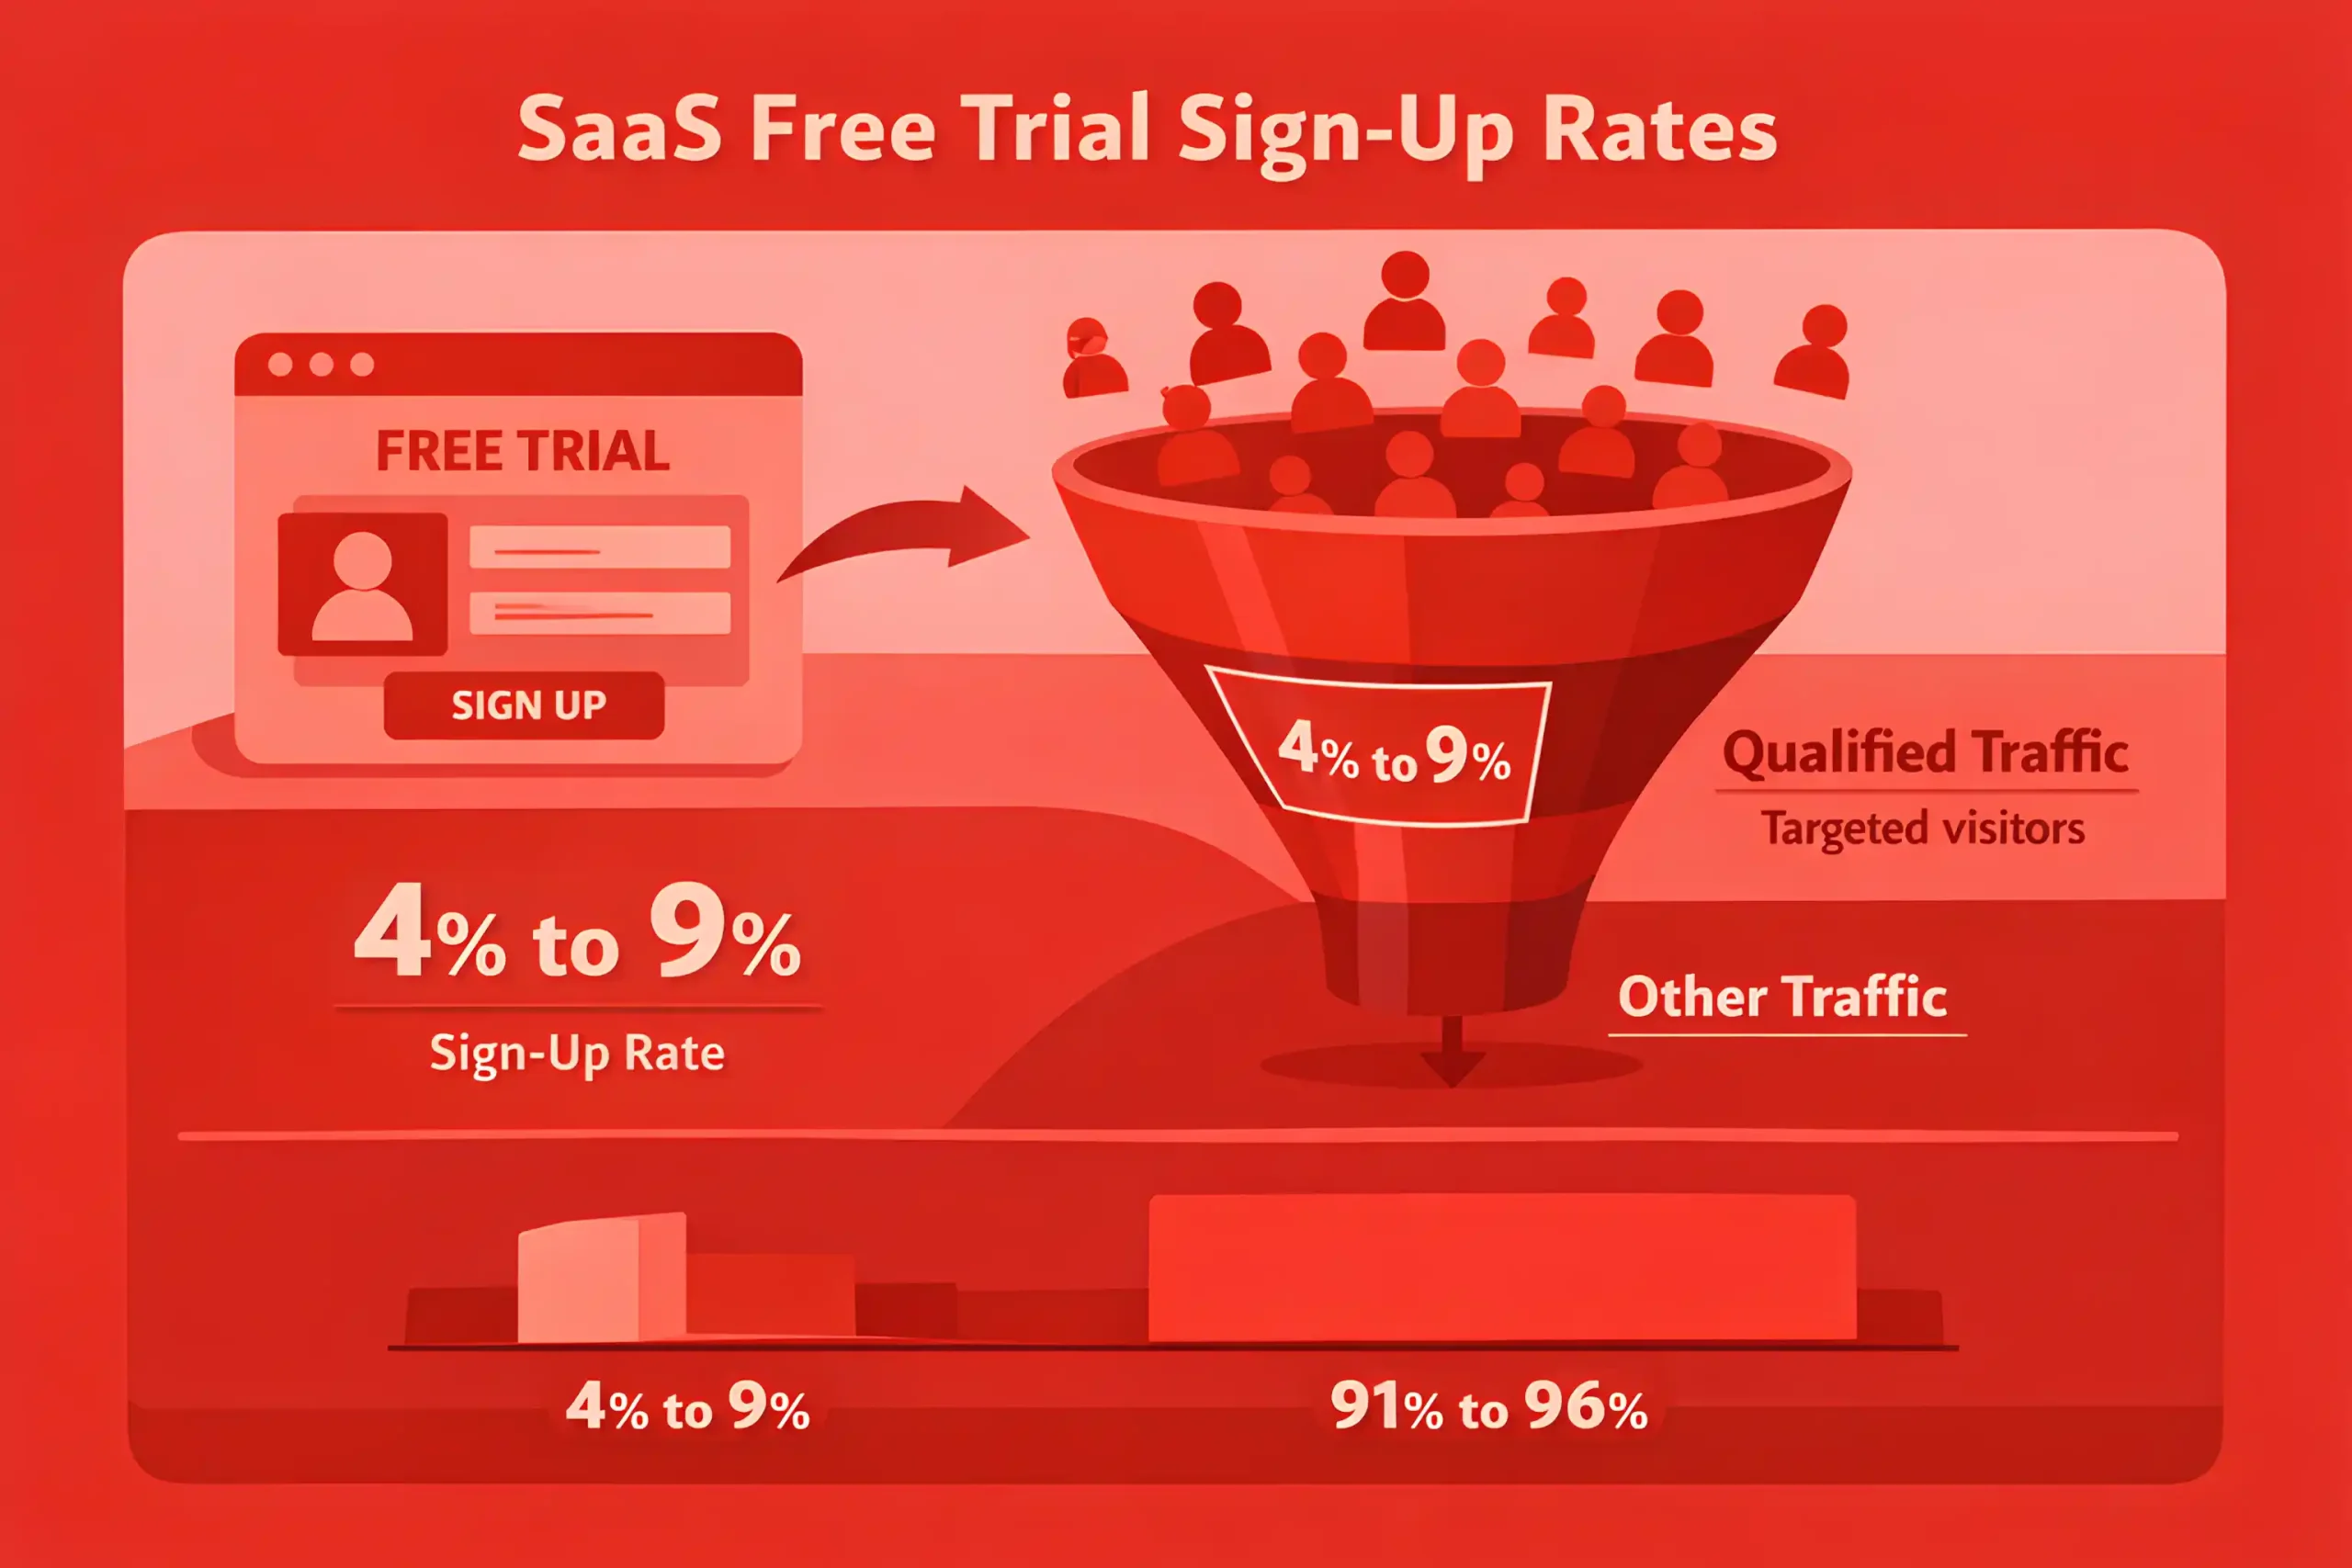
Free trial sign-up rates in SaaS typically range from 4% to 9% of qualified traffic.
Demo request funnels convert about 22 to 30% of qualified leads into sales opportunities.
SaaS companies with strong lead scoring improve sales efficiency by roughly 16%.
Lead-to-customer conversion rates in B2B SaaS often range from 5% to 12%, depending on deal size and sales complexity.
Product-led SaaS businesses often convert 3 to 7% of free users into paid customers.
Sales-led SaaS firms with multi-touch nurture flows generate about 14% higher opportunity conversion.
SaaS teams that respond to inbound demo requests within one hour see roughly 21% higher close rates.
Companies with poor MQL-to-SQL alignment waste about 15 to 20% of pipeline potential.
SaaS email nurture sequences improve lead-to-demo conversion by roughly 11 to 15%.
Shorter forms increase SaaS lead conversion rates by about 9 to 13% on high-intent pages.
Businesses that personalize demo follow-up see roughly 17% better sales conversion than generic sequences.
SaaS funnels with strong onboarding flows reduce early-stage drop-off by about 19%.
Teams that track funnel performance by channel improve sales efficiency by roughly 12%.
Trial users who complete key activation steps in the first week convert about 2× better than inactive users.
SaaS companies with sales cycles under 45 days report roughly 18% stronger pipeline efficiency than slower-moving peers.
Product-qualified leads often close at 20 to 30% higher rates than traditional marketing-qualified leads.
SaaS businesses using retargeting across the funnel improve demo recovery and re-engagement by about 10 to 14%.
Top-performing SaaS funnels improve lead quality, speed, activation, and sales handoff, driving 21% higher conversion efficiency across the funnel.
Read also: 100+ AI Agent Usage Statistics
Channel Performance & Marketing Spend Statistics
Paid search accounts for roughly 21% of SaaS marketing spend across growth-stage companies.
Content and SEO programs deliver about 27% lower blended CAC than paid-heavy channel mixes over time.
SaaS brands investing consistently in organic search generate roughly 31% more qualified inbound traffic.
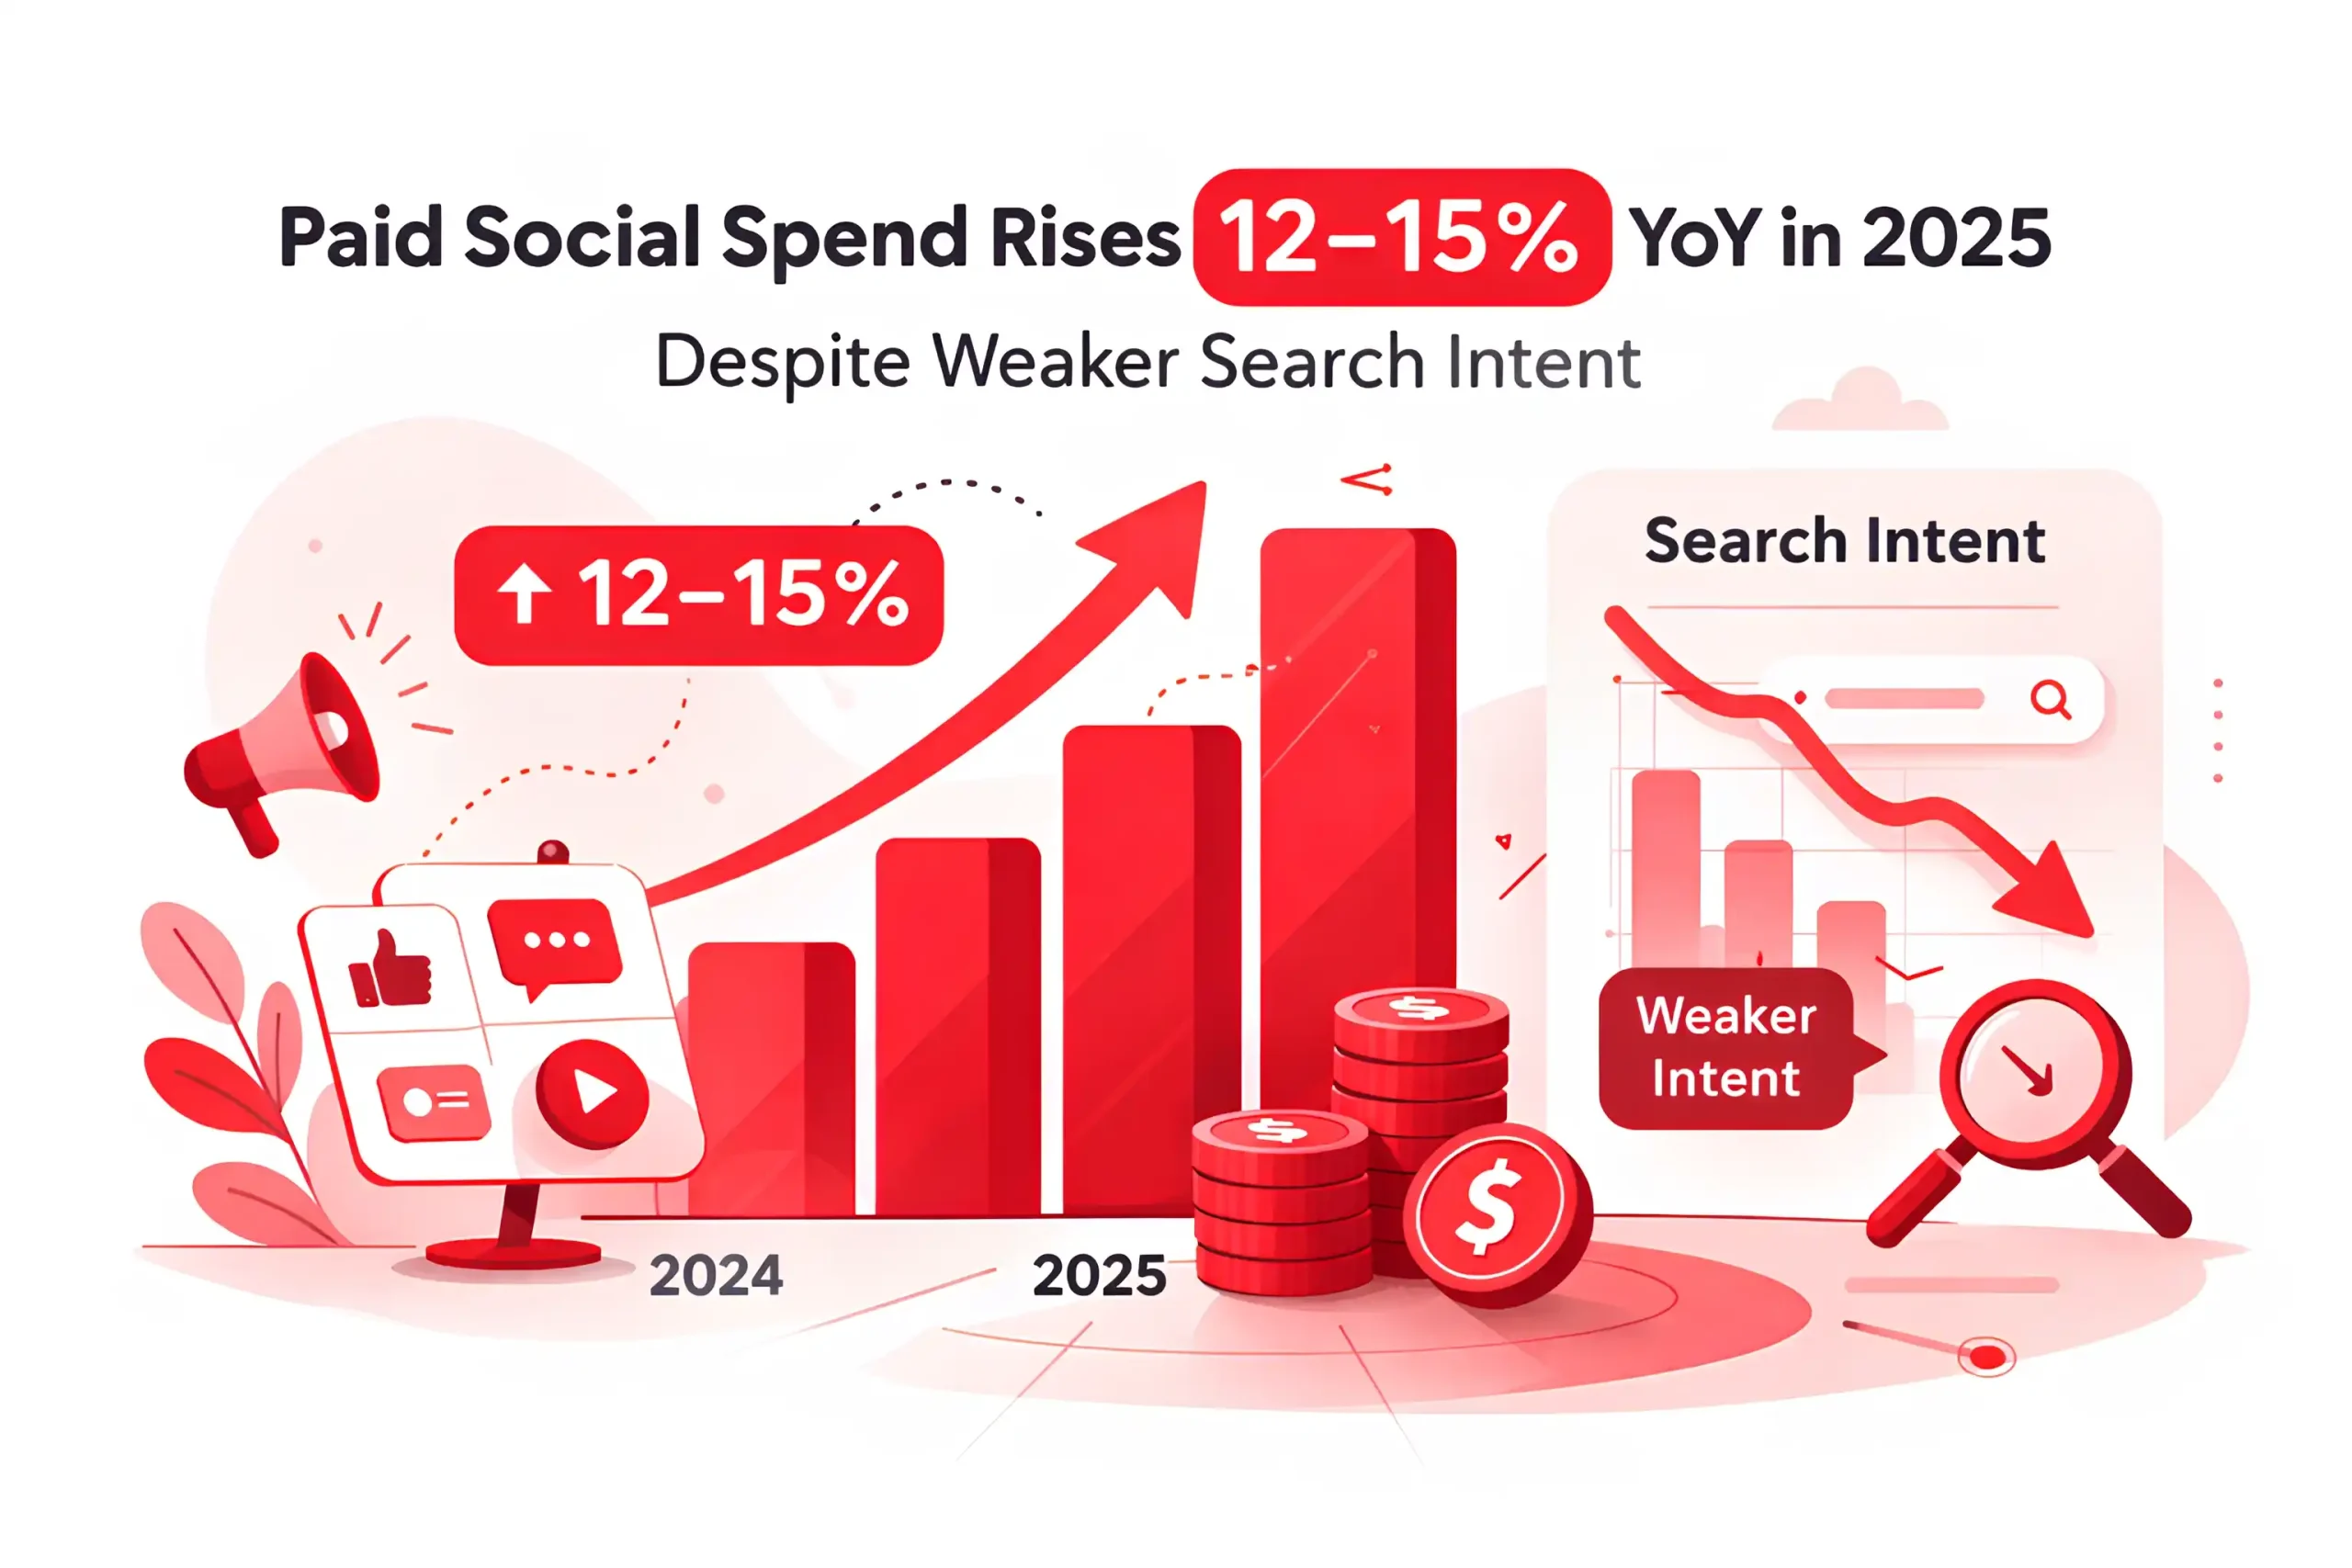
Paid social spend in SaaS increased about 12 to 15% YoY in 2025 despite weaker intent than search, which fits well with SaaS PPC.
Email remains one of the most efficient channels, influencing roughly 18% of SaaS pipeline revenue.
SaaS companies with multi-channel attribution report about 14% better budget efficiency than last-click-only teams.
Webinars and virtual events generate roughly 22% higher lead quality than broad paid social campaigns.
Referral programs deliver about 30% lower CAC than most paid acquisition channels.
Branded search campaigns convert roughly 3× better than non-branded SaaS search traffic.
SaaS teams allocating more than 15% of their budget to retargeting often improve conversion efficiency across the funnel.
Influencer and partner-led campaigns drive about 17% higher trust-based engagement in niche B2B categories.
Organic LinkedIn content contributes roughly 11 to 14% of high-intent traffic for founder-led SaaS brands.
Paid social CPMs for SaaS rose about 9 to 11% in 2025, adding pressure to top-of-funnel efficiency.
SaaS companies combining SEO, paid search, and email generate roughly 24% stronger pipeline efficiency than single-channel programs.
Account-based marketing campaigns produce about 19% higher deal conversion rates in mid-market and enterprise SaaS.
Affiliate and partner channels contribute roughly 10 to 13% of the sourced pipeline for mature SaaS companies.
SaaS brands with strong review-site presence reduce paid acquisition dependence by about 16%.
Video-led demand generation campaigns increase branded search lift by roughly 12% over time.
Companies that rebalance spend quarterly based on channel efficiency improve marketing ROI by about 15%.
The most efficient SaaS teams improve efficiency by 19% prioritizing high-payback channels.
Related reading: 100+ Google Business Profile Statistics
The Key Takeaways
SaaS growth in 2026 is under more pressure than the headline numbers suggest. CAC is rising, funnels are harder to convert, and fast growth means little when retention, payback, and expansion fail to support it.
The strongest SaaS companies do not treat acquisition, LTV, and revenue as separate metrics. They manage them as one system, where channel mix, conversion efficiency, retention, and pricing all shape growth quality.
Real SaaS momentum comes from disciplined economics. The winners are not the companies that spend the most, but the ones that acquire efficiently, retain longer, and expand revenue without breaking profitability.


