E-commerce is harder to scale and easier to waste. Acquisition costs remain high, competition is relentless, and weak marketing shows up fast in margins.
In this collection of 150+ eCommerce marketing statistics, NEWMEDIA.COM focuses on what the data shows: which channels drive revenue, where conversion breaks down, how retention shapes profitability, and what consumer behavior is changing across paid media, email, social, search, and on-site experience.
Use these benchmarks to spot weak points, set stronger targets, and make better decisions across campaigns, content, and budget.
eCommerce Market Size, Growth, and Revenue Benchmarks
Global e-commerce sales are projected to exceed $7.4 trillion in 2025.
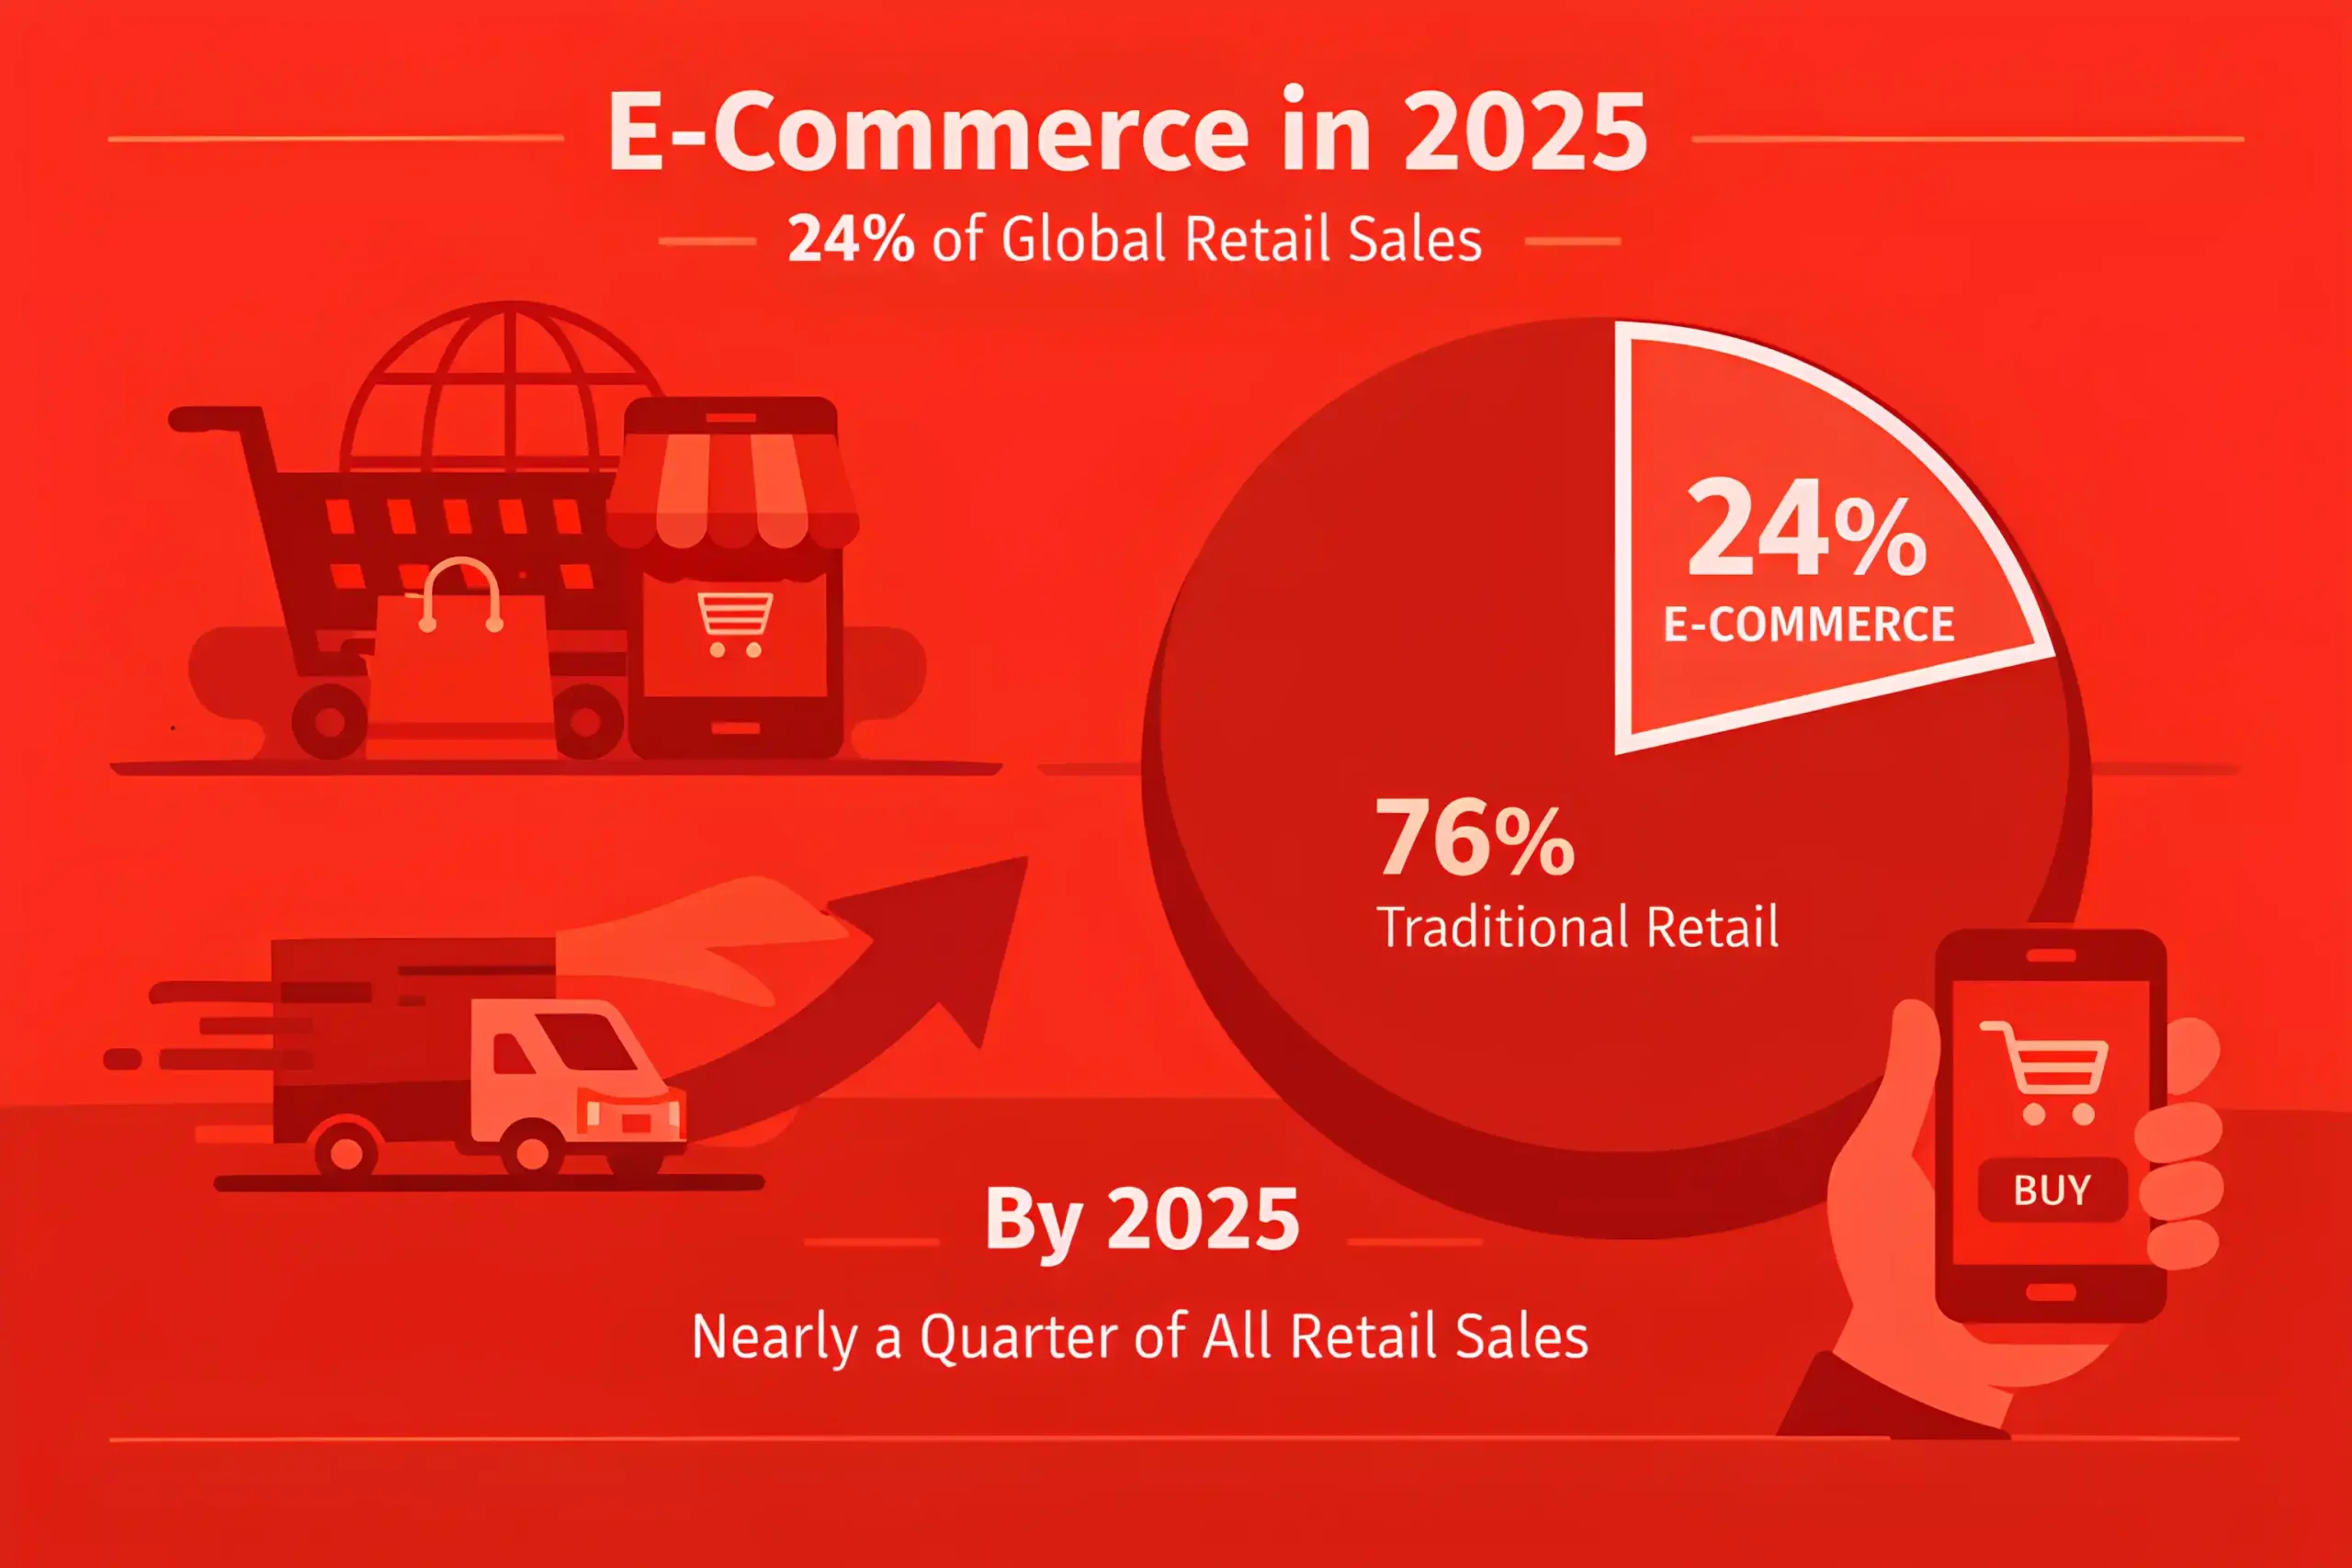
E-commerce is expected to account for roughly 24% of total global retail sales in 2025.
Year-over-year global e-commerce revenue is forecast to grow by 10 to 12% in 2025.
North America remains one of the highest-value eCommerce regions, with online retail sales expected to surpass $1.6 trillion.
Asia-Pacific continues to lead in scale, generating more than half of global e-commerce revenue.
Mobile commerce is projected to drive nearly 60% of all e-commerce transactions in 2025.
Average e-commerce revenue per user is expected to rise by about 8% year-over-year.
Cross-border eCommerce now accounts for roughly 22% of total online retail revenue.
Small and mid-sized eCommerce brands are expected to increase digital marketing spend by 9 to 11% in 2025.
Direct-to-consumer eCommerce revenue is projected to grow by around 14% year over year.
Subscription-based eCommerce models now generate roughly 18% more lifetime value than one-time purchase models, making conversion rate optimization more valuable.
Average order values in e-commerce are expected to rise by 6 to 7% in 2025, driven partly by inflation and bundling strategies.
Online marketplaces continue to dominate, capturing about 67% of total eCommerce sales volume.
First-party data-driven eCommerce brands report roughly 20% stronger revenue efficiency than brands relying heavily on paid acquisition alone, reinforcing the role of SEO.
Repeat customers now contribute around 42% of eCommerce revenue for high-performing online stores.
E-commerce brands with strong retention programs generate about 25% more annual revenue per customer.
Social commerce is expected to contribute more than $900 billion in global sales in 2025.
E-commerce brands investing in personalization see roughly 15% higher revenue per session than non-personalized stores.
Retailers with omnichannel eCommerce strategies report about 23% higher annual customer value than digital-only competitors.
High-growth eCommerce brands scale revenue about 2.3× faster by combining paid, owned, and retention channels.
Related reading: 100+ Google Business Profile Statistics
Customer Acquisition and Traffic Trends (SEO, Paid, Social)
Organic search drives roughly 32% of e-commerce website traffic on average.
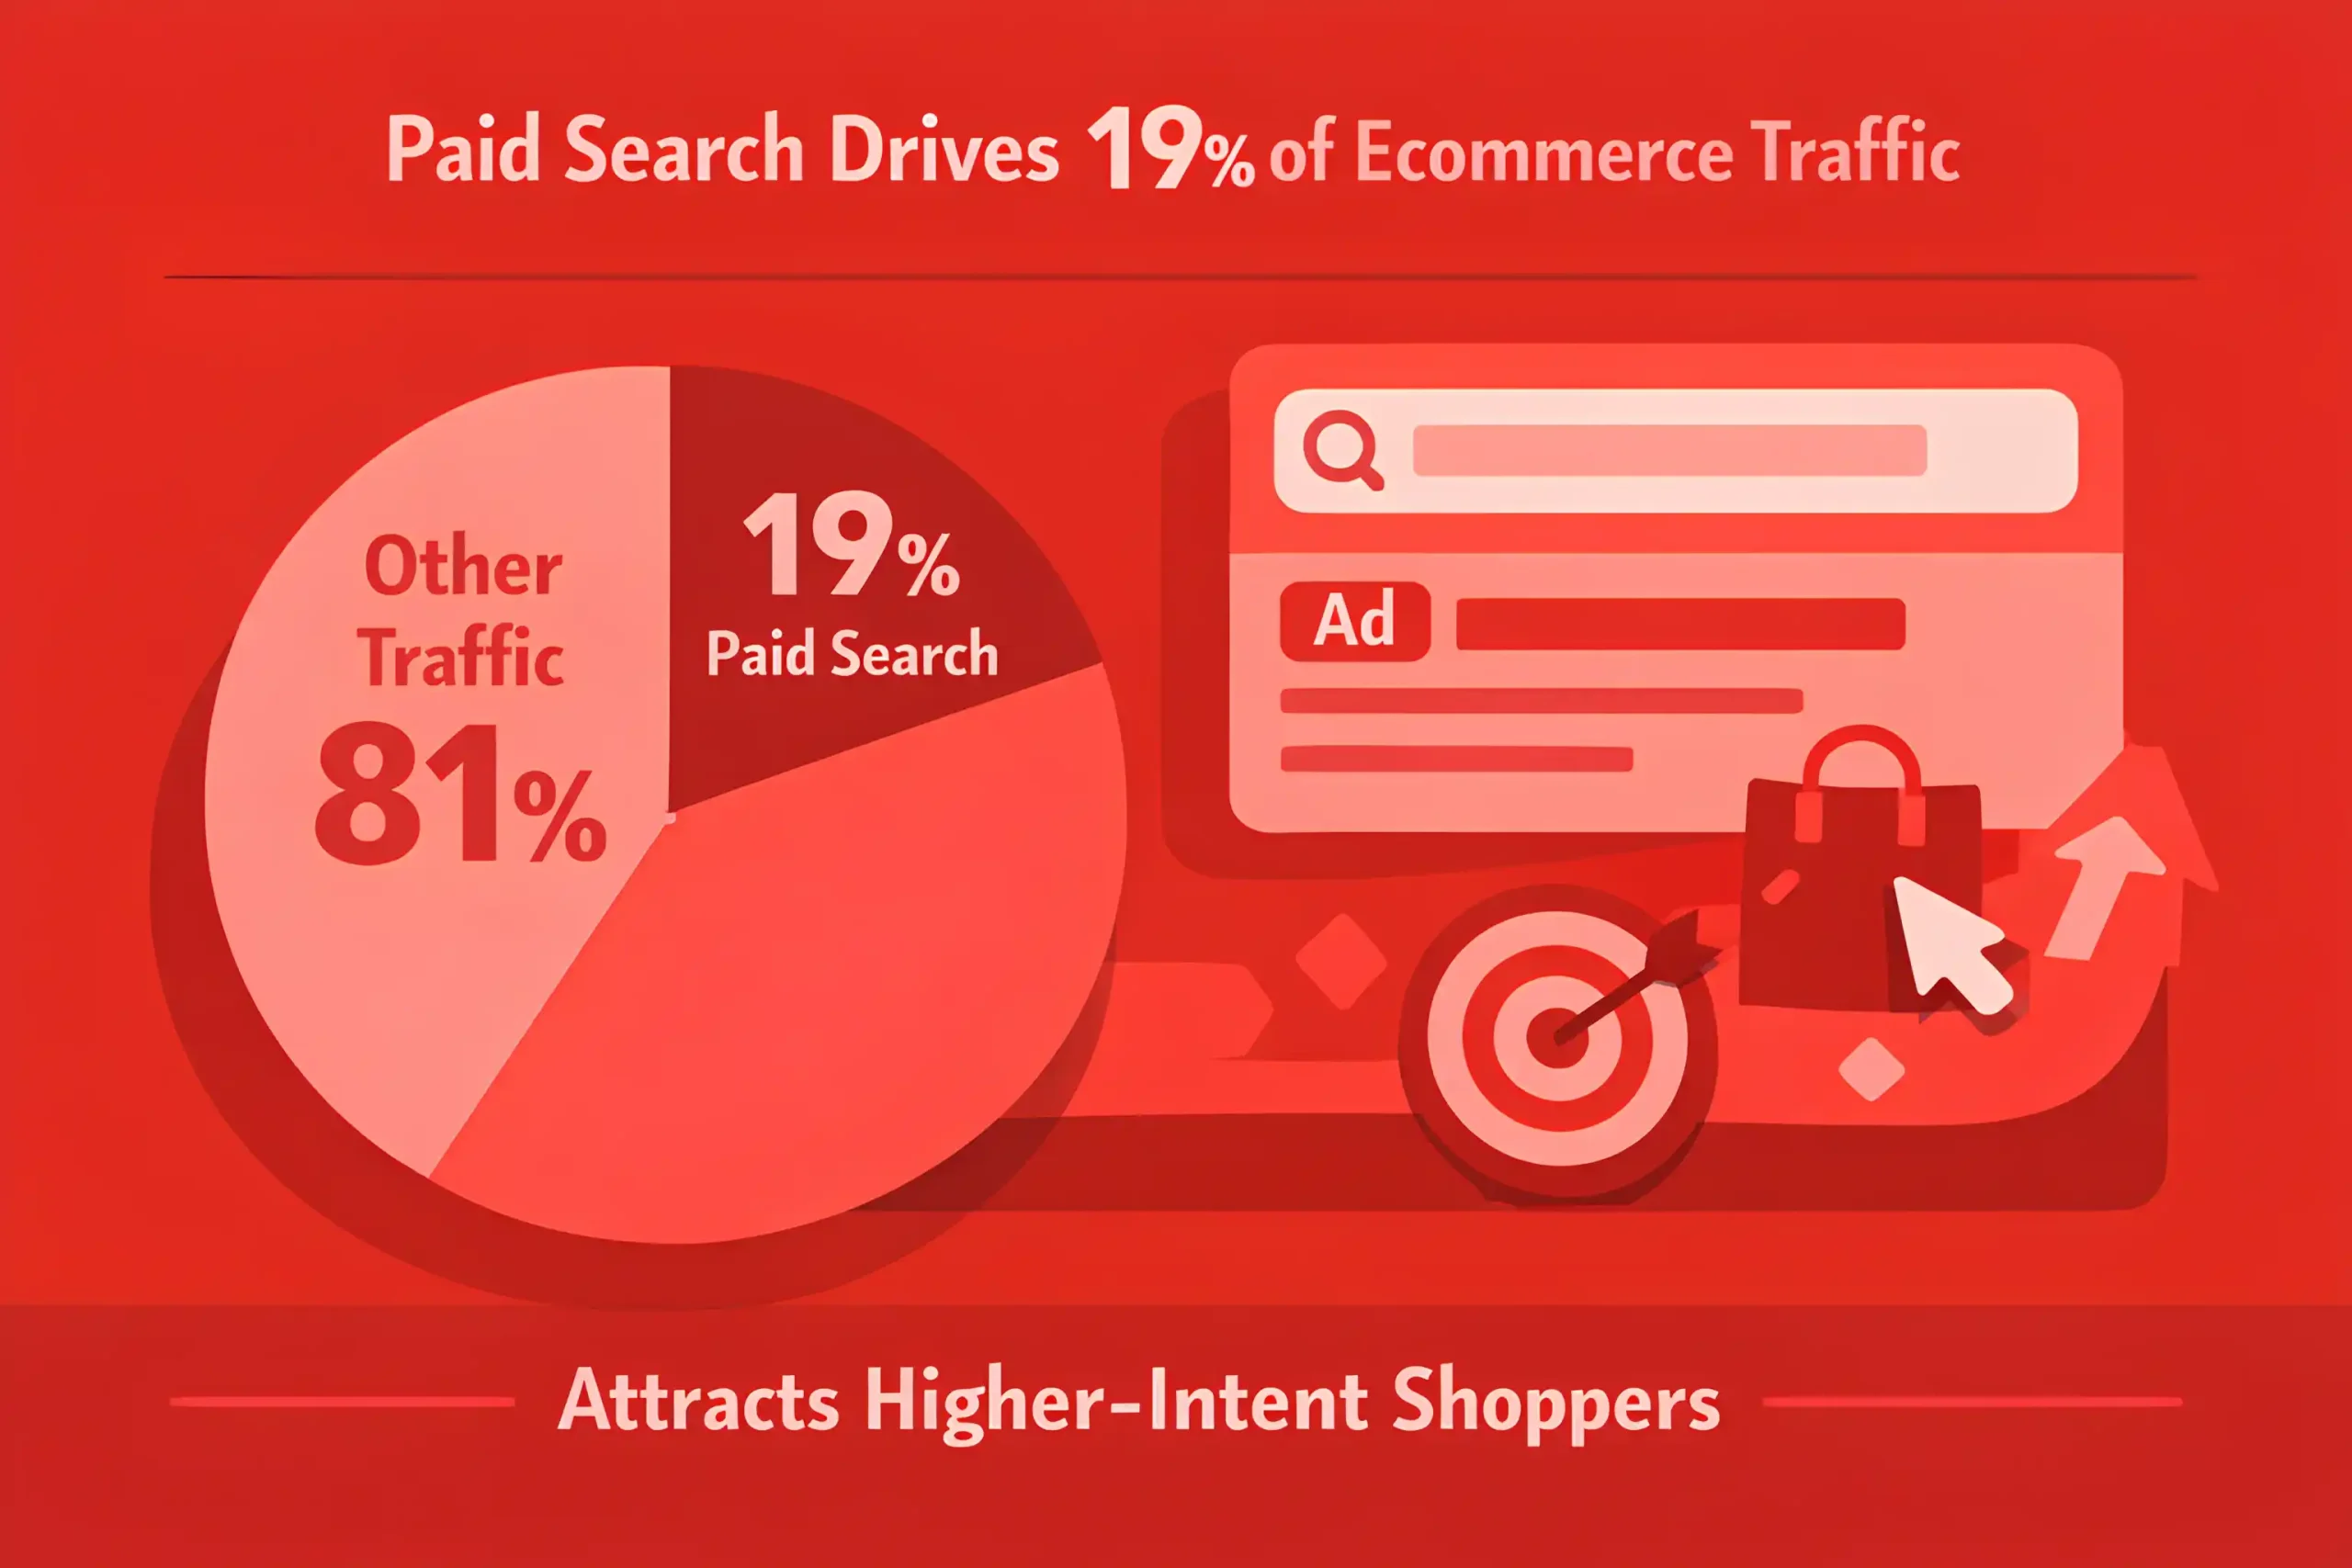
Paid search accounts for about 19% of total eCommerce traffic, but often captures higher-intent visitors.
Social media generates around 14% of ecommerce site visits, with performance varying sharply by category.
E-commerce brands that invest in SEO see roughly a 28% lower blended acquisition cost over time.
Paid traffic costs rose about 11 to 13% YoY in 2025 across major eCommerce categories.
Branded search traffic converts roughly 3.5× better than non-branded search traffic.
E-commerce sites ranking on page one for commercial keywords capture about 71% of organic clicks.
Google Shopping campaigns drive around 23% of paid eCommerce clicks in retail-heavy accounts.
Social commerce traffic converts roughly 18% lower than search traffic, but supports stronger assisted conversions.
E-commerce brands using both SEO and paid search report about 21% stronger acquisition efficiency than single-channel advertisers.
Mobile now drives nearly 68% of e-commerce traffic across acquisition channels, which makes responsive web design more important for conversion.
Short-form video campaigns generate about 1.7× higher click-through rates than static social ads.
Email remains a major returning-traffic channel, driving roughly 16% of repeat eCommerce sessions.
Influencer-led traffic converts about 22% better than standard paid social in creator-driven categories.
Retargeting campaigns deliver roughly 27% lower CPA than cold prospecting campaigns.
E-commerce brands with strong first-party audience data see about 19% lower paid acquisition costs.
SEO-driven product pages attract roughly 24% more non-branded traffic than generic category pages.
Paid social CPMs increased about 9 to 12% YoY in 2025, tightening acquisition margins.
Multi-channel eCommerce brands generate around 26% more qualified traffic than brands relying on one primary source, aligning well with broader digital marketing.
High-performing eCommerce teams attribute about 40% of new-customer growth to combined SEO, paid, and social execution.
Read also: 100+ AI Agent Usage Statistics
Conversion Rate, Checkout, and Funnel Performance Stats
Average eCommerce conversion rates in 2025 range from 2.1% to 3.4% across most sectors.
Mobile e-commerce conversion rates remain about 30 to 40% lower than desktop on average.
Checkout abandonment still affects roughly 69% of e-commerce carts.
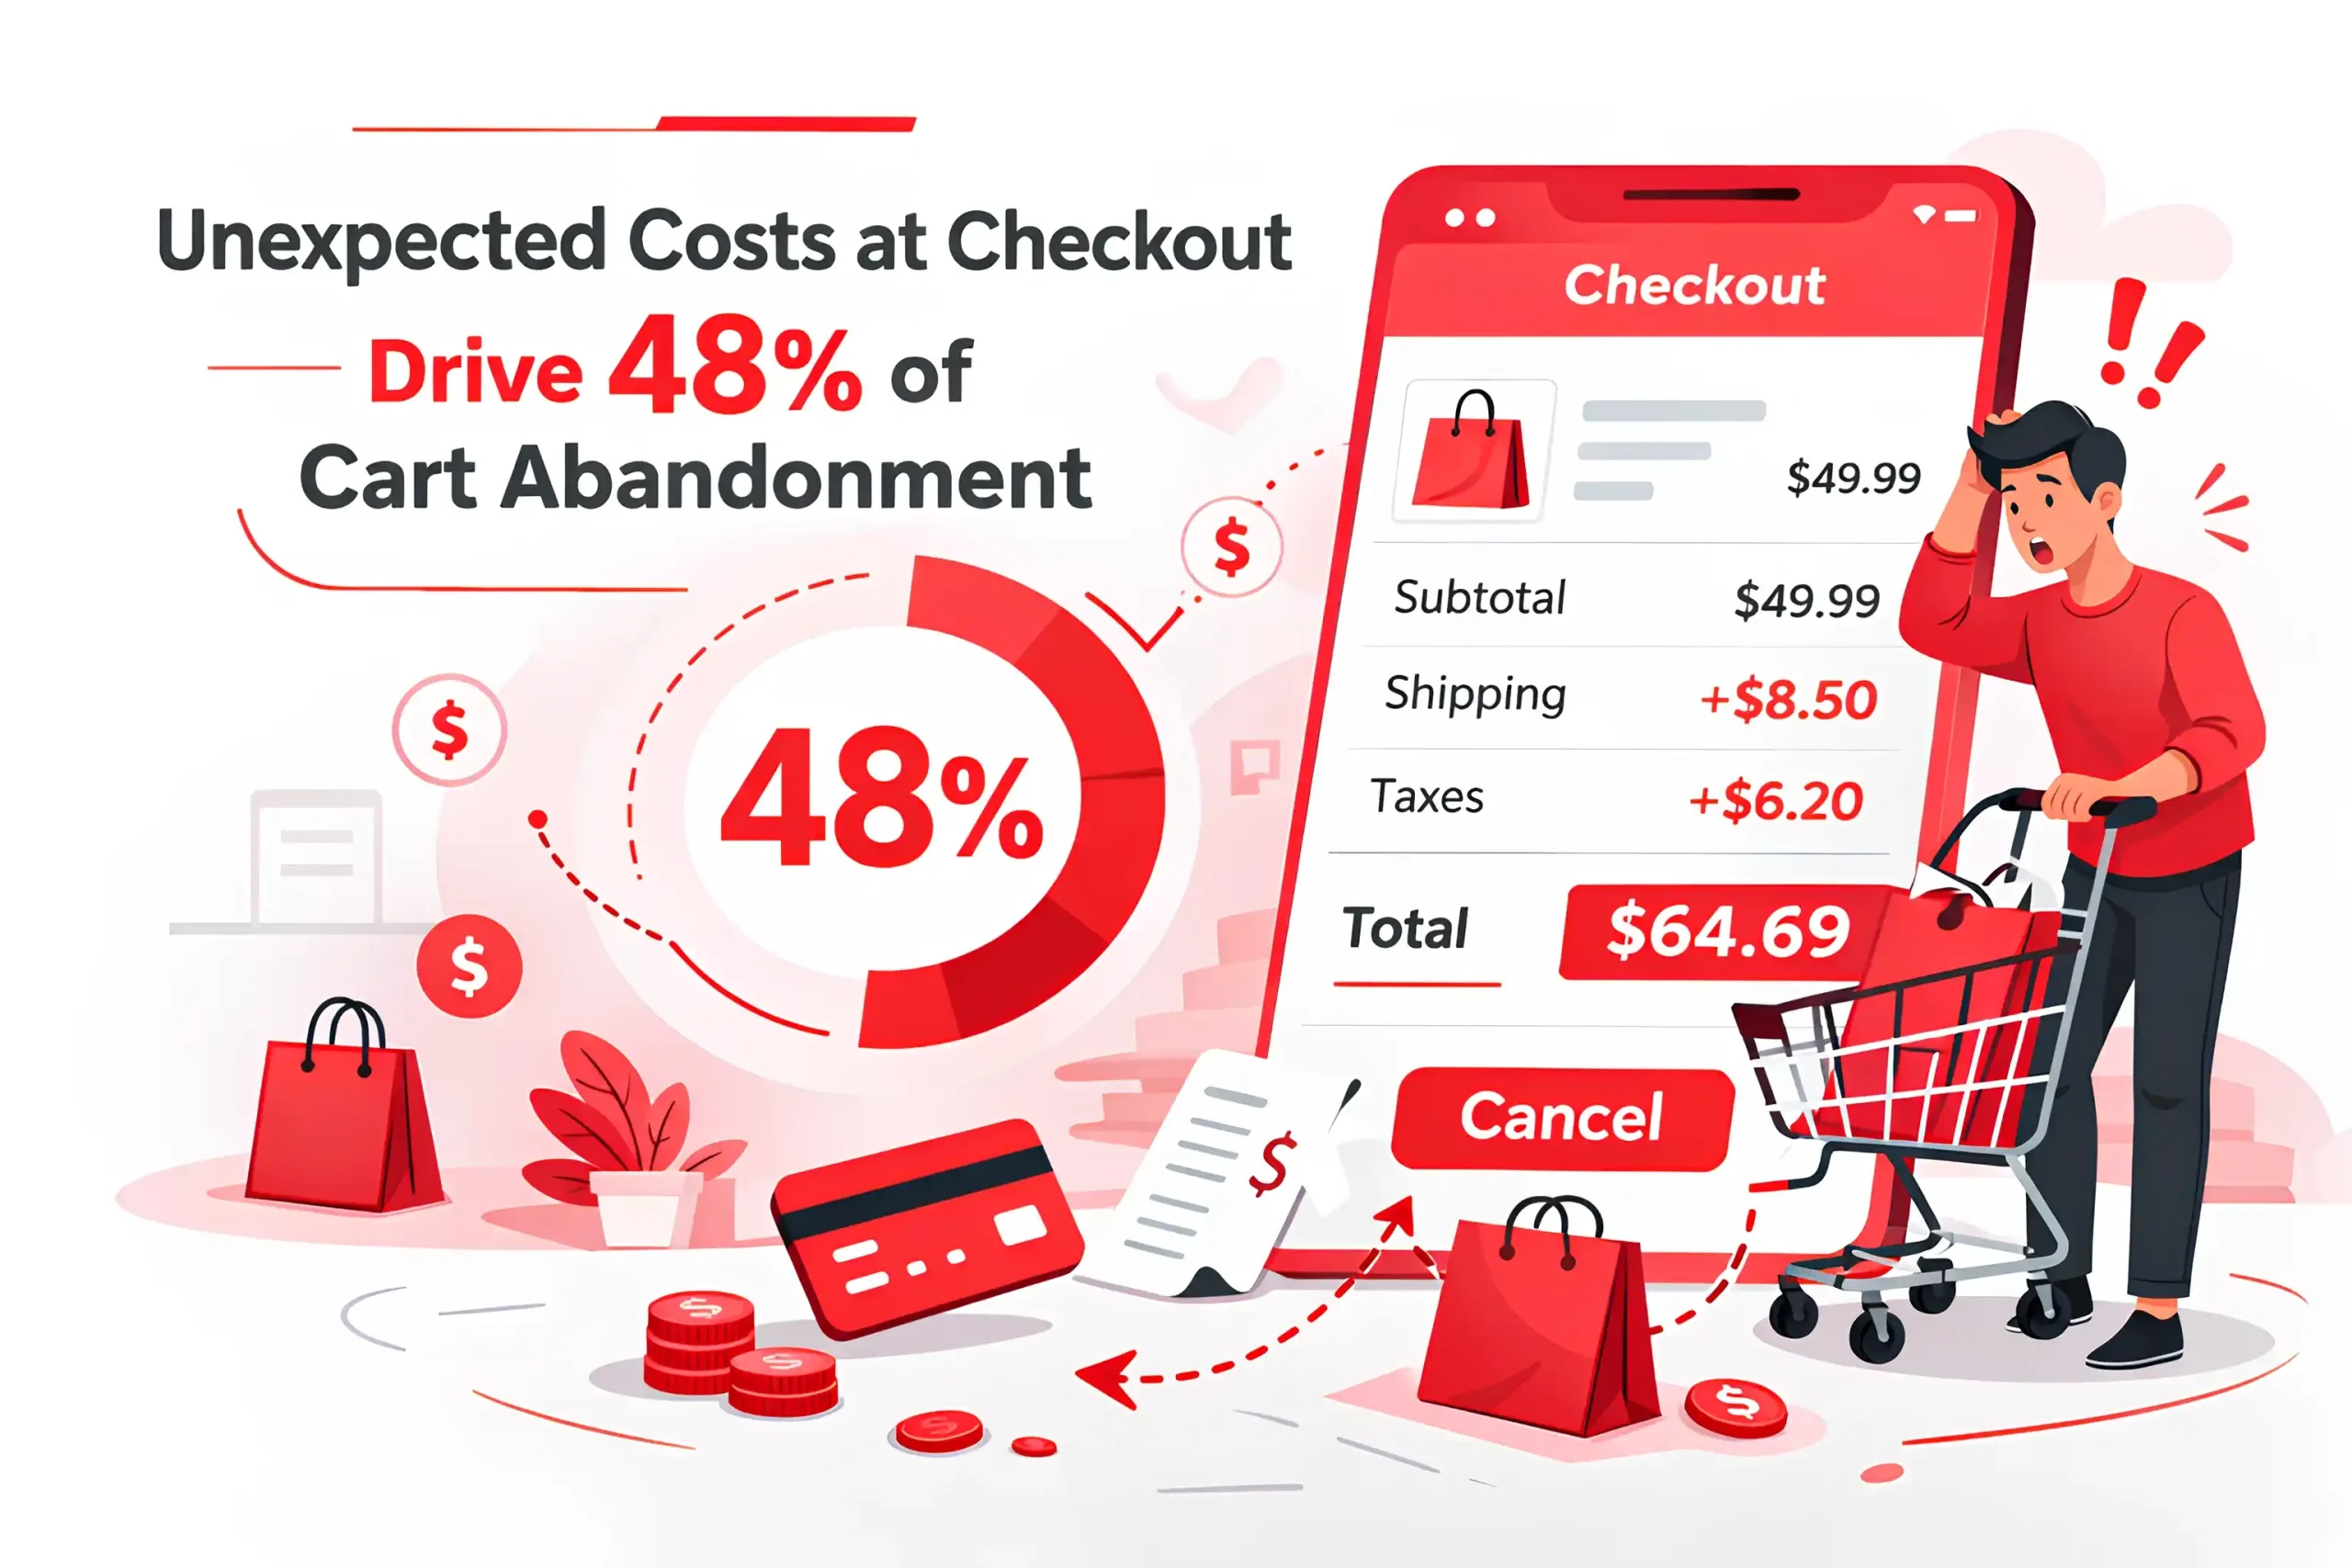
Unexpected costs at checkout drive about 48% of cart abandonment cases.
E-commerce stores with one-page checkout see roughly 17% higher completion rates than multi-step flows, which is why CRO matters so much at checkout.
Guest checkout options improve conversion by about 12 to 18% compared with forced account creation.
Sites offering express payment methods see roughly 21% faster checkout completion.
Product pages with strong reviews convert about 14% better than pages without visible social proof.
E-commerce brands using personalized product recommendations drive roughly 11% higher conversion rates.
Slow page loads reduce conversion, with every extra second costing about 7% in completed purchases.
Returning visitors convert roughly 2.4× better than first-time users.
Cart recovery emails recover about 9 to 14% of abandoned checkouts.
Stores that show delivery estimates early see roughly 10% lower cart abandonment.
E-commerce funnels with fewer than four checkout fields convert about 15% better than longer forms.
Trust badges near payment steps lift checkout completion by roughly 6 to 9%.
Product pages with video demos generate about 13% higher add-to-cart rates.
Exit-intent offers recover roughly 8 to 12% of abandoning visitors before purchase drop-off.
Brands using A/B-tested checkout flows report about 16% stronger funnel efficiency.
E-commerce stores with mobile-optimized checkout see roughly 19% higher conversion than poorly optimized competitors.
High-performing eCommerce brands convert about 1 in 4 add-to-cart sessions into completed purchases.
Don’t miss out: 100+ PPC Statistics
Retention, Loyalty, and Customer Lifetime Value (LTV) Metrics
Repeat customers generate roughly 41% of eCommerce revenue for high-performing brands.
Returning shoppers convert about 2.3× better than first-time visitors.
A 5% increase in retention can lift e-commerce profit by 25 to 35%.
Loyalty program members spend roughly 18% more annually than non-members.
E-commerce brands with strong post-purchase email flows see about 14% higher repeat purchase rates.
The average repeat purchase rate for e-commerce brands ranges from 26% to 32%.
Customers acquired through email often deliver roughly 20% higher LTV than those acquired through paid social alone.
Brands using personalized retention campaigns report about 17% higher customer lifetime value.
Subscription customers generate roughly 1.8× higher LTV than one-time buyers.
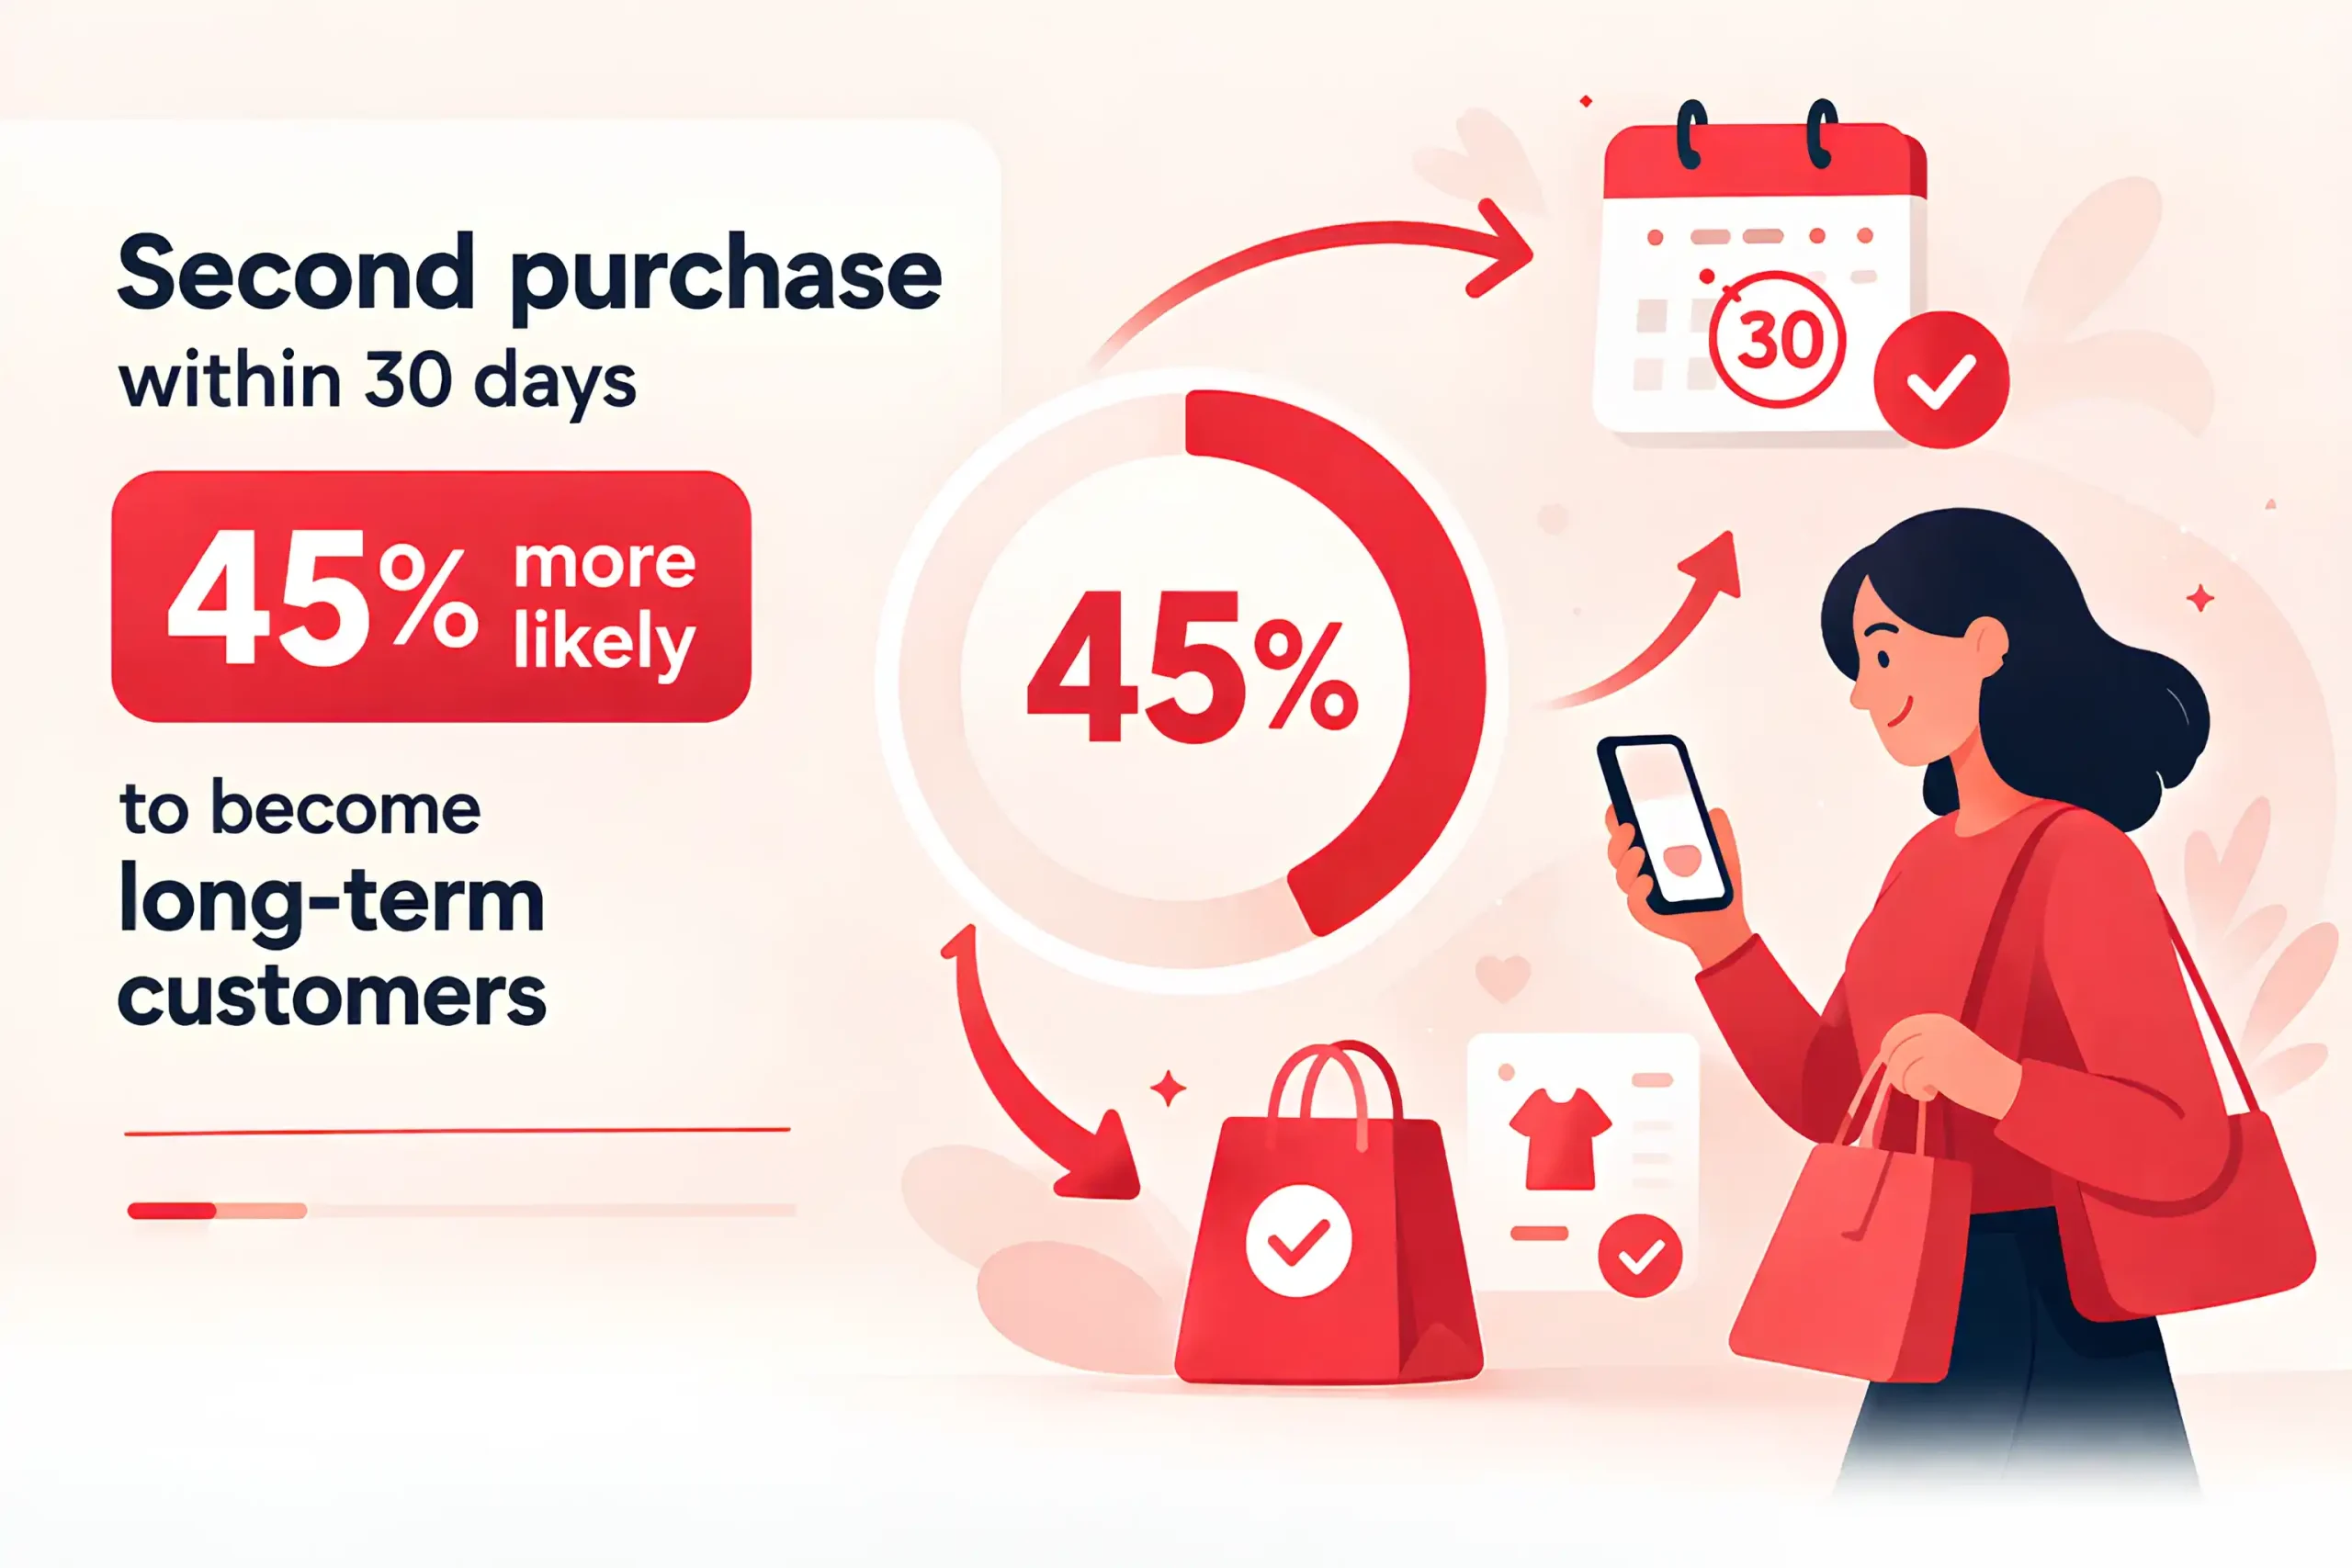
Shoppers who make a second purchase within 30 days are about 45% more likely to become long-term customers.
SMS-based retention campaigns drive roughly 12 to 16% higher repeat conversion in mobile-first eCommerce brands.
Brands with active loyalty programs see about 22% lower churn than those without one.
E-commerce stores that segment repeat buyers by behavior report roughly 15% stronger retention efficiency.
Customers who purchase through two or more channels deliver about 30% higher LTV than single-channel buyers.
Post-purchase cross-sell flows increase average customer value by roughly 11 to 14%.
High-retention eCommerce brands recover acquisition costs about 27% faster than low-retention competitors.
Brands with replenishment reminders see roughly 10% higher reorder rates in consumable categories.
VIP or tiered loyalty members place orders about 1.6× more often than standard customers.
E-commerce brands with strong retention programs generate roughly 24% more revenue per customer over 12 months.
Customers who engage with loyalty rewards within the first 60 days show about 35% higher long-term value.
Explore also: 250+ Digital Marketing Statistics
Channel Performance by Platform (Email/SMS, Influencers, Marketplaces, Affiliate)
Marketplace sales account for roughly 43% of e-commerce revenue for brands with multi-channel distribution.
Email drives roughly 19% of total eCommerce revenue for retention-focused brands.
SMS campaigns generate about 2.4× higher click-through rates than email in time-sensitive promotions.
E-commerce brands using both email and SMS see roughly 22% higher repeat purchase rates than email-only brands.
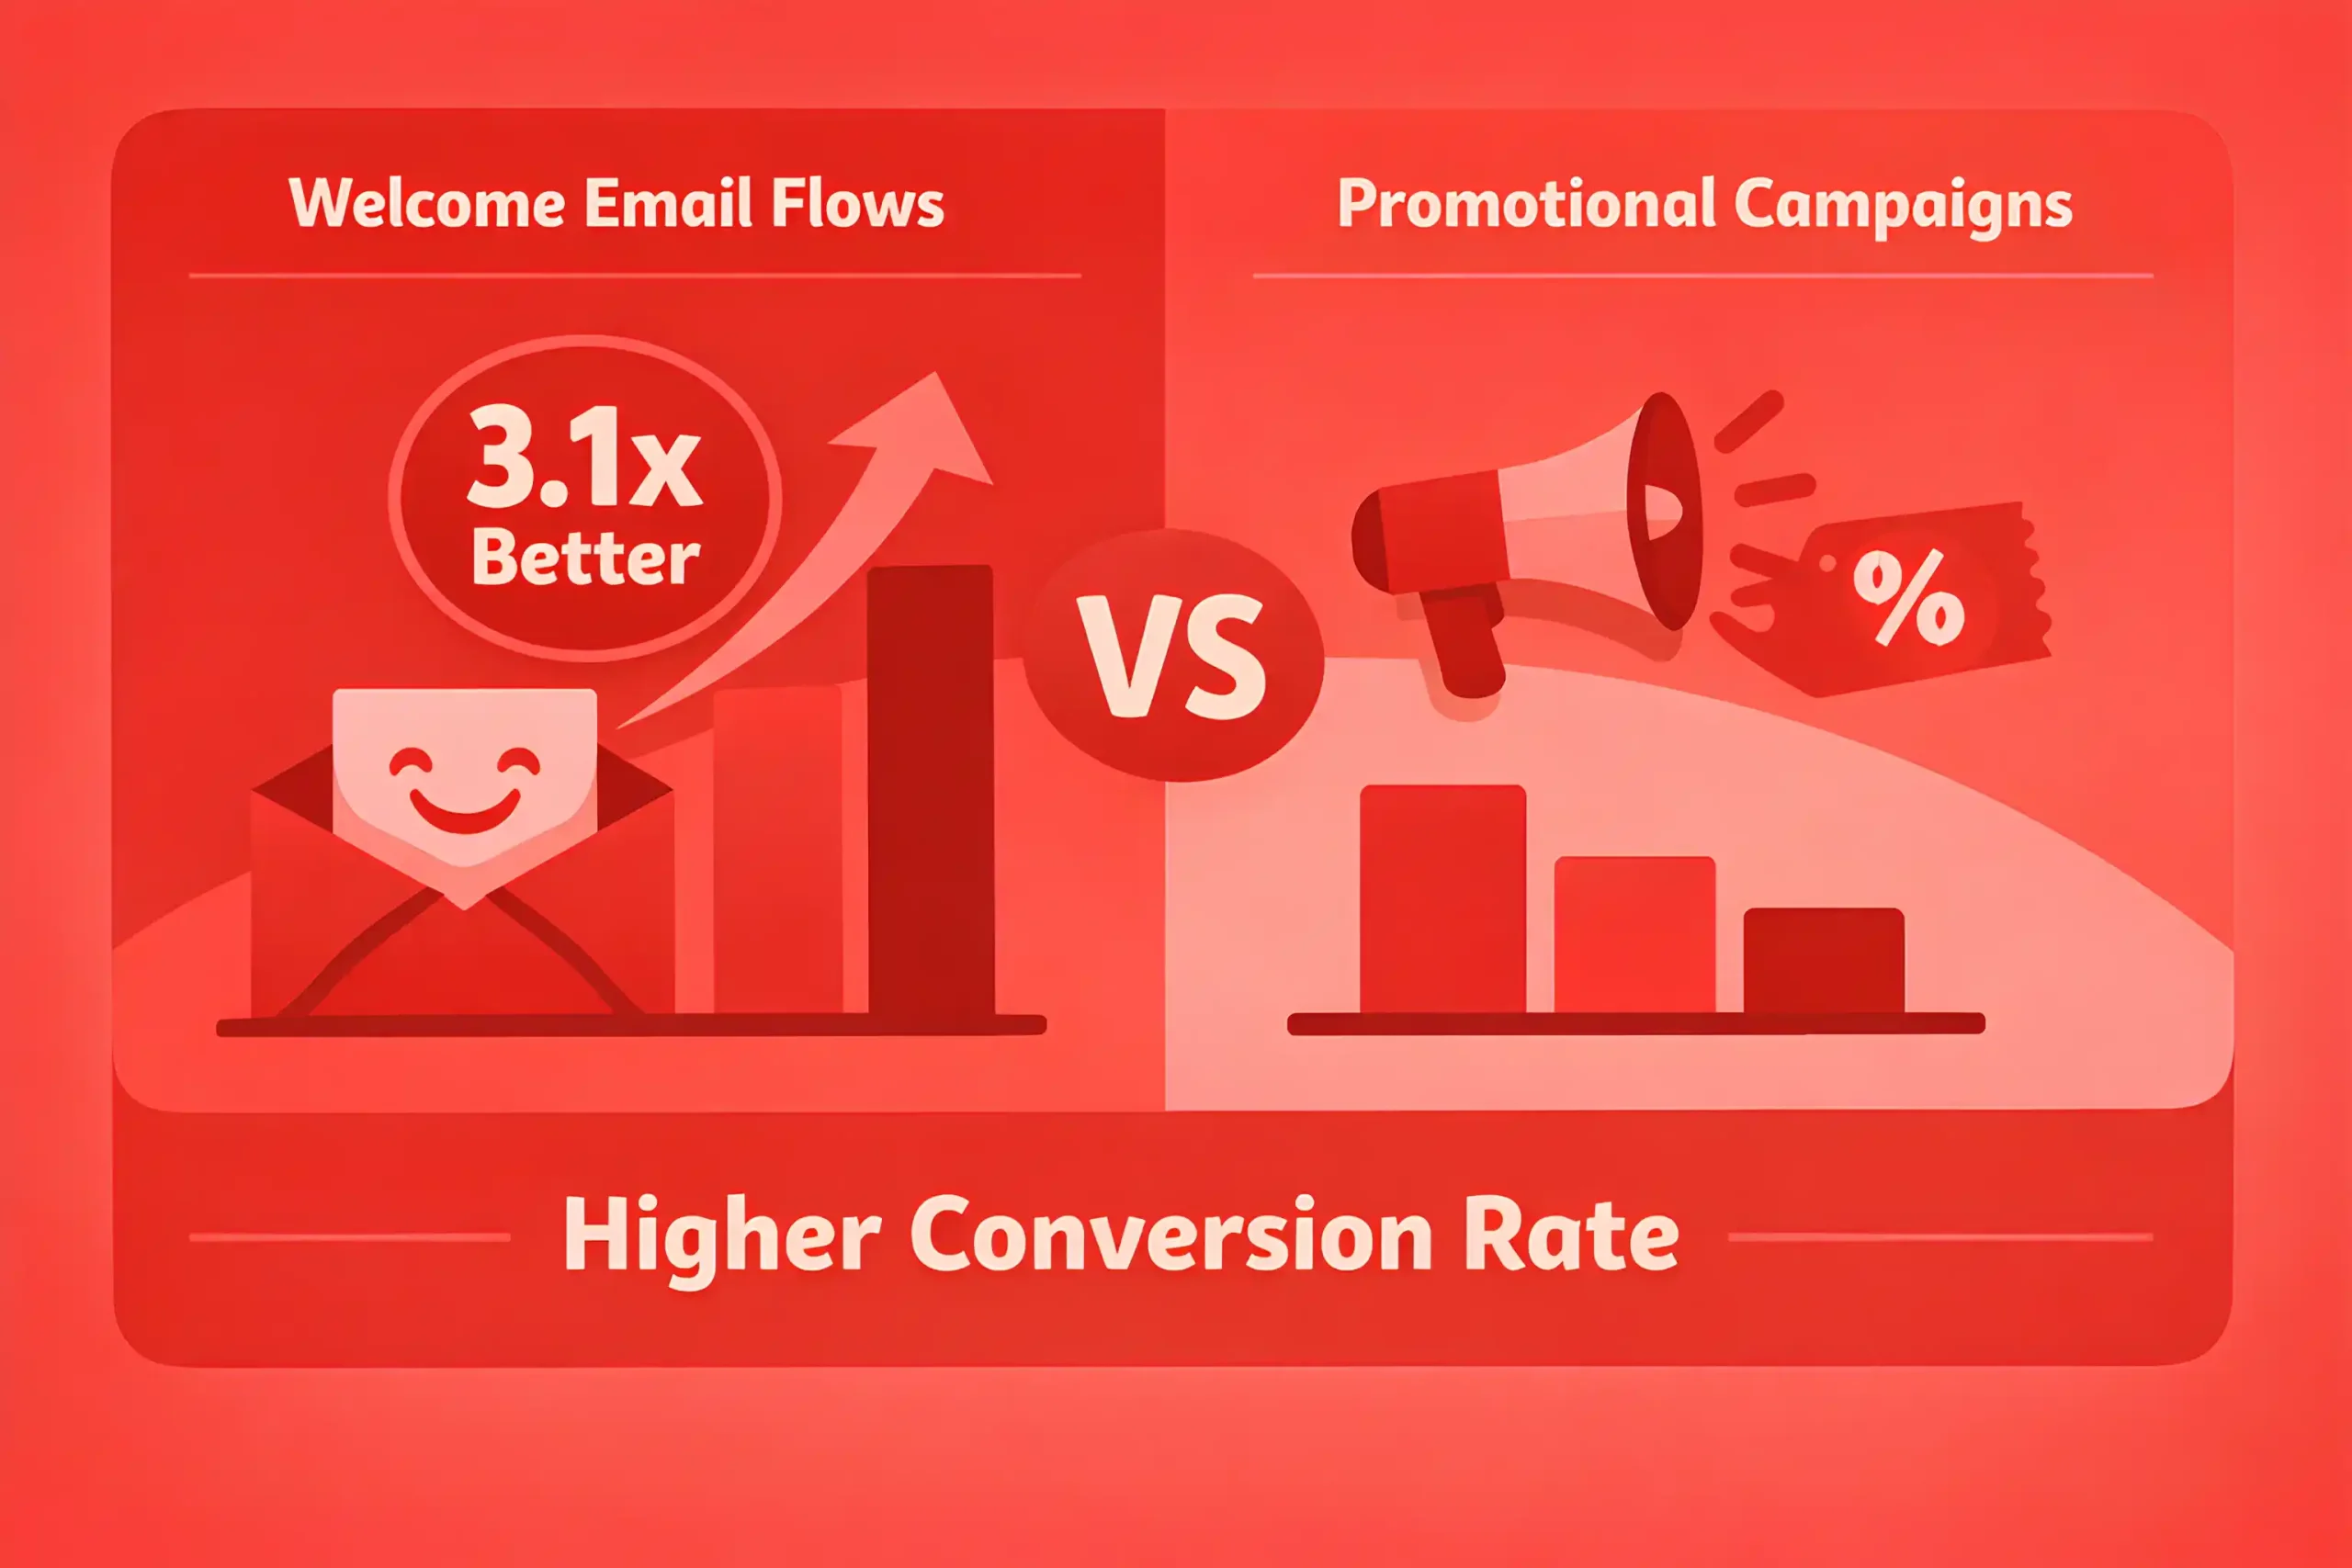
Welcome email flows convert about 3.1× better than standard promotional campaigns.
SMS opt-in subscribers convert roughly 18% faster than non-subscribers in mobile-first stores.
Influencer-driven traffic converts about 21% better than standard paid social in creator-led categories.
Micro-influencer campaigns deliver roughly 28% higher engagement rates than macro-influencer campaigns.
E-commerce brands using creator whitelisting see about 17% lower acquisition costs than brands using brand-only paid social.
Affiliate channels contribute roughly 12 to 15% of new-customer revenue for mature eCommerce programs.
Affiliate traffic converts about 16% better than average display traffic.
Brands selling through both marketplaces and owned channels report about 24% higher total customer reach.
Marketplace shoppers convert roughly 1.9× faster than traffic landing on standalone brand sites.
Affiliate-driven customers generate about 14% higher first-order value in high-intent verticals.
Email campaigns with segmented product recommendations drive roughly 13% higher conversion rates than generic sends.
SMS cart recovery flows recover about 11 to 15% of abandoned checkouts.
Influencer-led product launches generate roughly 26% more assisted conversions than brand-led launch campaigns.
Marketplace visibility increases branded search demand by about 9 to 12% for growing e-commerce brands.
Affiliate partnerships with niche publishers deliver roughly 19% lower CPA than broad coupon-based affiliate programs.
Brands that balance owned, earned, and marketplace channels generate about 27% stronger revenue stability than brands dependent on one platform.
Useful to know: 100+ Reputation Management Statistics
The Key Takeaways
E-commerce growth is no longer just about getting more traffic. Customer acquisition is still expensive, conversion is easy to lose, and stronger profits now come from better retention, smoother checkout experiences, and a smarter mix of channels.
The brands pulling ahead are not relying on one platform or one campaign. They are building a more connected system across SEO, paid media, email, SMS, influencers, marketplaces, and loyalty, so each channel supports both revenue and long-term customer value.
In a tighter market, the brands that win are not always the ones with the biggest reach. They are the ones that convert more efficiently, keep customers longer, and get more out of every marketing dollar.