Blogging still drives crazy growth, but the playbook is less forgiving in 2026. Search results are more crowded, click behavior shifts when answers appear on the SERP, and distribution often matters as much as publishing.
Many teams keep producing posts, yet struggle to explain what actually moves traffic, links, subscribers, and revenue.
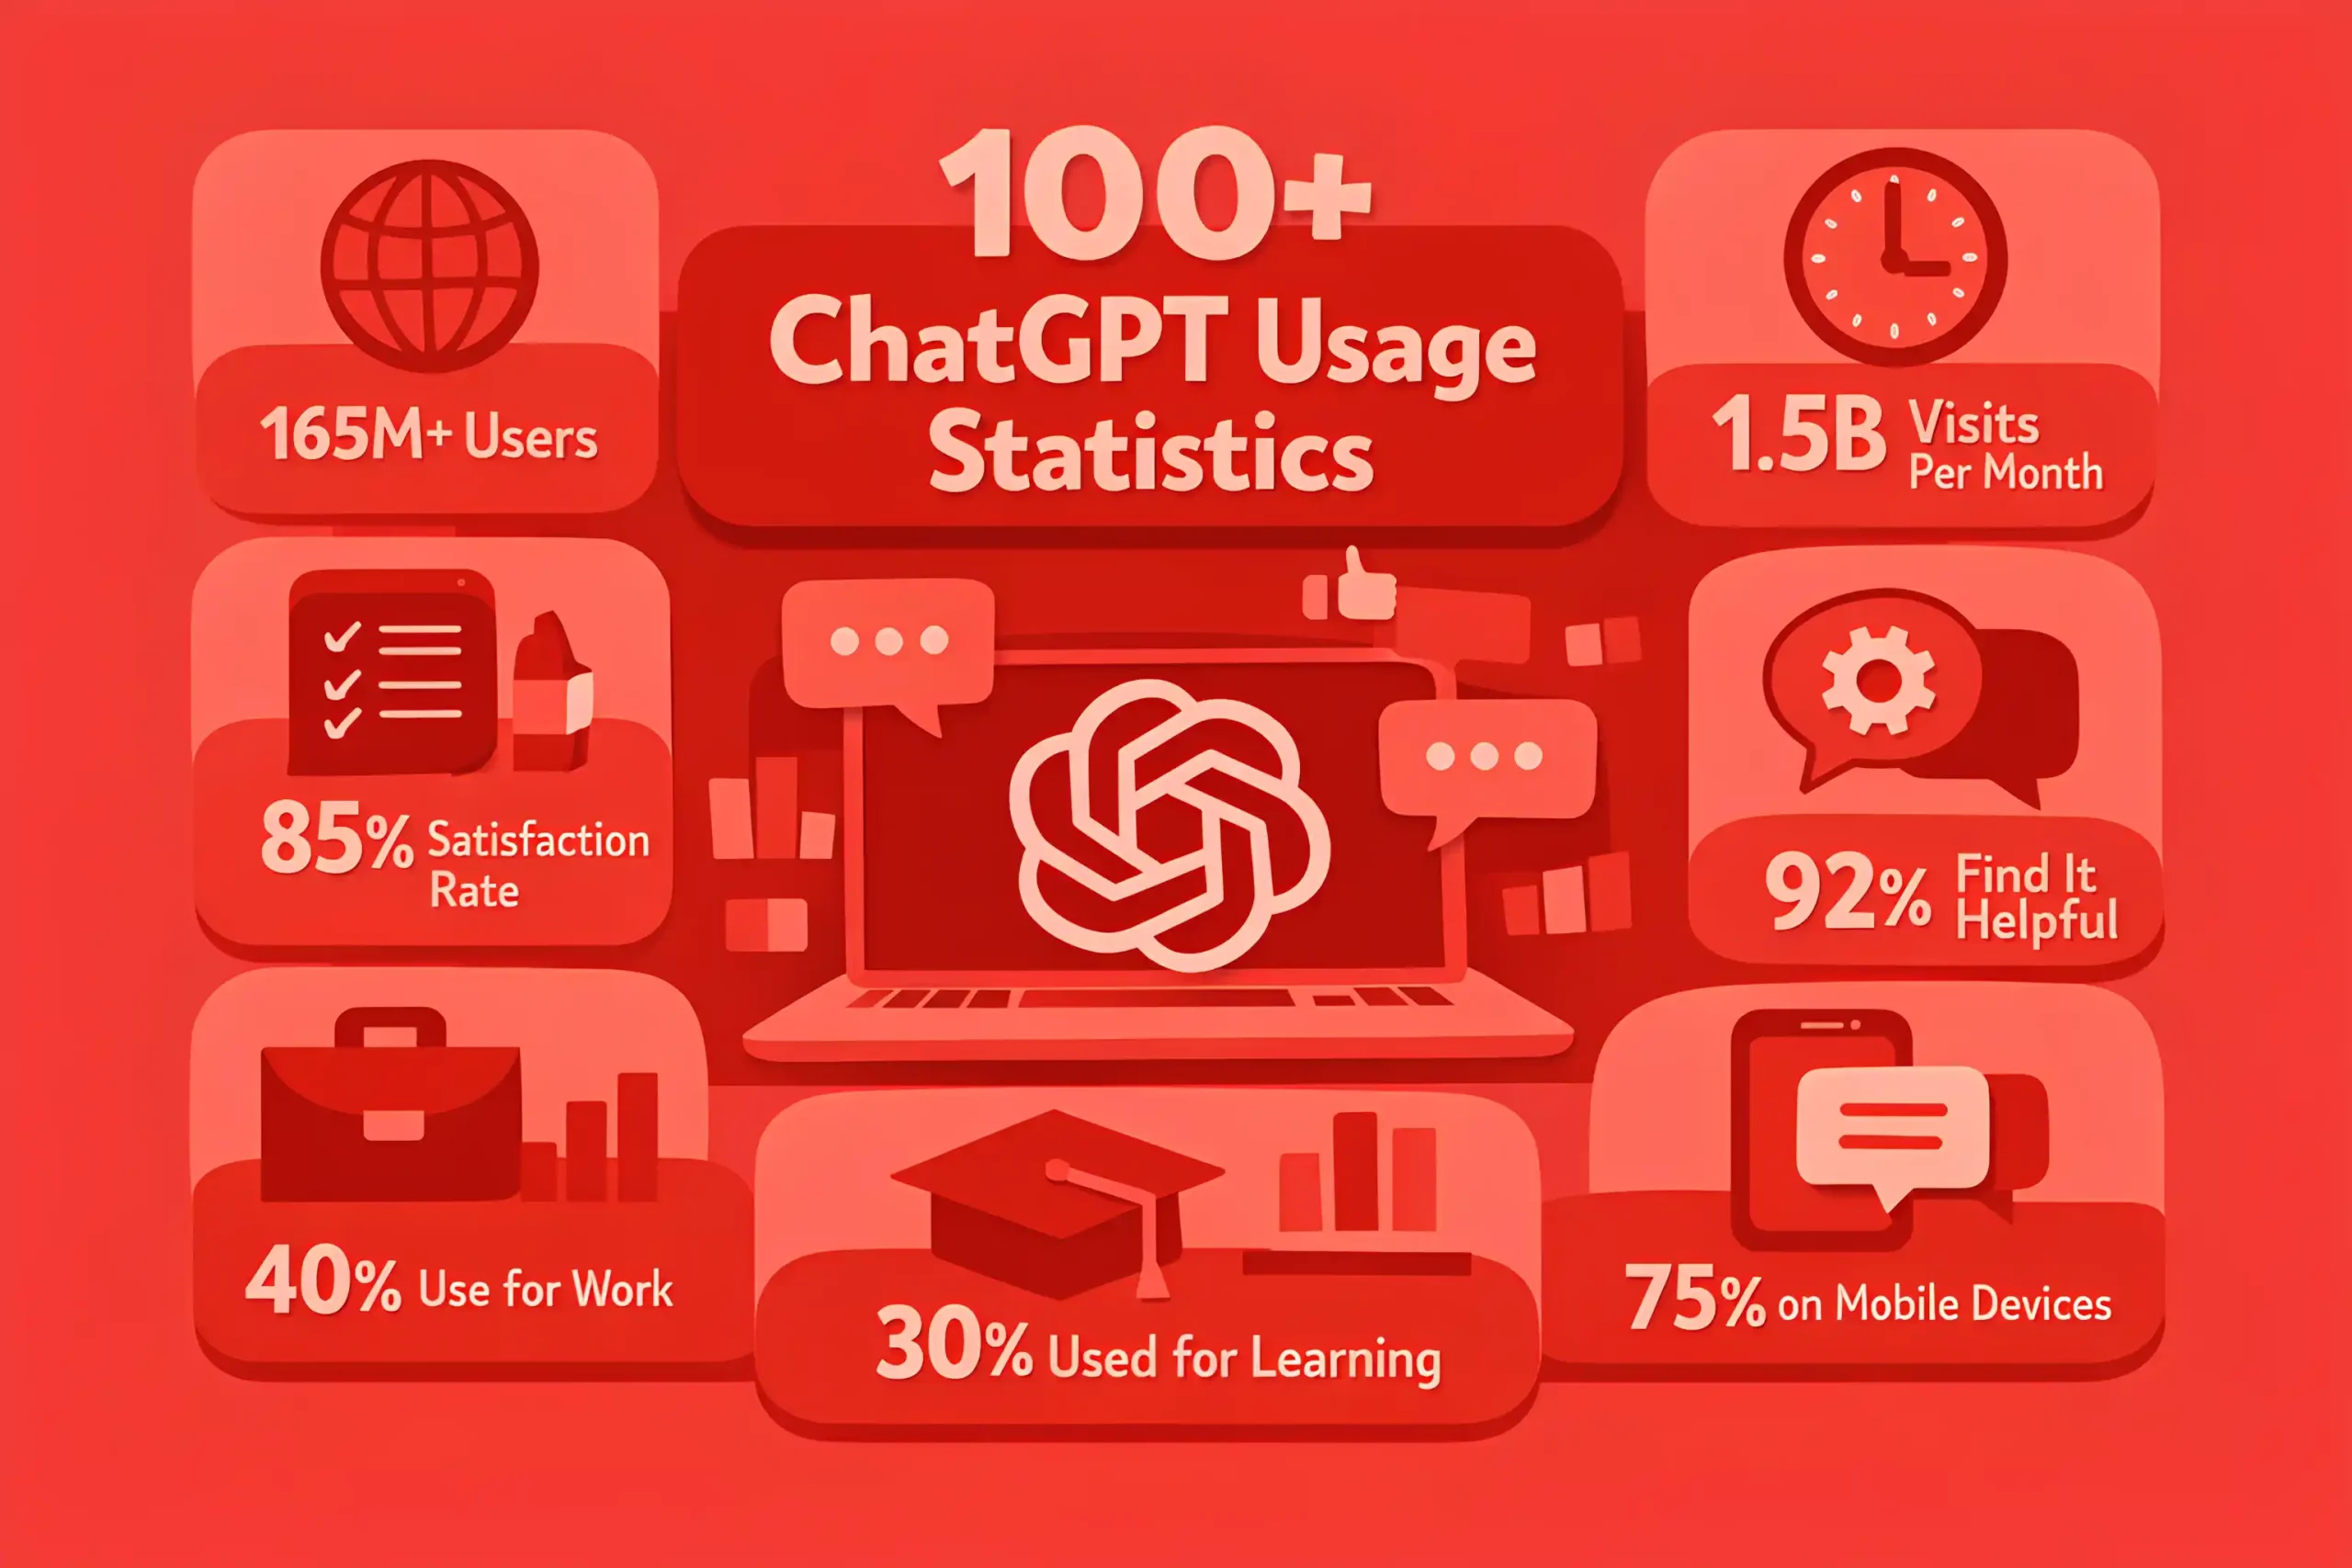
On NEWMEDIA.COM, our updated collection pulls together 100+ blogging statistics across performance benchmarks, SEO and organic visibility, content formats, promotion channels, engagement, and conversion.
Use the numbers to set targets that match your market, spot gaps in your content system, and make clearer calls on topics, cadence, and promotion, without relying on gut feel.
Blogging Industry Growth & Market Size Statistics
Blog content still accounts for a large share of marketing site publishing, often 40% to 70% of new pages created each quarter, especially inside structured content marketing.
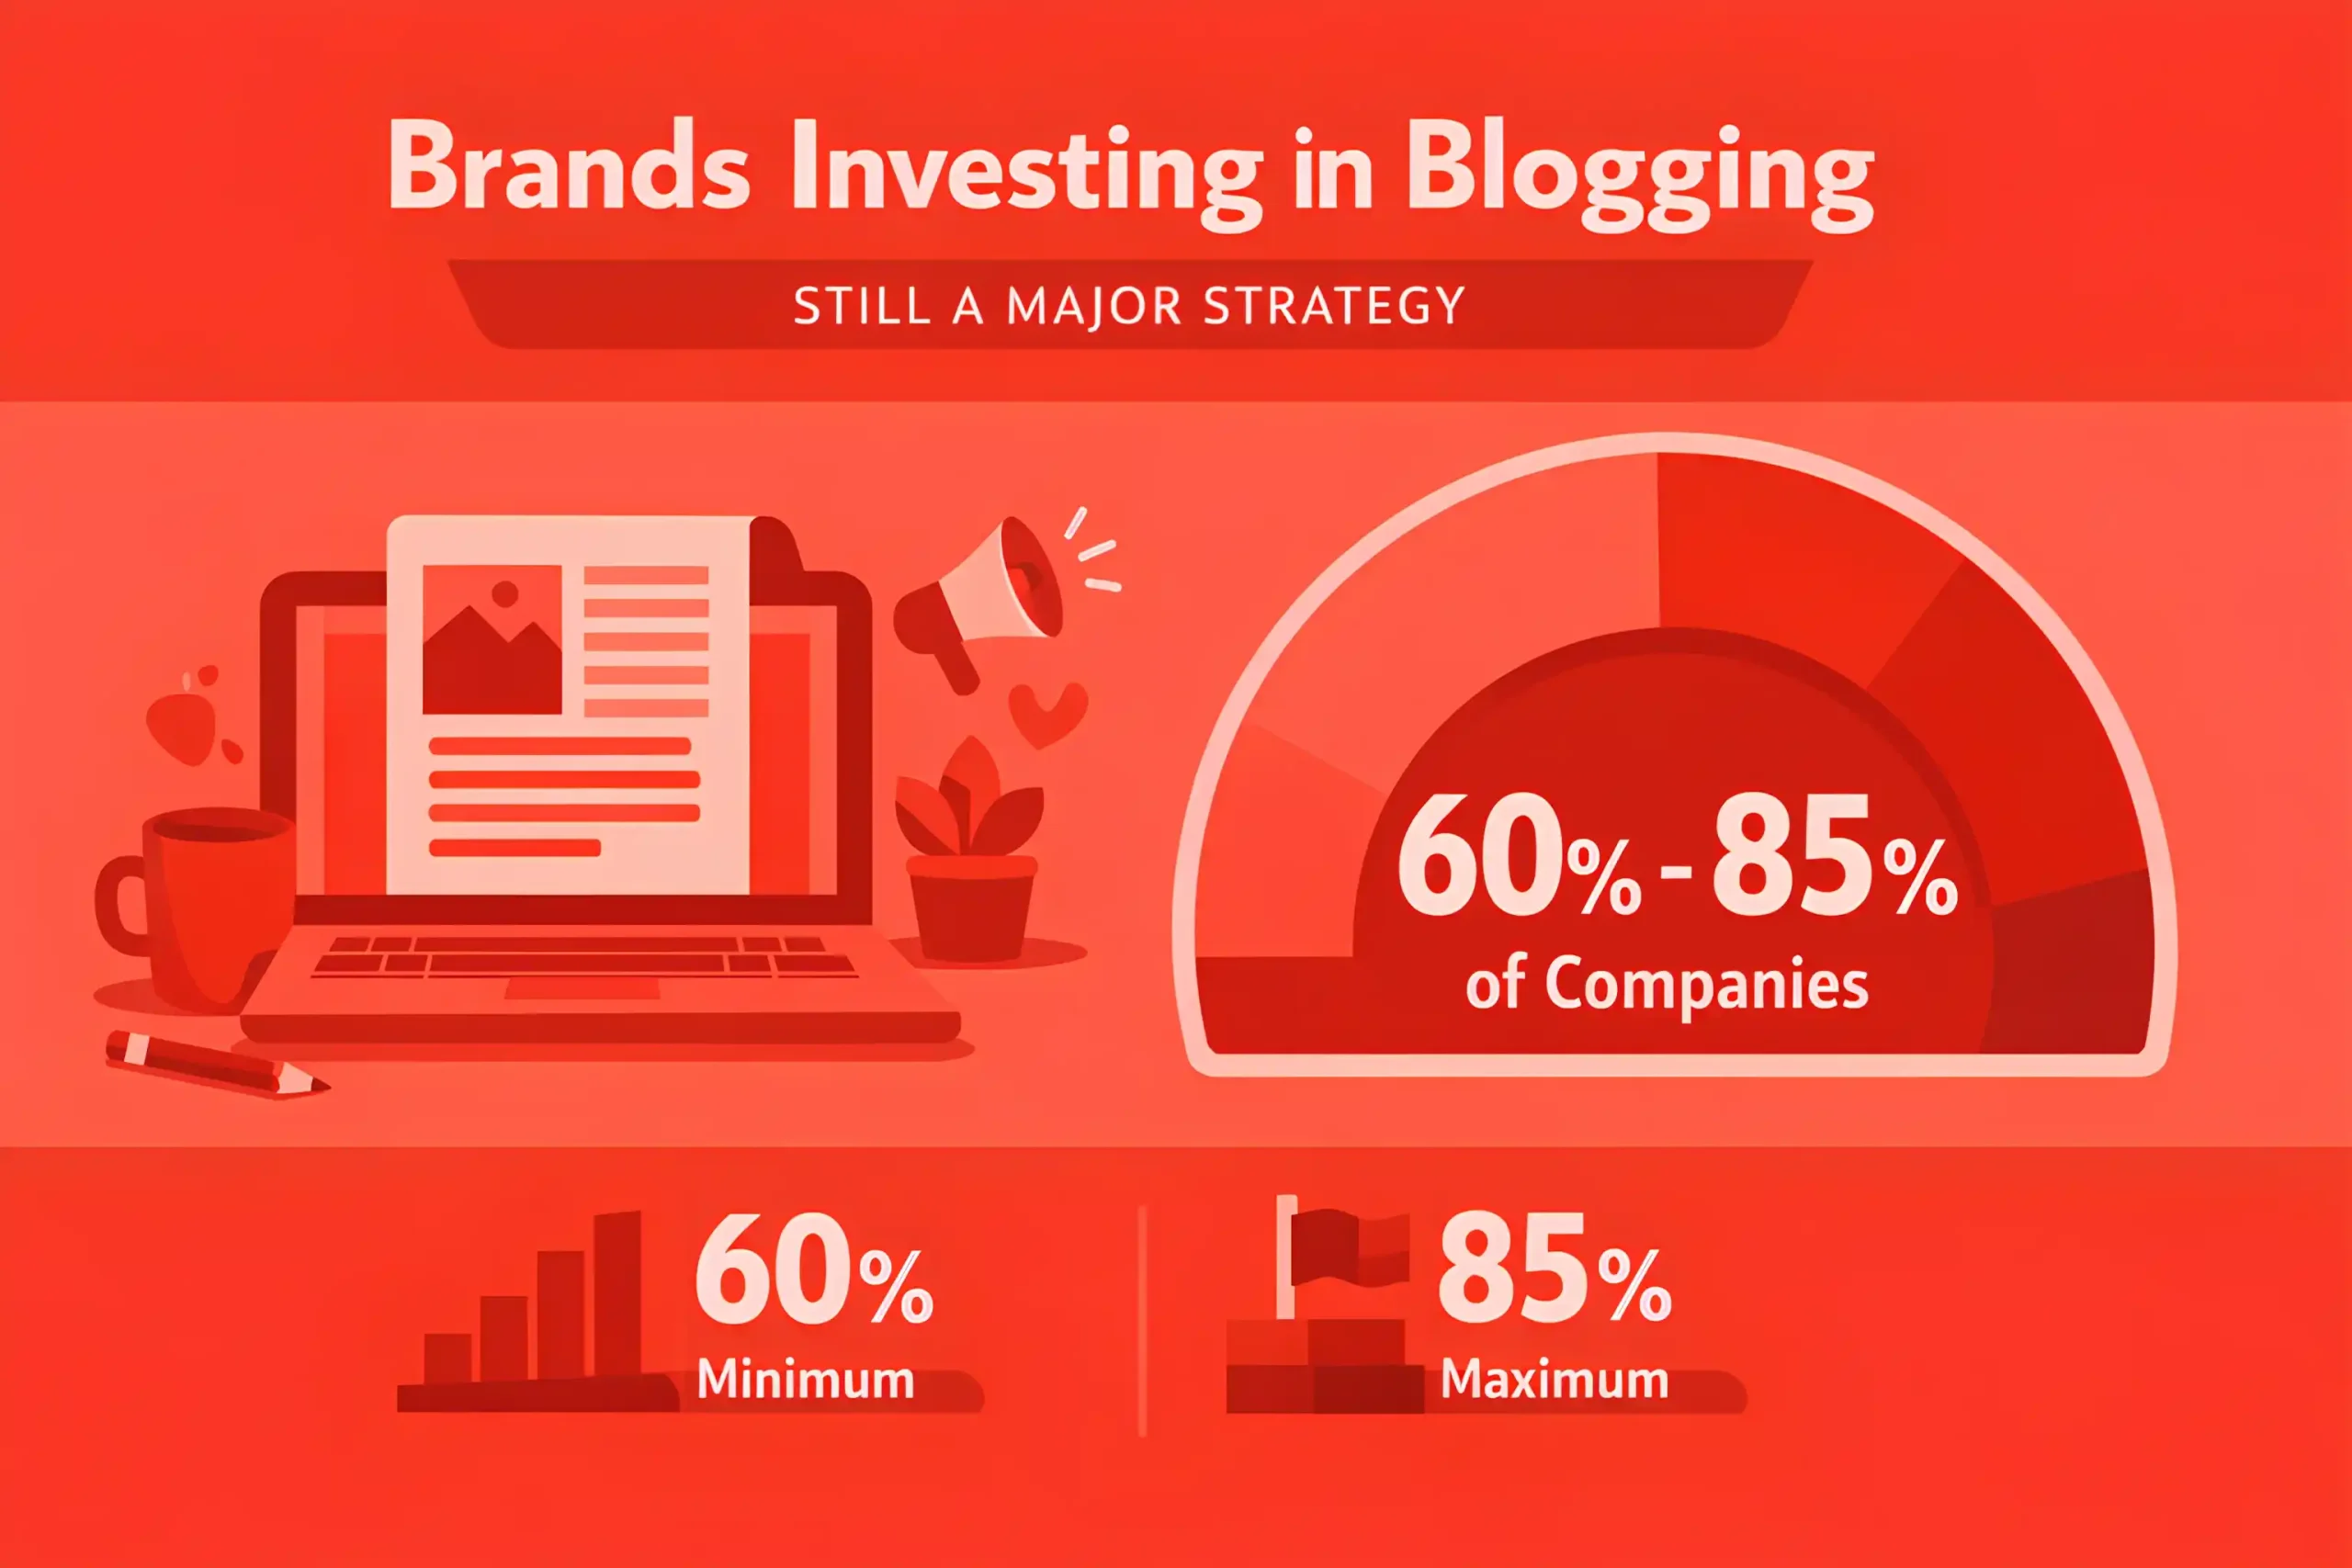
The share of brands investing in blogging remains high, commonly 60% to 85% across content companies.
Growth in publishing volume often outpaces growth in reader attention, with total posts rising 10% to 25% per year in many niches.
Competition concentrates in commercial categories, where the number of ranking domains can increase 15% to 40% year over year.
Large sites tend to expand topic coverage faster, often publishing 2x to 6x more pages annually than smaller competitors.
A growing portion of blog production is assisted by tools, and assisted content can represent 20% to 50% of output in high-velocity teams.
Content consolidation is rising, with many sites pruning 5% to 20% of low-value posts per year to protect quality and crawl budget.
In mature verticals, incremental traffic growth often comes from updating existing posts, which can drive 30% to 60% of annual organic gains, guided by a clear SEO strategy.
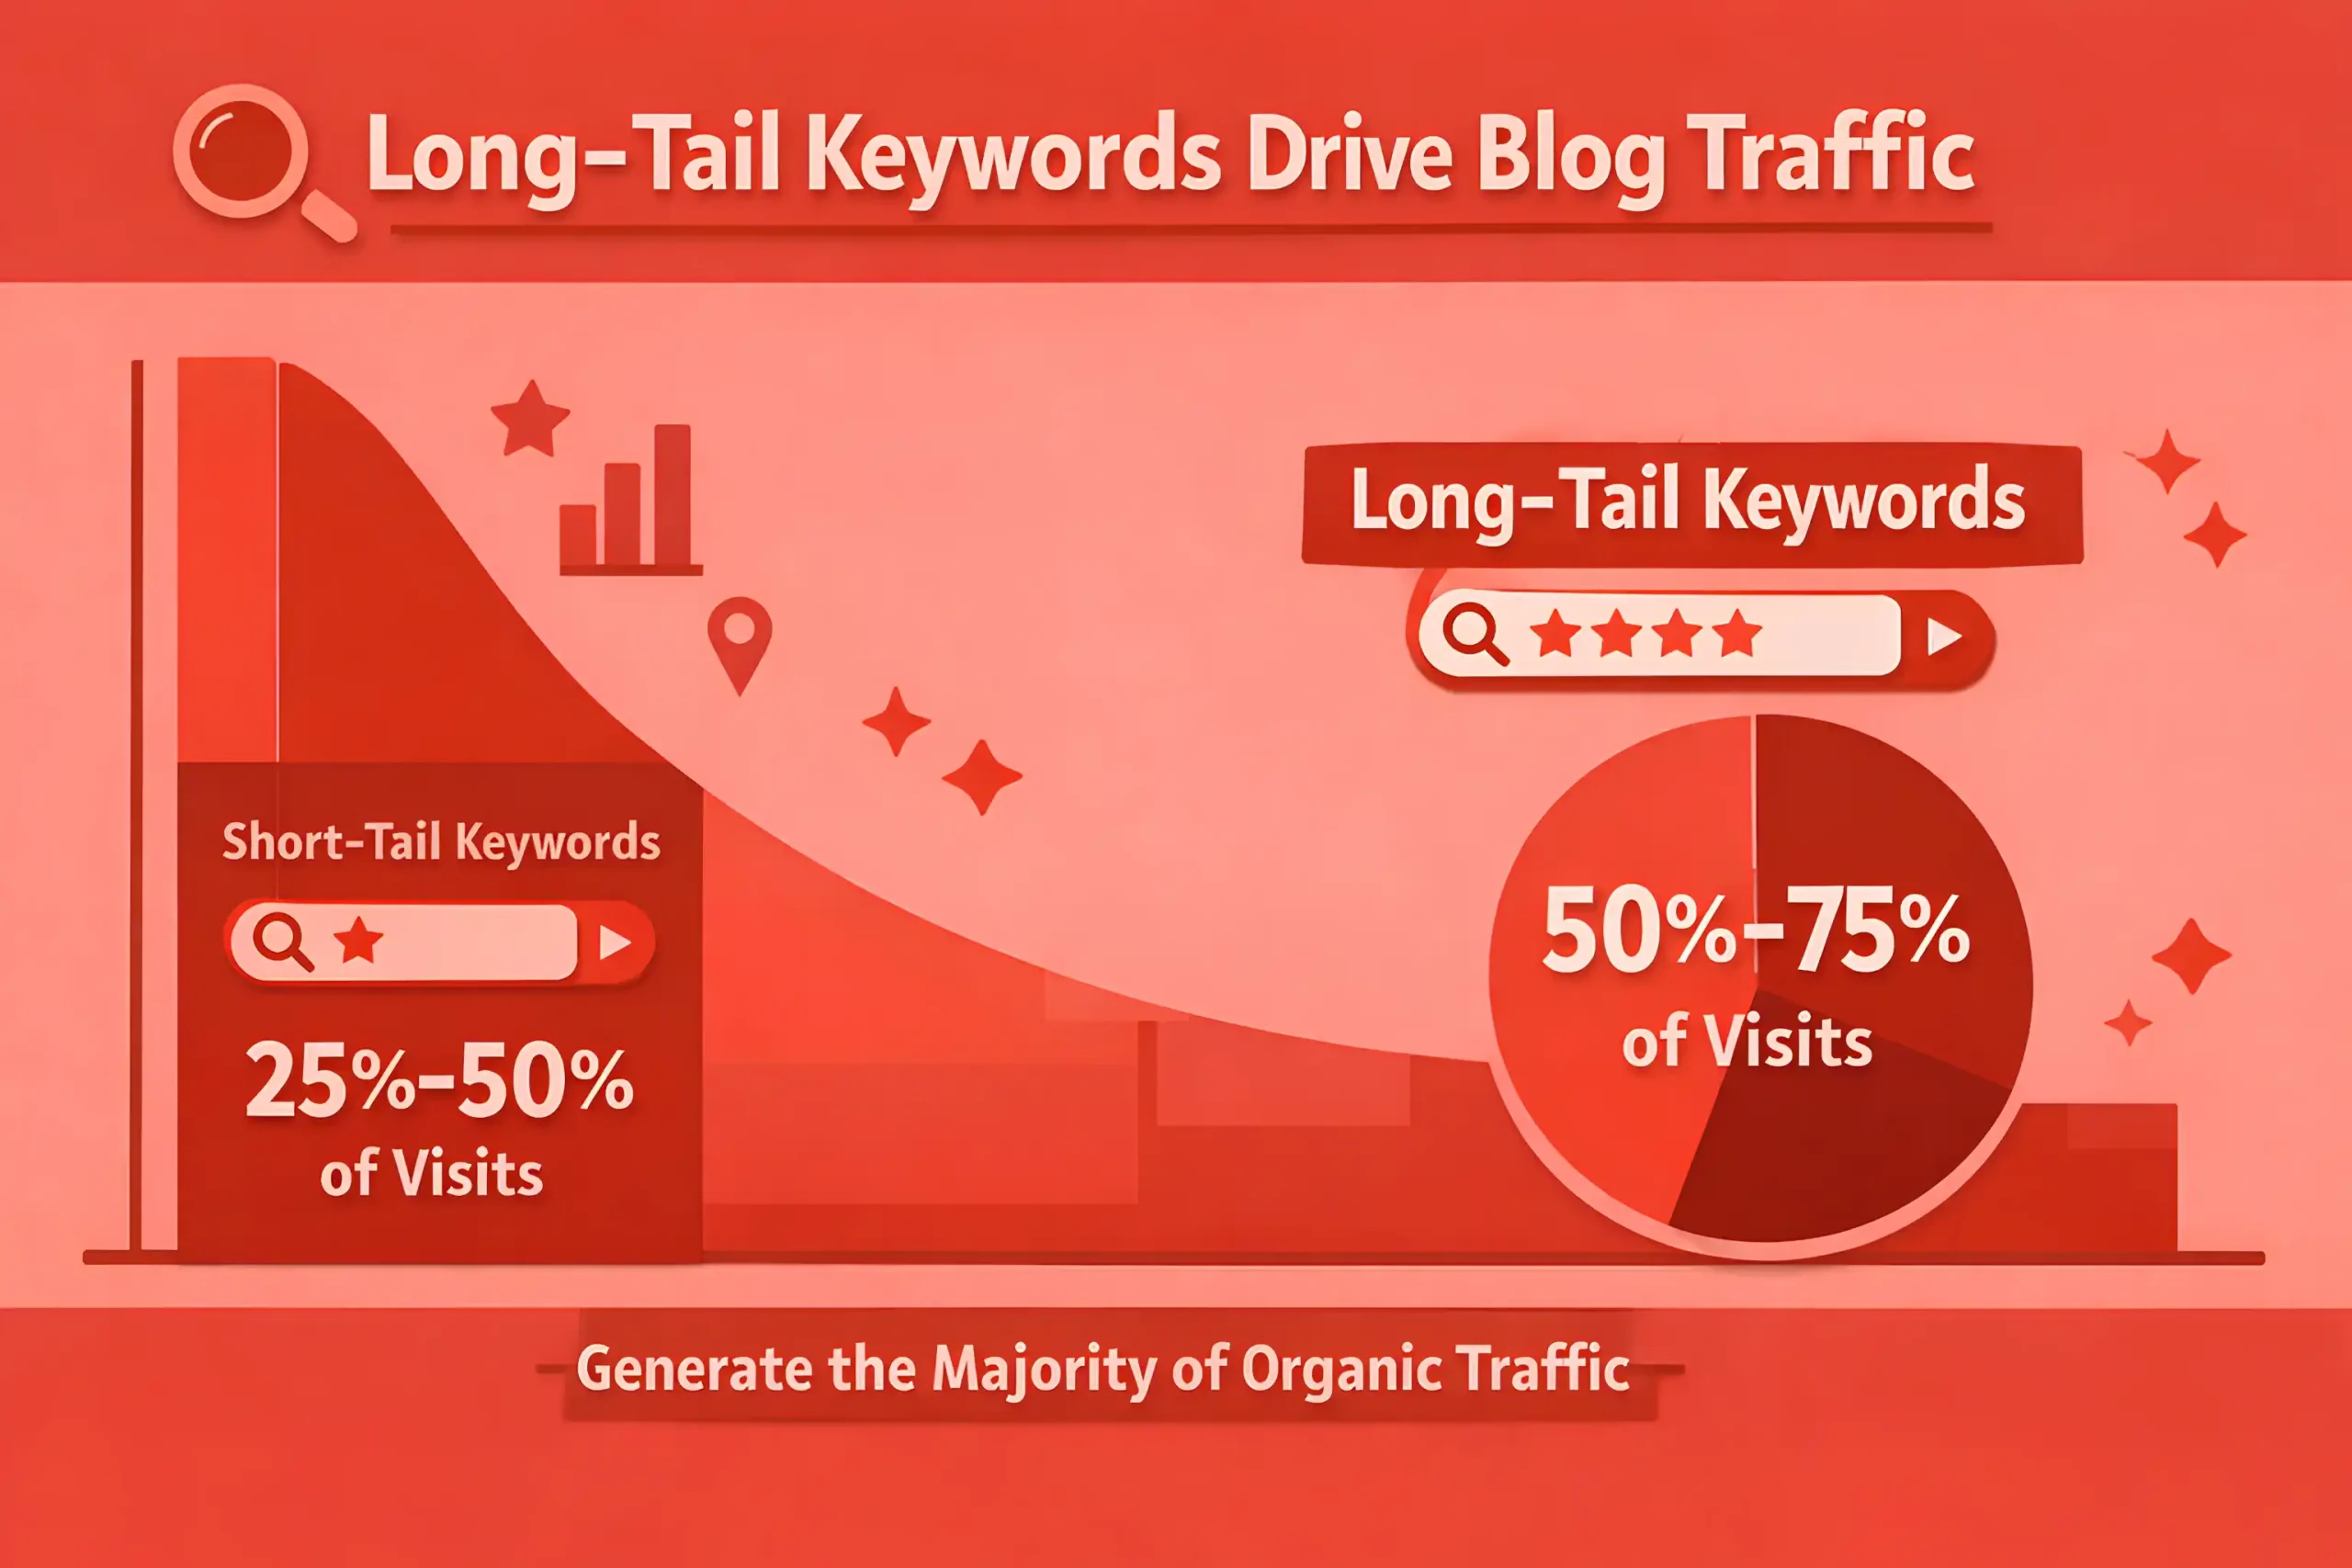
The long tail keeps expanding, and 50% to 75% of organic visits often come from queries outside the top head terms.
SERP features and AI answers reduce click opportunity on some topics, with click share declines of 10% to 35% on generic informational queries.
Category sites with strong internal linking often see faster new page indexing, improving time to initial ranking by 10% to 30%.
Many blogs still underinvest in distribution, and 40% to 65% of posts without amplification often plateau without integration into a full performance marketing mix.
Newsletter and community channels increasingly drive repeat readership, often contributing 10% to 30% of returning visits for strong publishers.
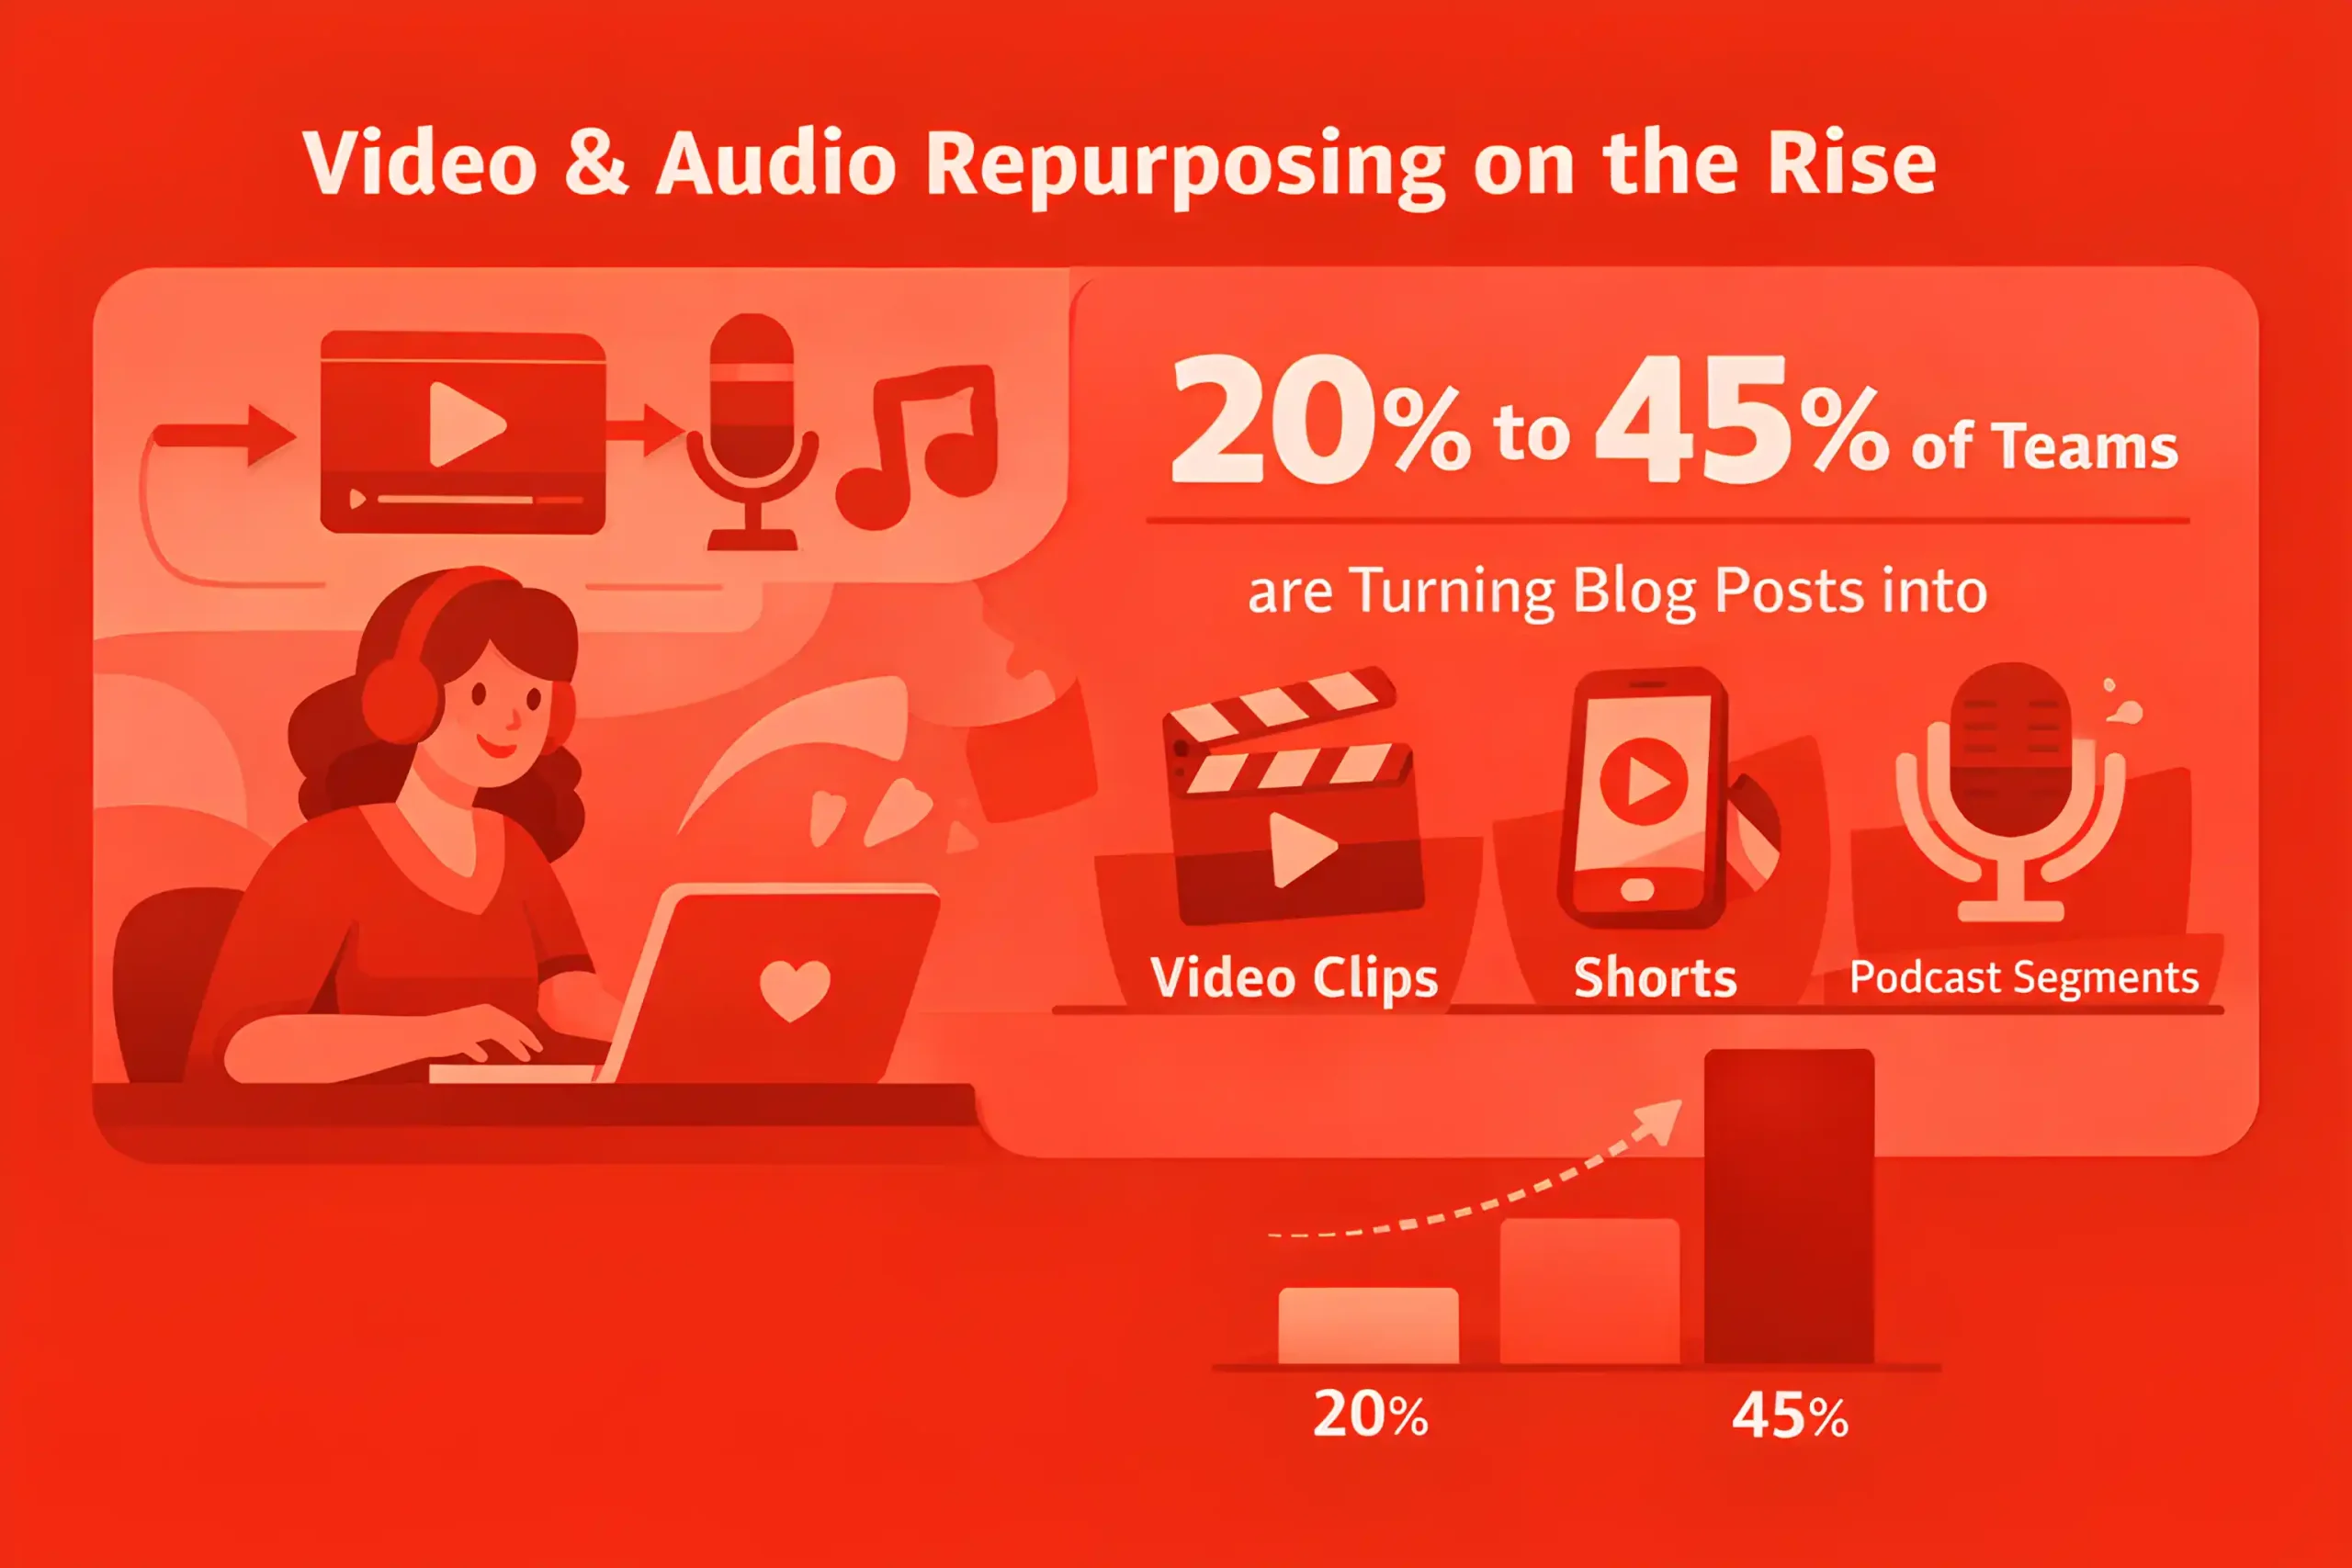
Video and audio repurposing is rising, and 20% to 45% of teams now turn blog posts into clips, shorts, or podcast segments.
In high competition niches, publishing frequency alone often fails, and ranking gains correlate more with depth and authority, often improving results by 10% to 25% when clusters are built.
The most stable growth pattern is fewer high-value posts, with many teams shifting 10% to 30% of effort from net new to upgrades.
Blogging remains a primary inbound lever, but ROI concentrates, with 60% to 80% of results often coming from a small set of core pages.
The biggest market shift is not fewer blogs, but higher standards, where average posts lose visibility unless they add proof, specificity, or original insight.
Also explore: 250+ Digital Marketing Statistics
Content Production, Publishing Frequency & Workflow Statistics
Most content teams publish on a weekly rhythm, and 1 to 4 posts per week is a common range for active blogs.
High-output teams often publish 5 to 20 posts per week, but results depend heavily on quality controls often tied to content writing.
A typical blog post production cycle often takes 5 to 20 working hours end-to-end, including research, drafting, edits, and QA.
Research and outlining commonly take 20% to 40% of total production time on non-trivial topics.
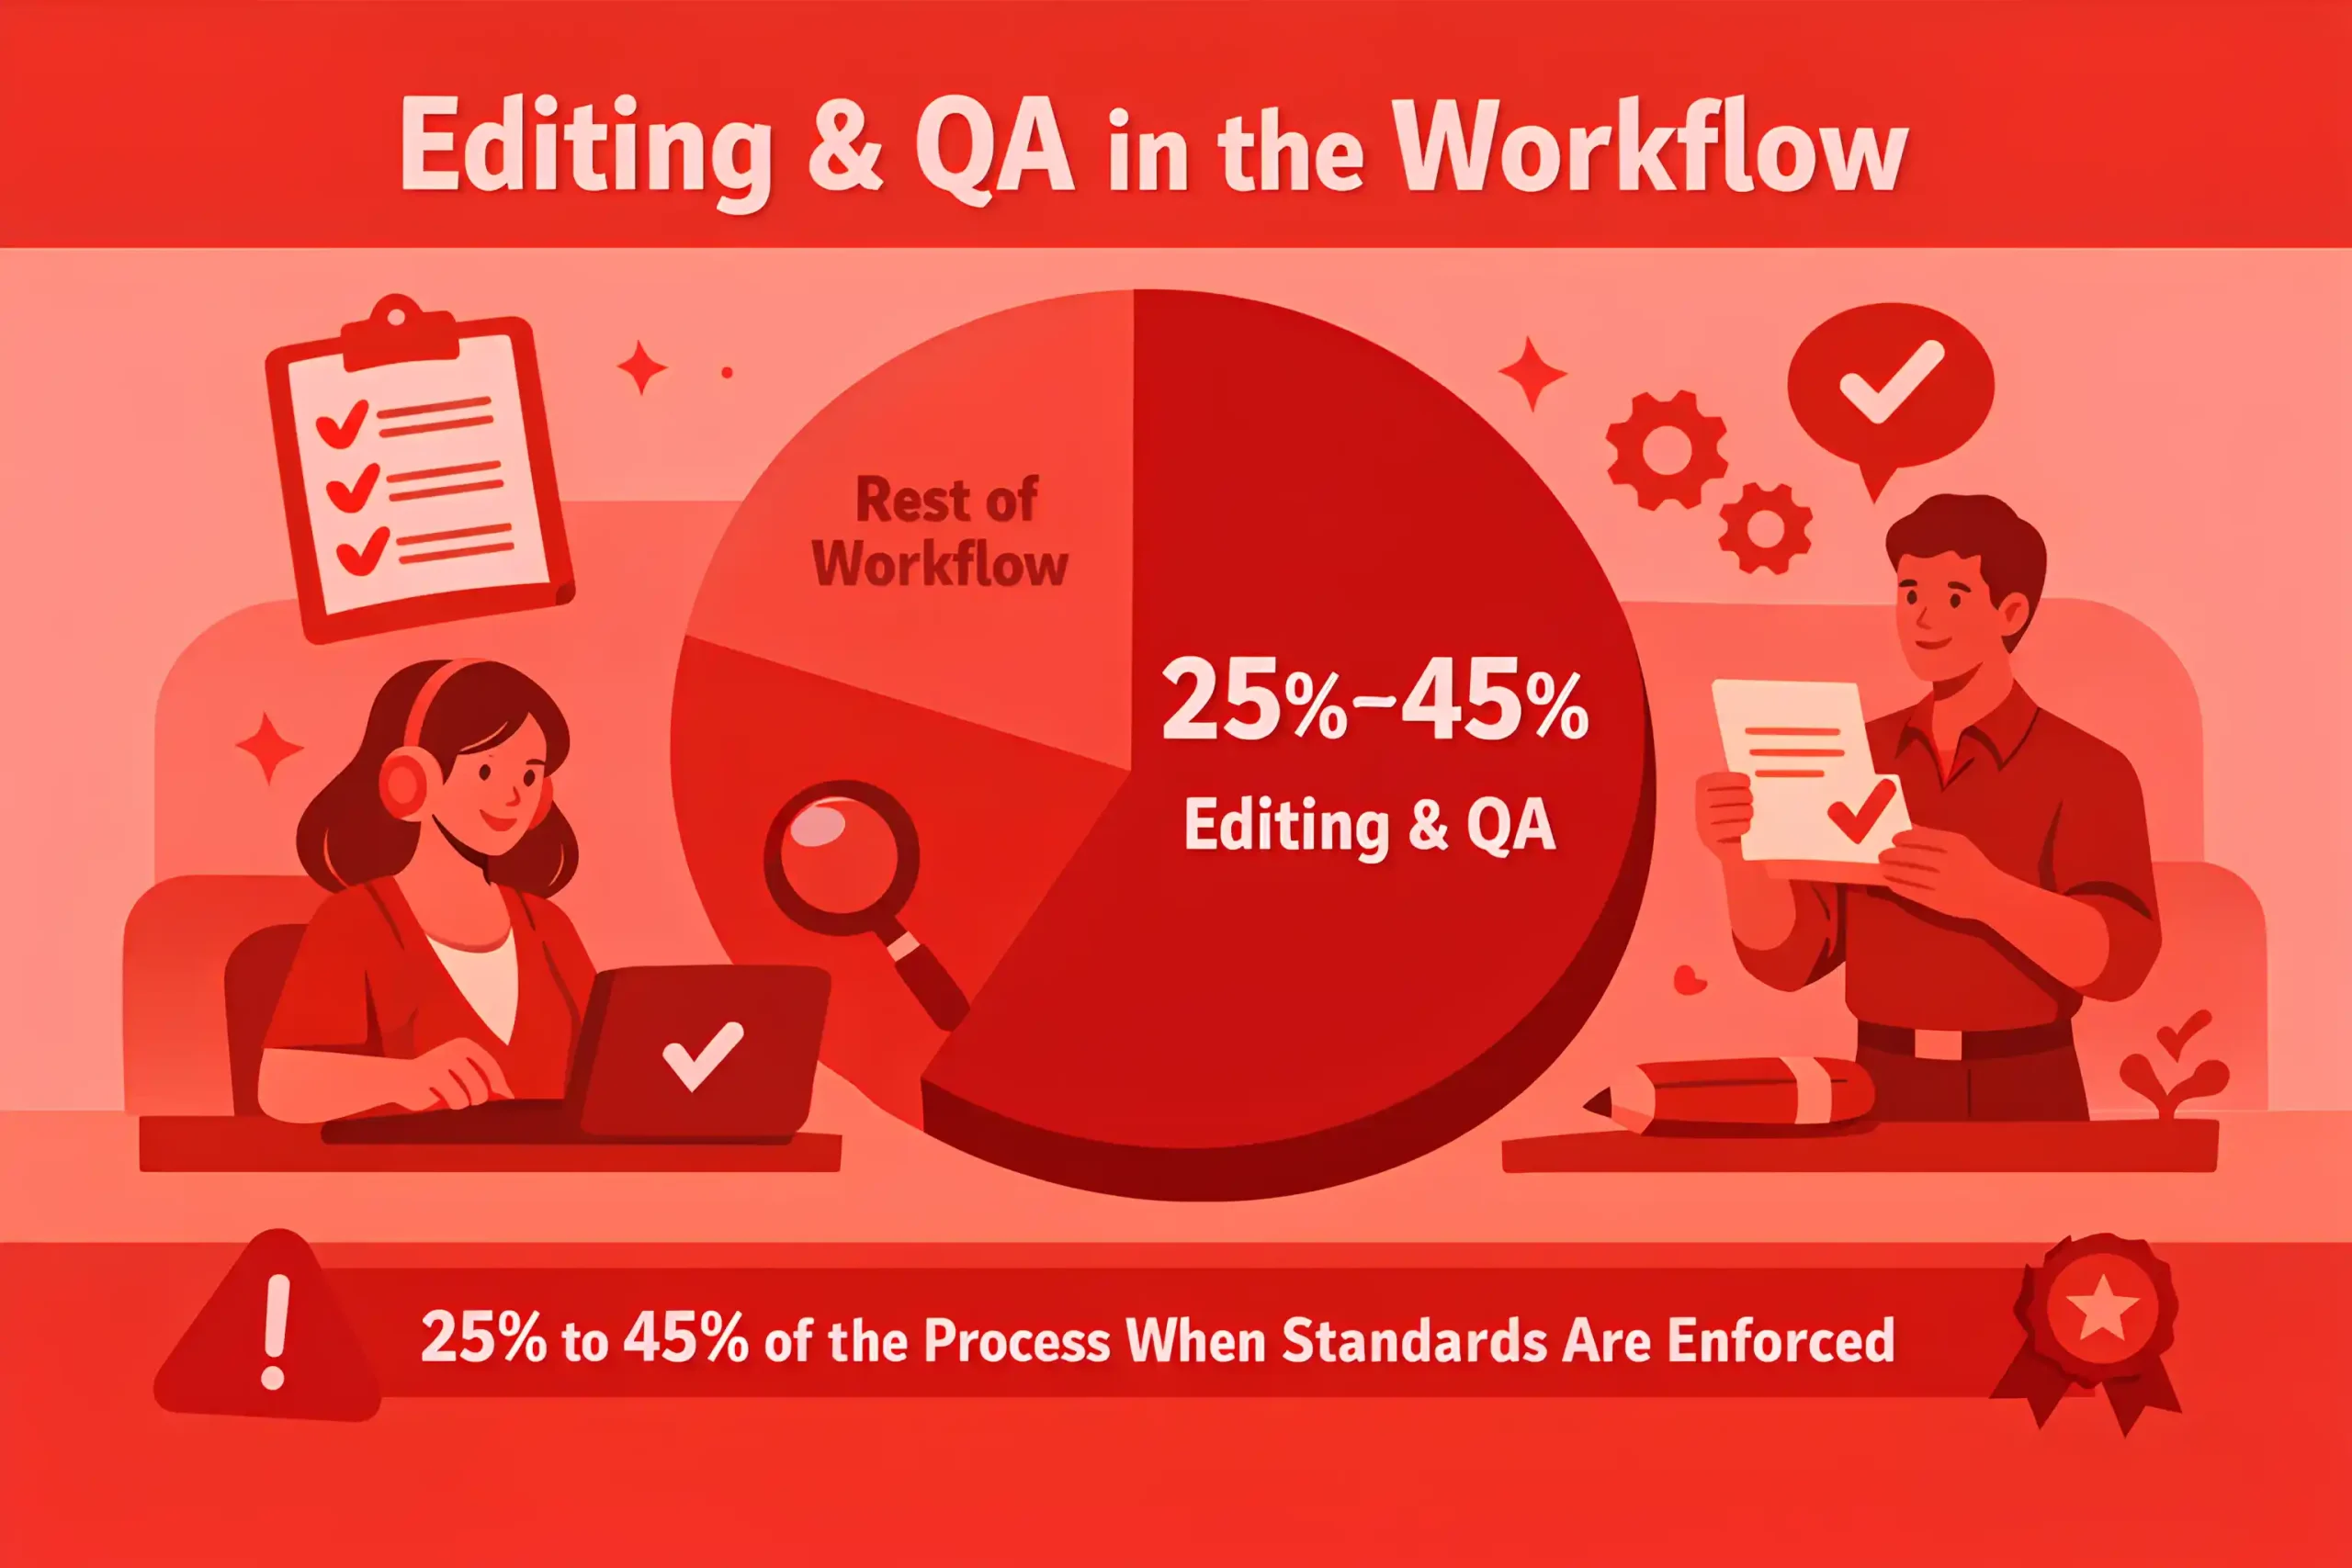
Editing and QA can account for 25% to 45% of the workflow once standards are enforced.
Teams using structured briefs often cut production time by 15% to 35% compared to ad hoc writing.
Templates and repeatable formats often reduce revision rounds by 10% to 25% after the workflow stabilizes.
First drafts are getting faster, and assisted drafting can reduce time to first draft by 30% to 60% on repeatable formats, but measurable gains usually appear when paired with disciplined CRO and performance tracking.
Without a strong review, error rates rise, and rework can erase 30% to 70% of the time saved.
Most teams operate with limited reuse, and 40% to 65% of posts are created as one-offs instead of being repurposed into multiple assets.
Batching improves consistency, and writers who batch often ship 20% to 50% more output per month at similar quality.
Approval cycles are a common bottleneck, and delays can add 1 to 3 weeks to publishing timelines in larger teams.
Stakeholder review often increases variance, and 10% to 30% of posts get stalled due to subject matter disagreements.
Content calendars frequently slip, with 20% to 40% of planned posts delayed in teams without clear owners.
Updating existing content is usually faster than net new, often requiring 30% to 50% less time per asset.
Evergreen refresh programs often cover 10% to 25% of a library per year, depending on topic volatility.
Teams that tie publishing to distribution tend to see stronger results, yet 40% to 60% still publish without a consistent promotion plan.
A simple workflow maturity signal is fewer revision loops, and mature teams often keep it to 1 to 2 major revision rounds per post.
Content operations tools reduce admin work, often saving 10% to 25% of time spent on coordination and handoffs.
Also read: 100+ Reputation Management Statistics
Blog Traffic, SEO Performance & Search Behavior Statistics
Organic search often drives 50% to 80% of blog traffic for content sites.
A small slice of posts usually generates most results, with 10% to 20% of URLs
driving 60% to 80% of organic sessions, so teams prioritize what to scale inside enterprise SEO.
New posts commonly take 3 to 6 months to reach stable rankings, and 6 to 12 months to become reliable traffic drivers in competitive niches.
Long tail queries often account for 50% to 75% of total organic visits across a blog.
Click-through rates drop sharply below the top results, and positions 4 to 10 often see 2x to 5x lower CTR than top three placements.
SERP features and AI answers can reduce clicks on generic informational topics, with declines of 10% to 35% in affected query sets.
High intent posts, such as comparisons and “best” pages, often convert 1.5x to 3x higher than pure informational posts.
Content refreshes frequently outperform net new posts on ROI, lifting organic traffic by 10% to 40% within 30 to 90 days.
Internal linking upgrades often drive ranking improvements within 2 to 8 weeks, especially for pages stuck in positions 6 to 20.
Pages with clear topical focus tend to rank faster, reducing time to first page visibility by 10% to 25%.
Thin or overlapping posts often compete with each other, and consolidation can improve traffic by 10% to 35%, plus indexing cleanup is a standard deliverable in technical SEO services.
Featured snippet wins can add incremental traffic, with lifts of 5% to 20% on eligible queries.
Title and intro improvements often raise CTR by 5% to 15% when matched to intent.
Most posts lose meaningful traffic over time without updates, and 30% to 60% of a library can show a decline after 12 to 24 months.
Evergreen posts with steady update cycles often keep 70% to 90% of peak traffic over a year.
Core Web Vitals and mobile performance issues can suppress growth, and fixing them can raise organic sessions by 5% to 15% on affected templates.
Backlinks remain a differentiator, and posts that earn links often rank 1.5x to 3x better than similar posts without links.
Original data posts often attract 2x to 6x more referring domains than standard advice posts.
Search behavior is multi-session, and readers often return 2 to 5 times before subscribing or converting on higher intent offers.
The most stable growth comes from fewer, deeper assets that earn links, get updated, and sit inside a clear topic cluster.
Related reading: 100+ AI Marketing Statistics
Content Promotion, Distribution Channels & Social Sharing Statistics
A large share of posts receive little promotion, and 40% to 65% are shared only once or not at all beyond publishing.
Teams with a defined distribution plan often see 1.5x to 3x higher total traffic per post than publish teams.
Email newsletters frequently drive the highest repeat traffic, often contributing 10% to 30% of visits for established publishers, which fits naturally under email marketing services.
Social traffic tends to be spiky, with 50% to 80% of social sessions arriving in the first 48 hours after sharing.
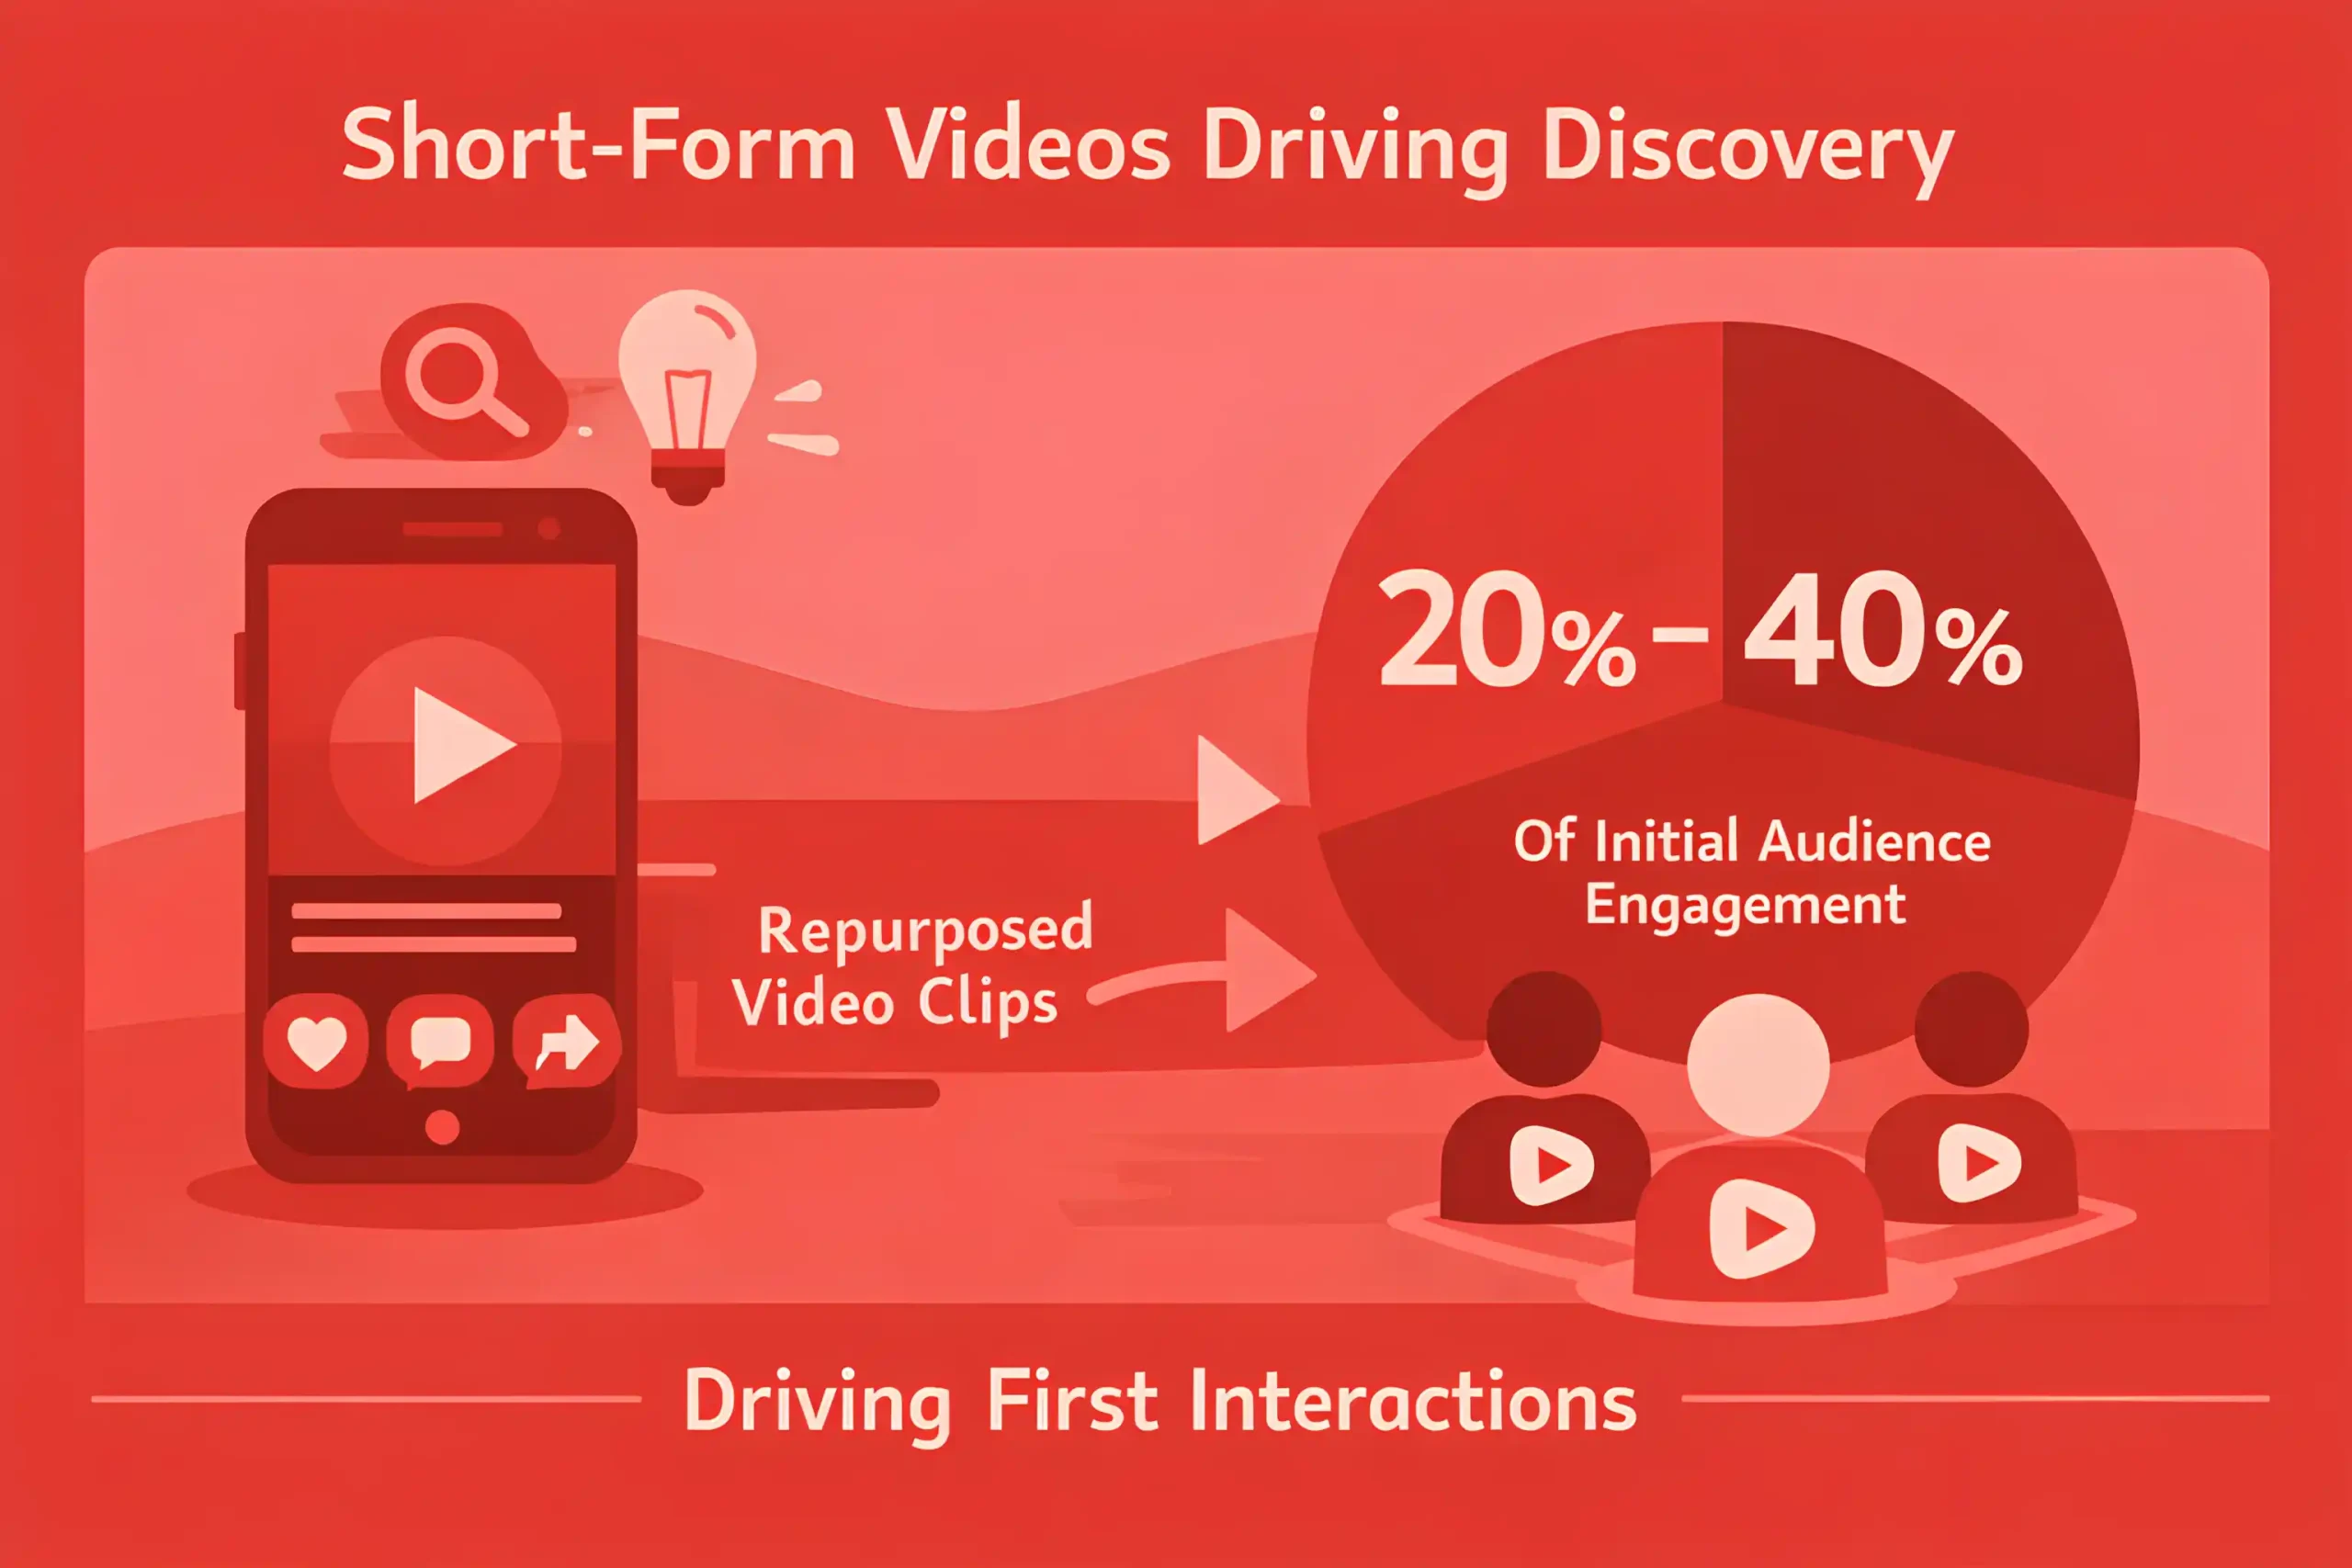
Short-form video clips increasingly power discovery, and repurposed clips can generate 20% to 40% of first touches for some topics.
LinkedIn often performs best for B2B content, where engagement rates can be 2x to 5x higher, and sustained performance usually comes from consistent systems run through social media marketing.
Twitter or X-style sharing still matters for newsy topics, but decay is fast, often within 6 to 24 hours.
Paid amplification is used selectively, and only 10% to 25% of content teams regularly boost posts with paid spend.
Organic social reach is limited, and algorithm changes can swing distribution results by 15% to 50% month to month.
Community shares, such as Slack groups and forums, often drive high intent traffic, with conversion rates 10% to 30% higher than broad social.
Syndication can expand reach, but referral traffic is often modest, and many placements drive 1% to 5% of total sessions.
Partner newsletters can be strong, and copromoted content often yields 2x to 6x higher referral traffic than standard social sharing.
Distribution pacing matters, and multi-post sharing schedules can extend traffic half-life by 20% to 60% versus a single share.
Republishing and content upgrades often retrigger distribution, with traffic lifts of 10% to 35% when promoted as “updated.”
UTM discipline is inconsistent, and 30% to 60% of teams still misattribute distribution impact due to weak tagging.
Content that includes a clear takeaway often gets shared more, with share rates 10% to 25% higher than abstract posts.
Readers share less than marketers hope, and monthly sharing behavior often lands around 5% to 15% of active readers.
The highest share driver is usefulness, and practical templates or benchmark posts often earn 1.5x to 4x more shares than opinion pieces.
Internal distribution, via sales and CS teams, is underused, and only 15% to 30% of companies consistently share new posts internally.
The biggest distribution advantage comes from owned channels, where a strong list plus consistent repurposing can compound results over quarters.
You might also find useful: 100+ Email Marketing Statistics
Monetization, Leads, Conversion Rates & ROI Statistics
Email signup rates from blog traffic often land around 0.5% to 2.0% of sessions when the offer is generic.
A strong content upgrade can push opt-in rates into the 2% to 6% range on high-intent pages.
Inline CTAs inside the first third of the article often lift conversions 10% to 30% versus footer forms.
Exit intent capture commonly converts 0.8% to 3.0%, but quality varies more than volume.
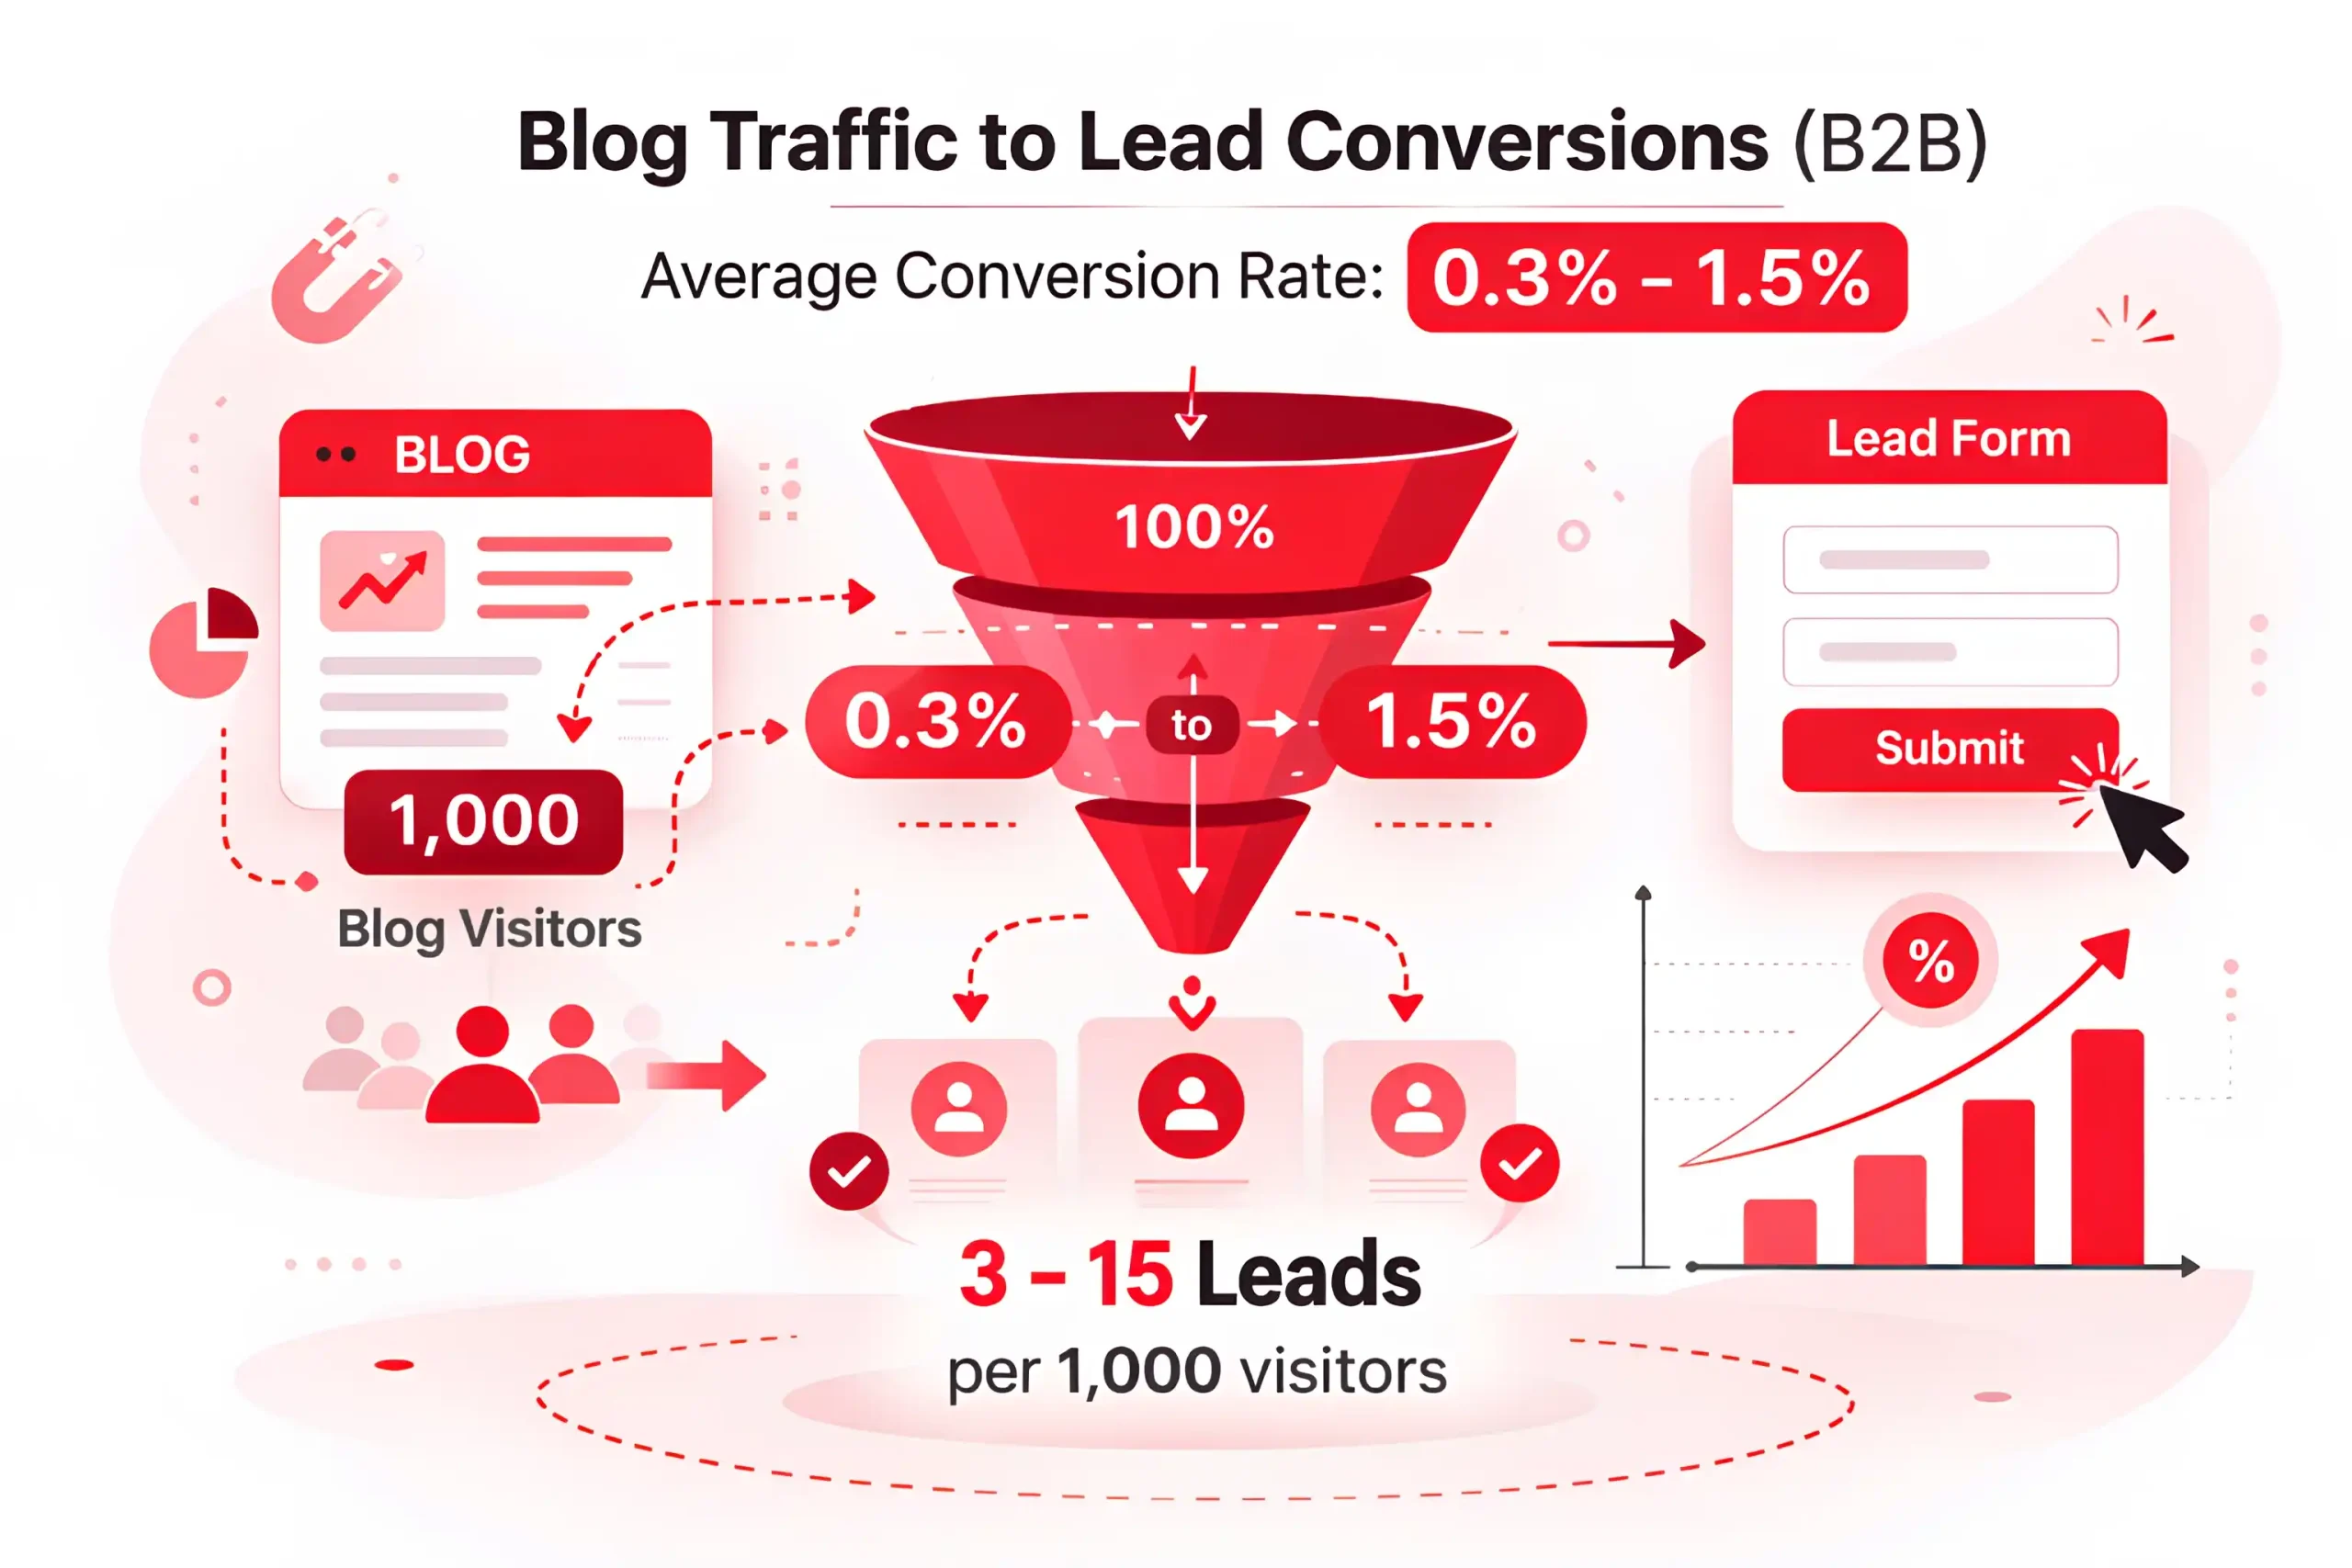
Lead form conversion rates from blog traffic in B2B often fall between 0.3% and 1.5%.
Evaluation intent pages can convert 1.5x to 3x higher than informational posts, especially on comparison and alternatives topics.
Blog to demo conversion in B2B SaaS commonly sits around 0.2% to 1.0% per session across a full library.
Blog to trial conversion often ranges from 0.2% to 1.2%, with higher rates when onboarding friction is low.
Retargeting blog visitors can reduce paid acquisition costs 5% to 20% once audiences reach scale.
Assisted conversions from blog content can account for 20% to 50% of closed won deals when tracking is set up well.
Multi-step paths that start with an email capture often improve qualified lead volume 10% to 25% compared to direct form pushes.
Organic blog visitors often convert 10% to 40% higher than social visitors in lead gen funnels.
Revenue per visitor on high-intent blog pages can run 2x to 5x higher than top funnel educational posts.
Affiliate click-to-purchase conversion commonly falls between 0.5% and 3.0%, depending on category and intent match.
Affiliate earnings per thousand sessions often cluster around $10 to $60, with higher ceilings in finance and software niches.
Sponsored post pricing varies widely, but many publishers land between $500 and $10,000 per post based on traffic and audience fit.
Newsletter-driven returning traffic often converts better, with lead rates 15% to 35% higher than first-time visits.
A realistic payback window for new blog content often spans 6 to 18 months once compounding is included.
Content refresh programs frequently lower the cost per incremental lead by 20% to 50% versus net new publishing.
Most revenue concentration remains heavy, with 10% to 20% of pages often producing 60% to 80% of monetizable outcomes.
Related article: 200+ Social Media Marketing Statistics
The Key Takeaways
In 2026, blogging rewards intent, not volume. Traffic is harder to win, and results concentrate in a small set of pages, so topic focus, internal linking, and updates matter more than publishing more.
Promotion separates winners from “publish and pray.” Strong teams build distribution into the workflow and keep top posts alive through repackaging and refreshes.
Use the stats in our guide to benchmark your current performance, set realistic targets for traffic and conversions, and decide where to invest next, from refreshes and internal linking to promotion and high-intent pages.