In 2026, ad platforms are smarter, competition is tighter, and wasted spend disappears faster than most teams can detect it.
Automation promises efficiency, yet many accounts still bleed budget through inflated CPCs, poor audience signals, and misaligned bidding strategies.
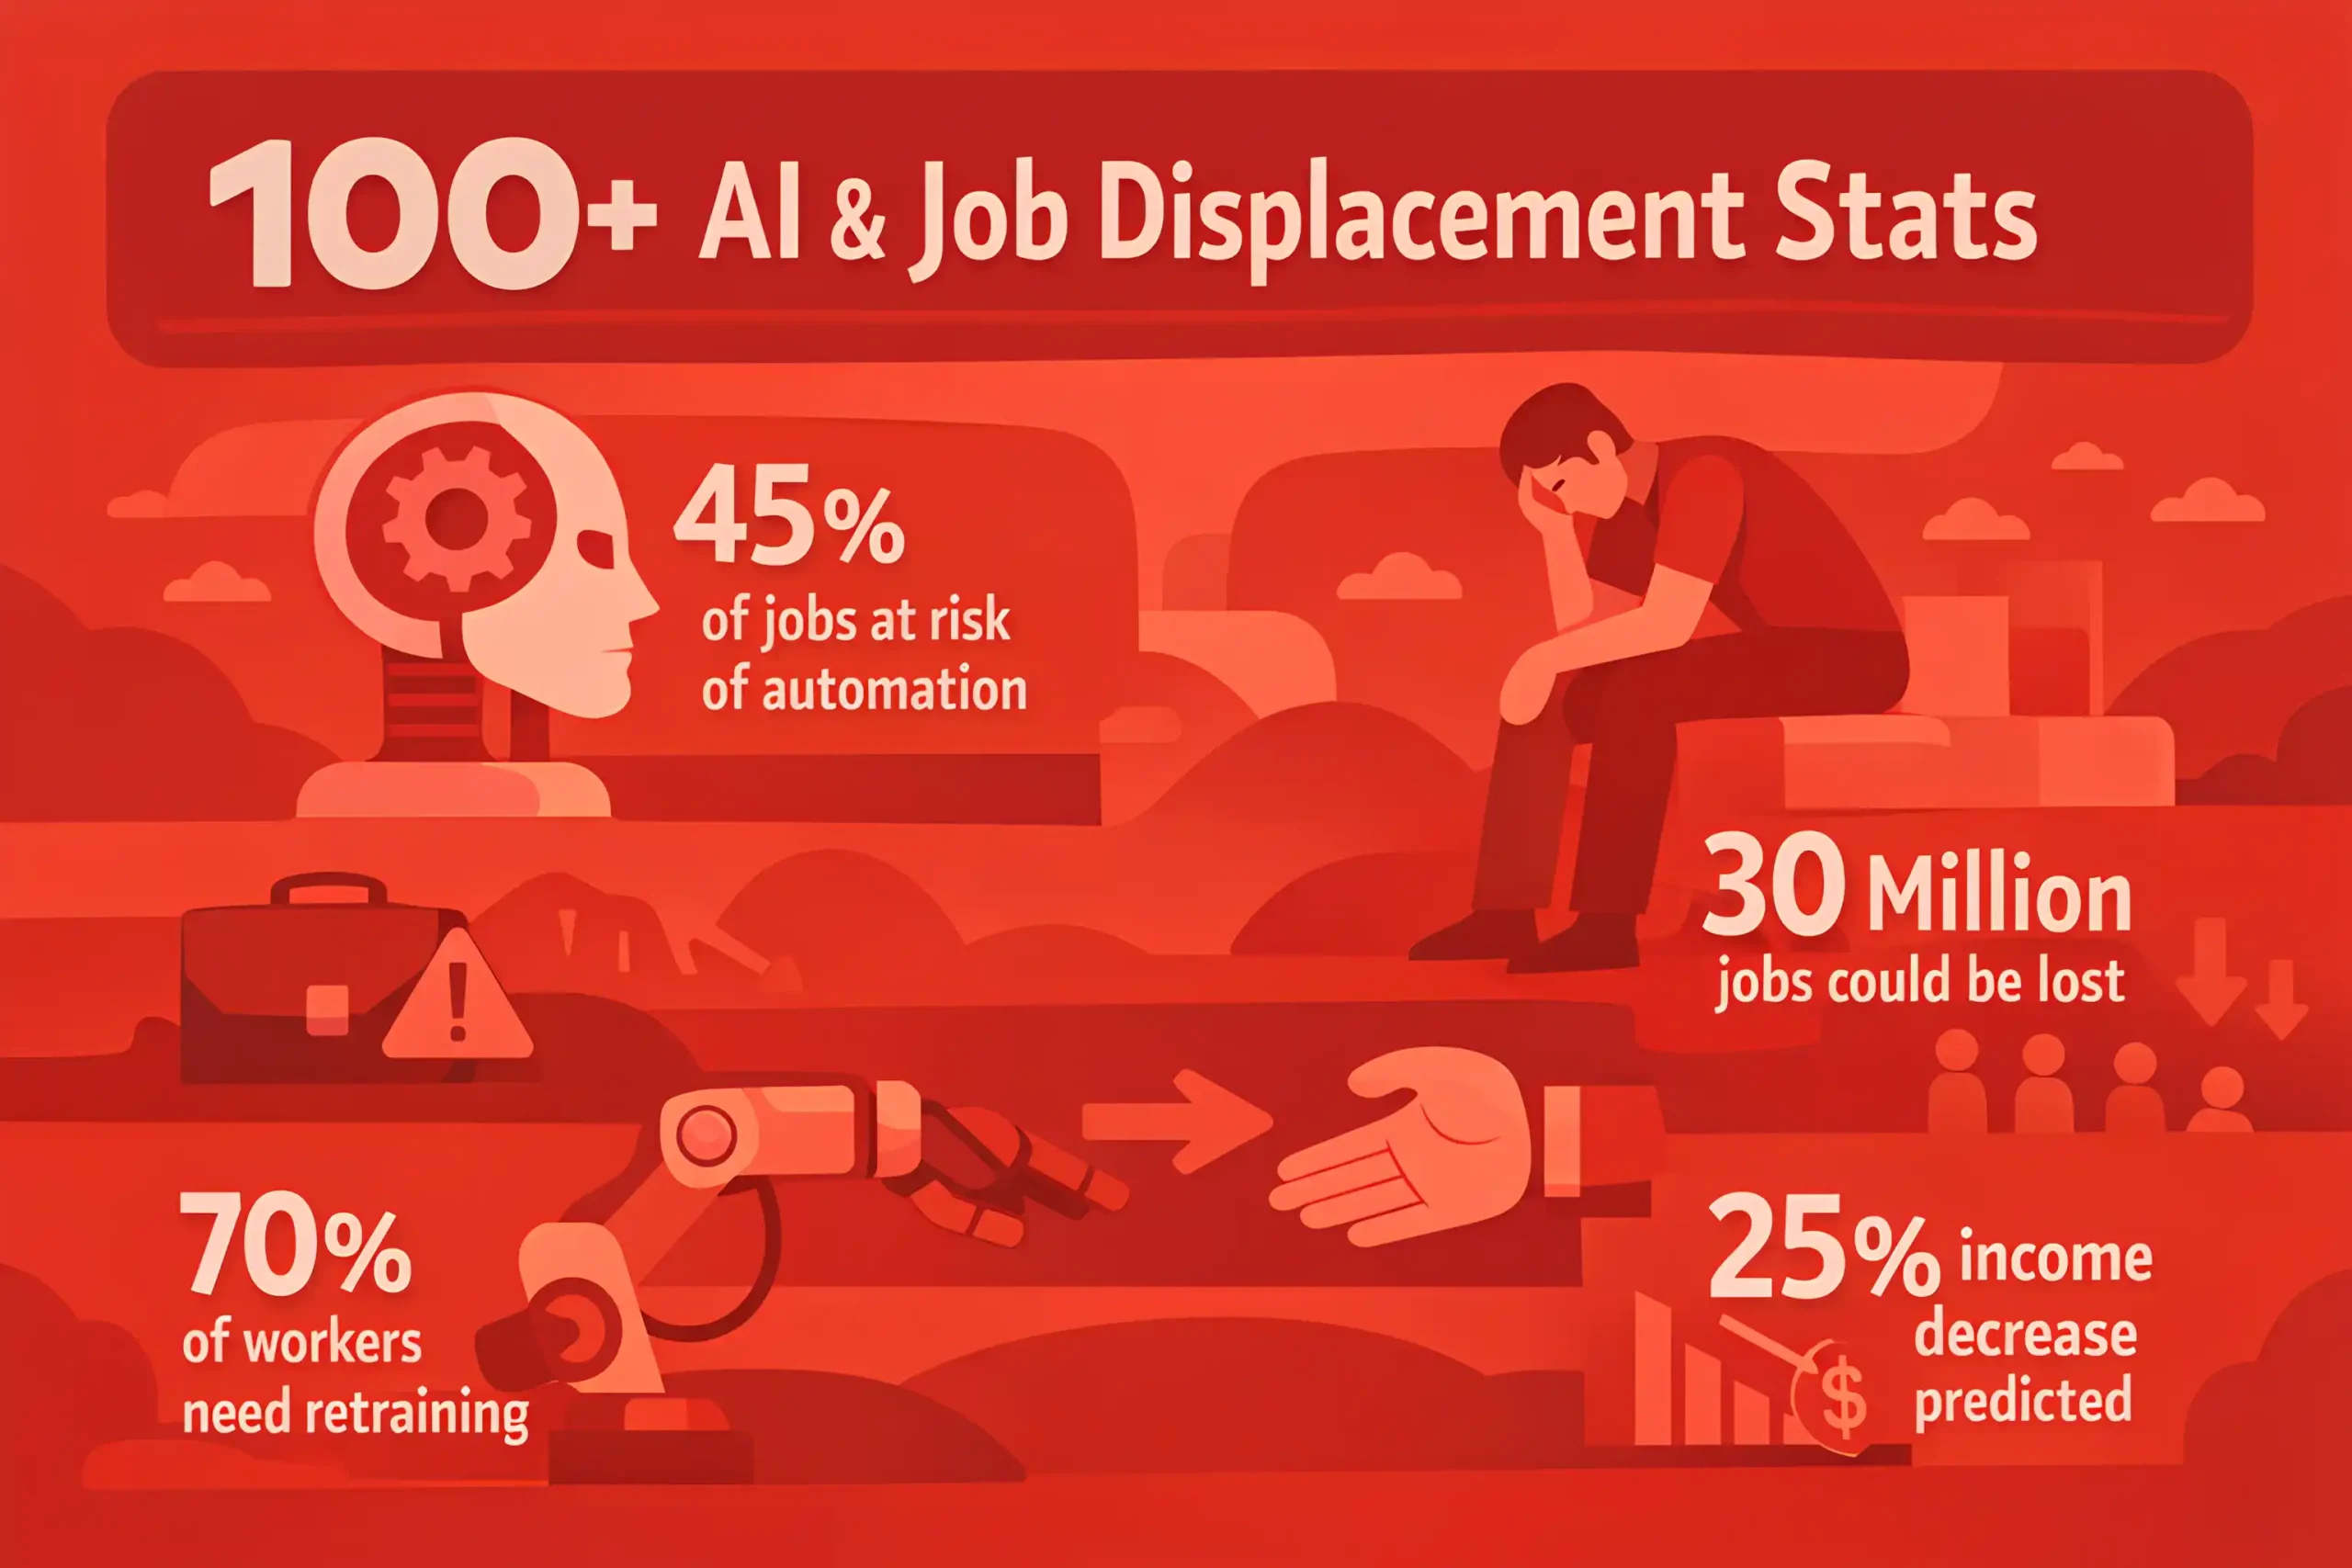
In this NEWMEDIA.COM collection of 100+ PPC statistics, we focus on what is actually happening: rising cost trends across major platforms, conversion benchmarks that separate top performers from average accounts, targeting tactics to lower acquisition costs, and common optimization gaps quietly eroding ROI.
Use these figures to set realistic performance targets, pressure-test your assumptions, and identify where budget can be reallocated for stronger returns.
PPC Spend, CPC, and Inflation Trends
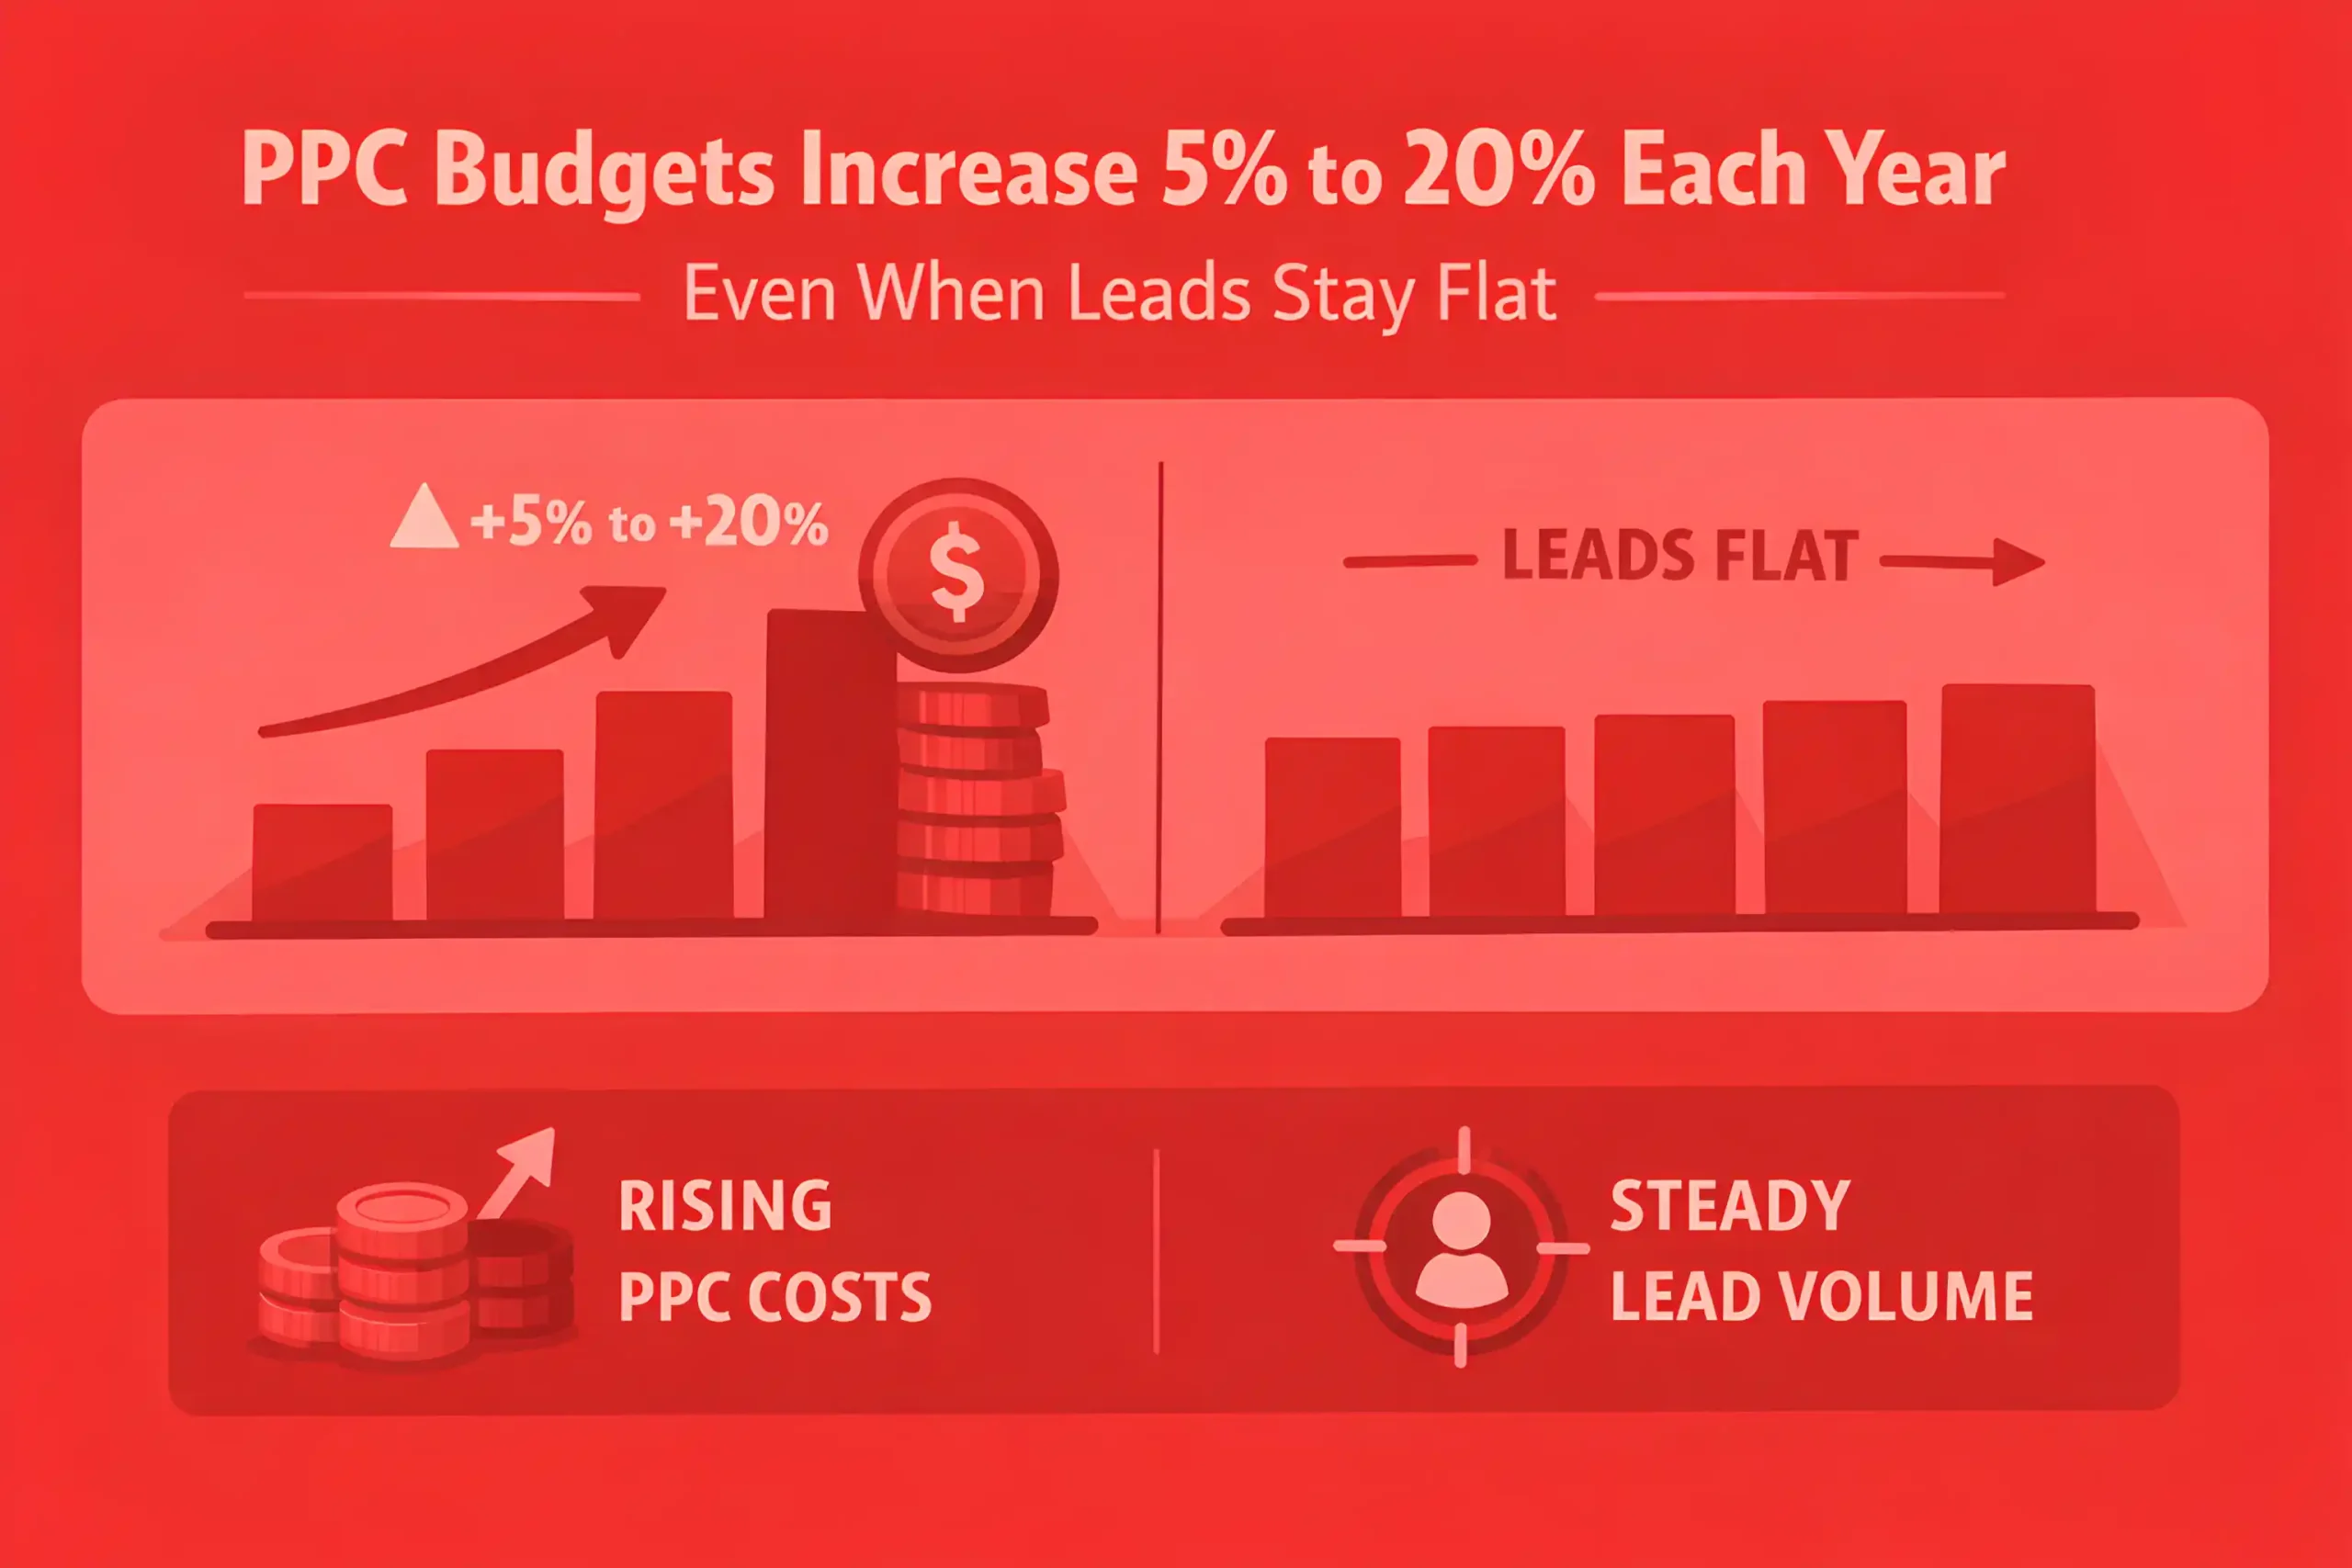
PPC management budgets often rise 5% to 20% year over year in stable categories, even when lead volume stays flat.
Cost inflation is uneven, with average CPC increases typically ranging from 3% to 15% annually across many accounts.
Competitive categories can see CPC jumps of 15% to 40% in a single year when new bidders enter.
Branded CPC inflation is usually lower, often 0% to 8%, unless competitors bid aggressively on your name.
Non-branded CPC inflation tends to be higher, commonly 5% to 20%, driven by auction depth and intent terms.
Q4 often carries the sharpest cost pressure, with CPC and CPM increases of 10% to 35% versus off-peak months.
In B2B, the highest intent keywords often command 2x to 5x higher CPC than top-of-funnel terms, so aligning spend to pipeline via marketing strategy protects ROI when costs rise.
In e-commerce, shopping campaigns often absorb cost swings faster, with CPC shifts of 10% to 30% during promo cycles, which is why e-commerce PPC planning needs seasonality buffers.
Click volume often grows more slowly than spend, so many teams see 5% to 15% more spend for similar click totals.
Conversion rates rarely rise fast enough to offset cost inflation, so CPA often increases 5% to 25% without landing page gains.
Landing page speed and clarity improvements can offset inflation, lowering CPA 5% to 20% even when CPC rises.
Audience targeting and exclusions often reduce wasted spend by 5% to 15% in mature accounts.
Search term cleanup commonly cuts irrelevant clicks 10% to 30%, improving efficiency without more budget.
Automation can raise CPC on broad match expansions, with CPC increases of 5% to 20% when controls are loose.
Accounts that refresh creative and offers consistently often reduce fatigue CPC creep by 3% to 10%.
The biggest cost jumps often come from small changes in impression share, with 5 to 15 points of lost share forcing higher bids.
A realistic planning buffer for inflation is 10% to 20% in competitive markets if volume targets stay constant.
When budgets stay flat during inflation, lead volume commonly falls 5% to 20% unless the conversion rate improves.
Efficient accounts often shift 10% to 30% of the budget toward higher converting segments to protect CPA during inflation.
The cleanest way to read inflation impact is to track CPC, conversion rate, and CPA together, since any single metric can mislead.
You might also find interesting: 100+ Branding Stats for 2026
Conversion Rates, CPA, and ROI Benchmarks by Channel
Google Search Ads average a 4.1% conversion rate, with strong intent but big variation by industry and offer.
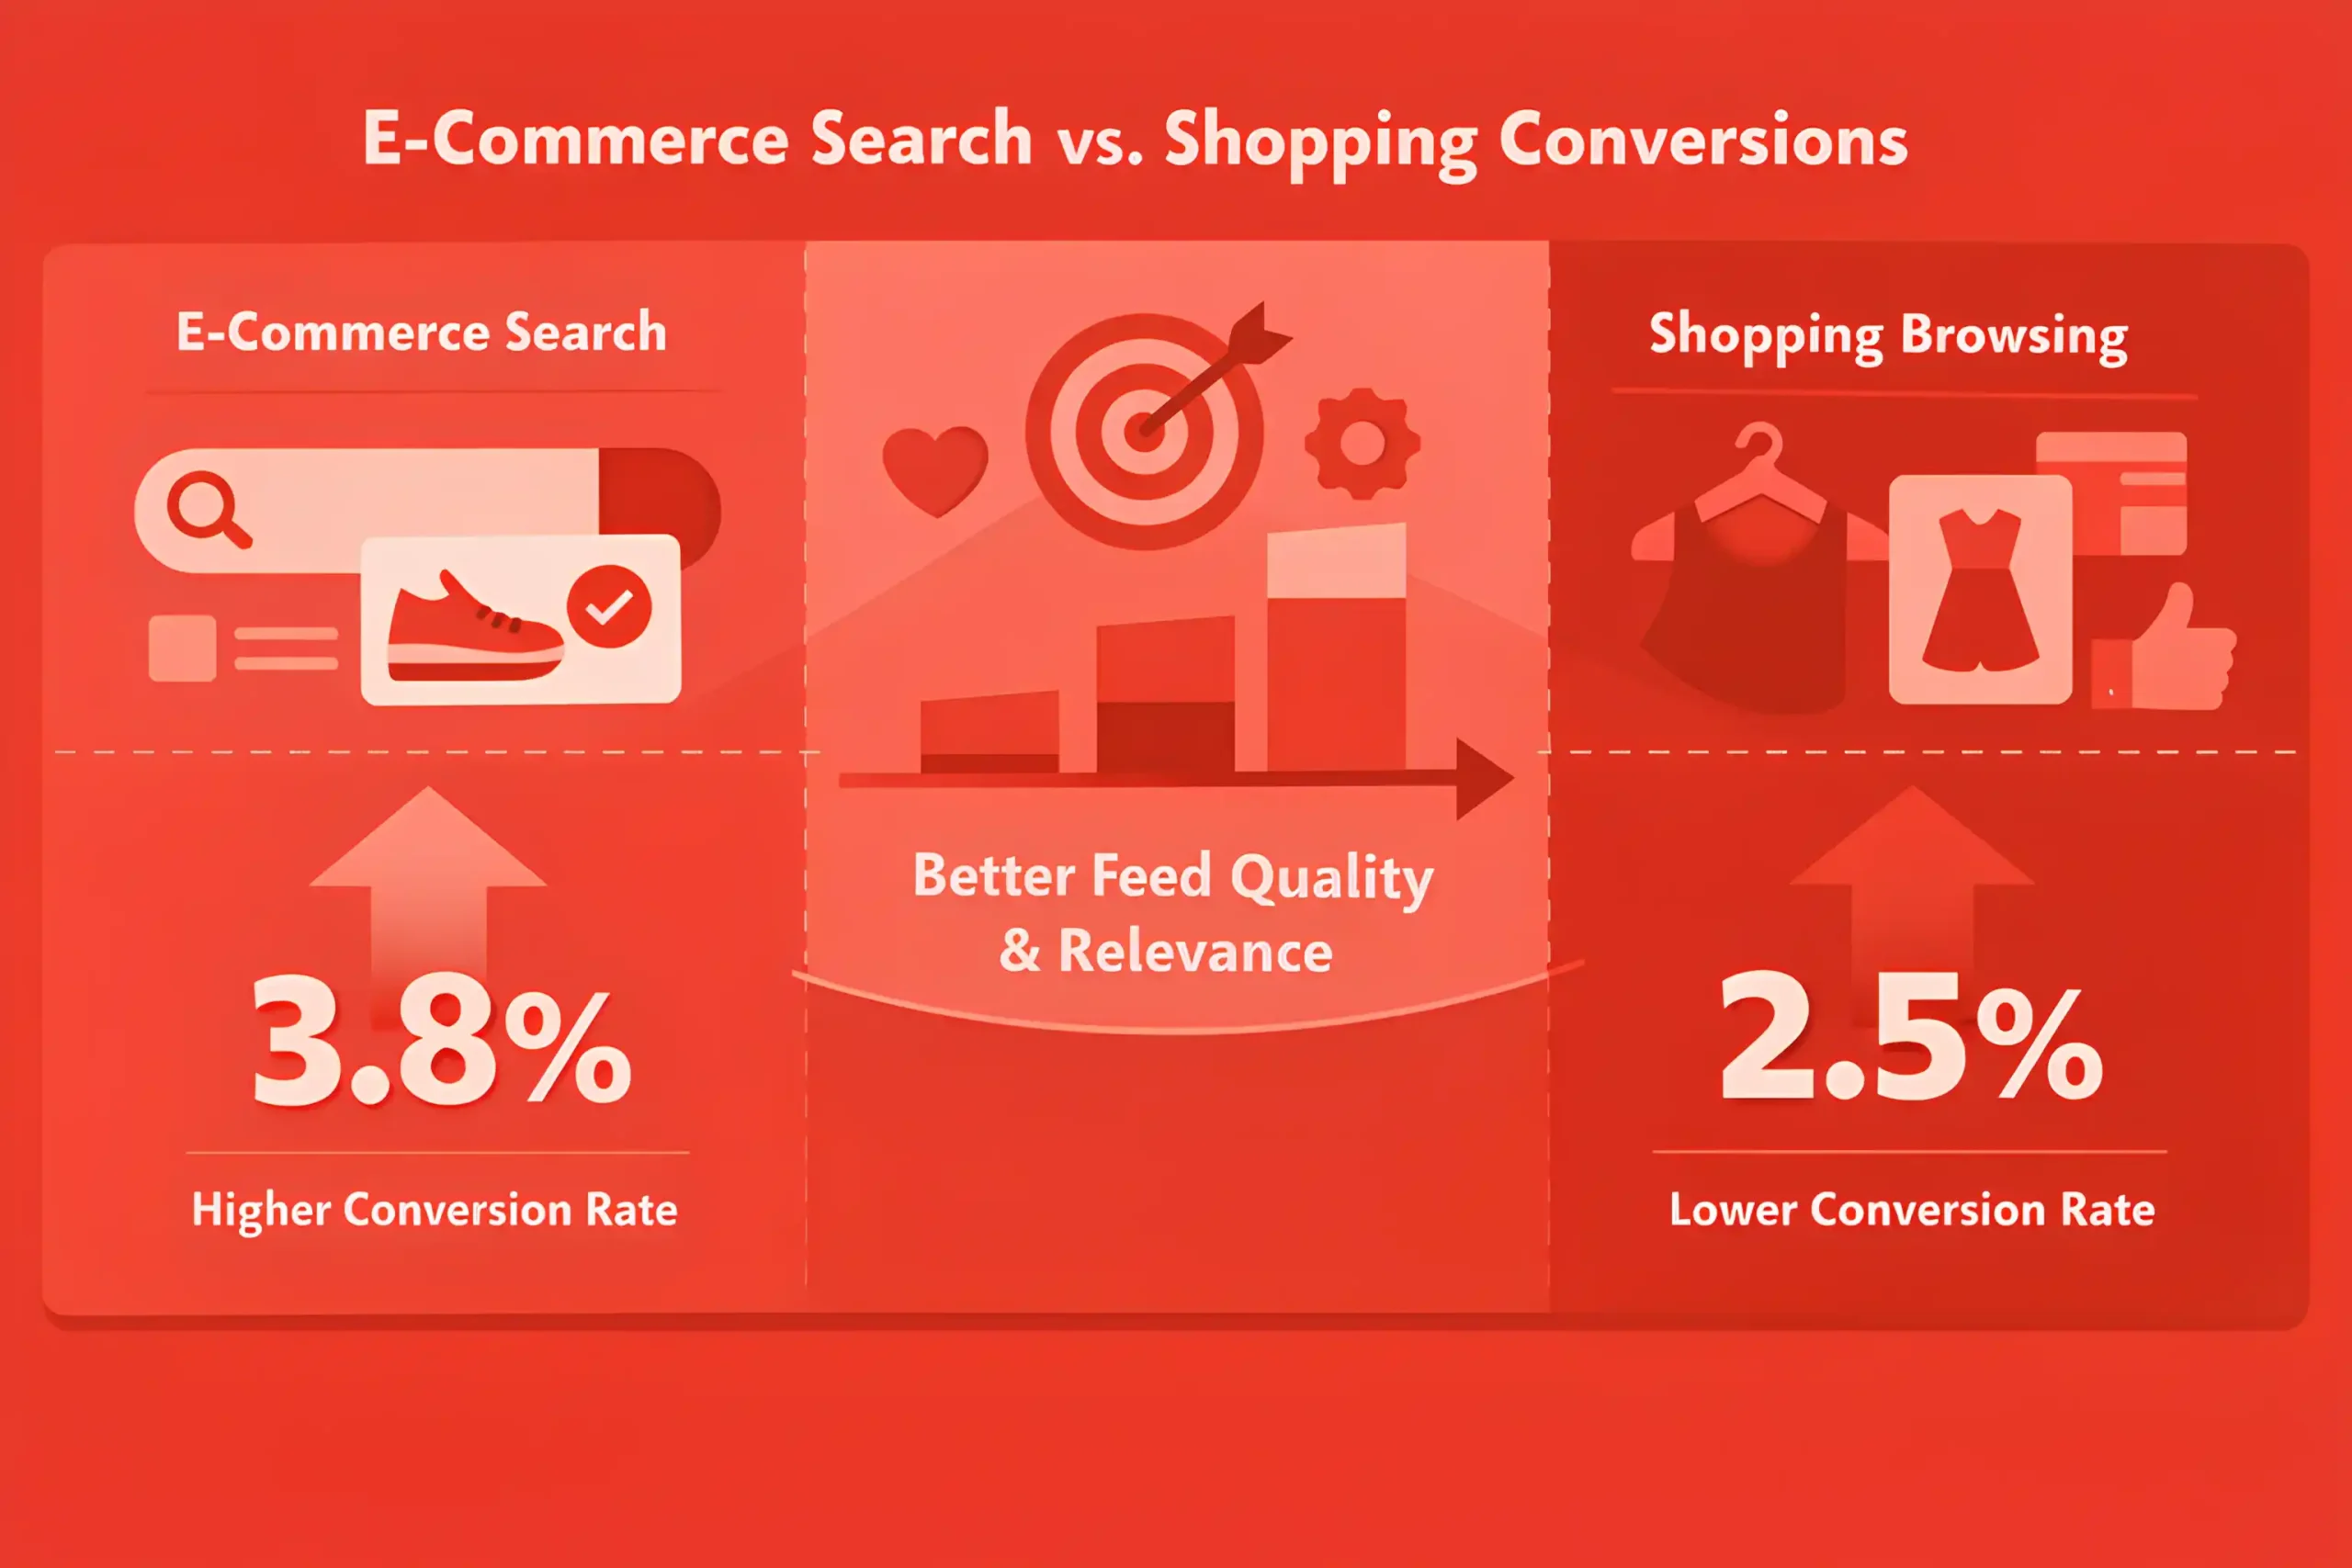
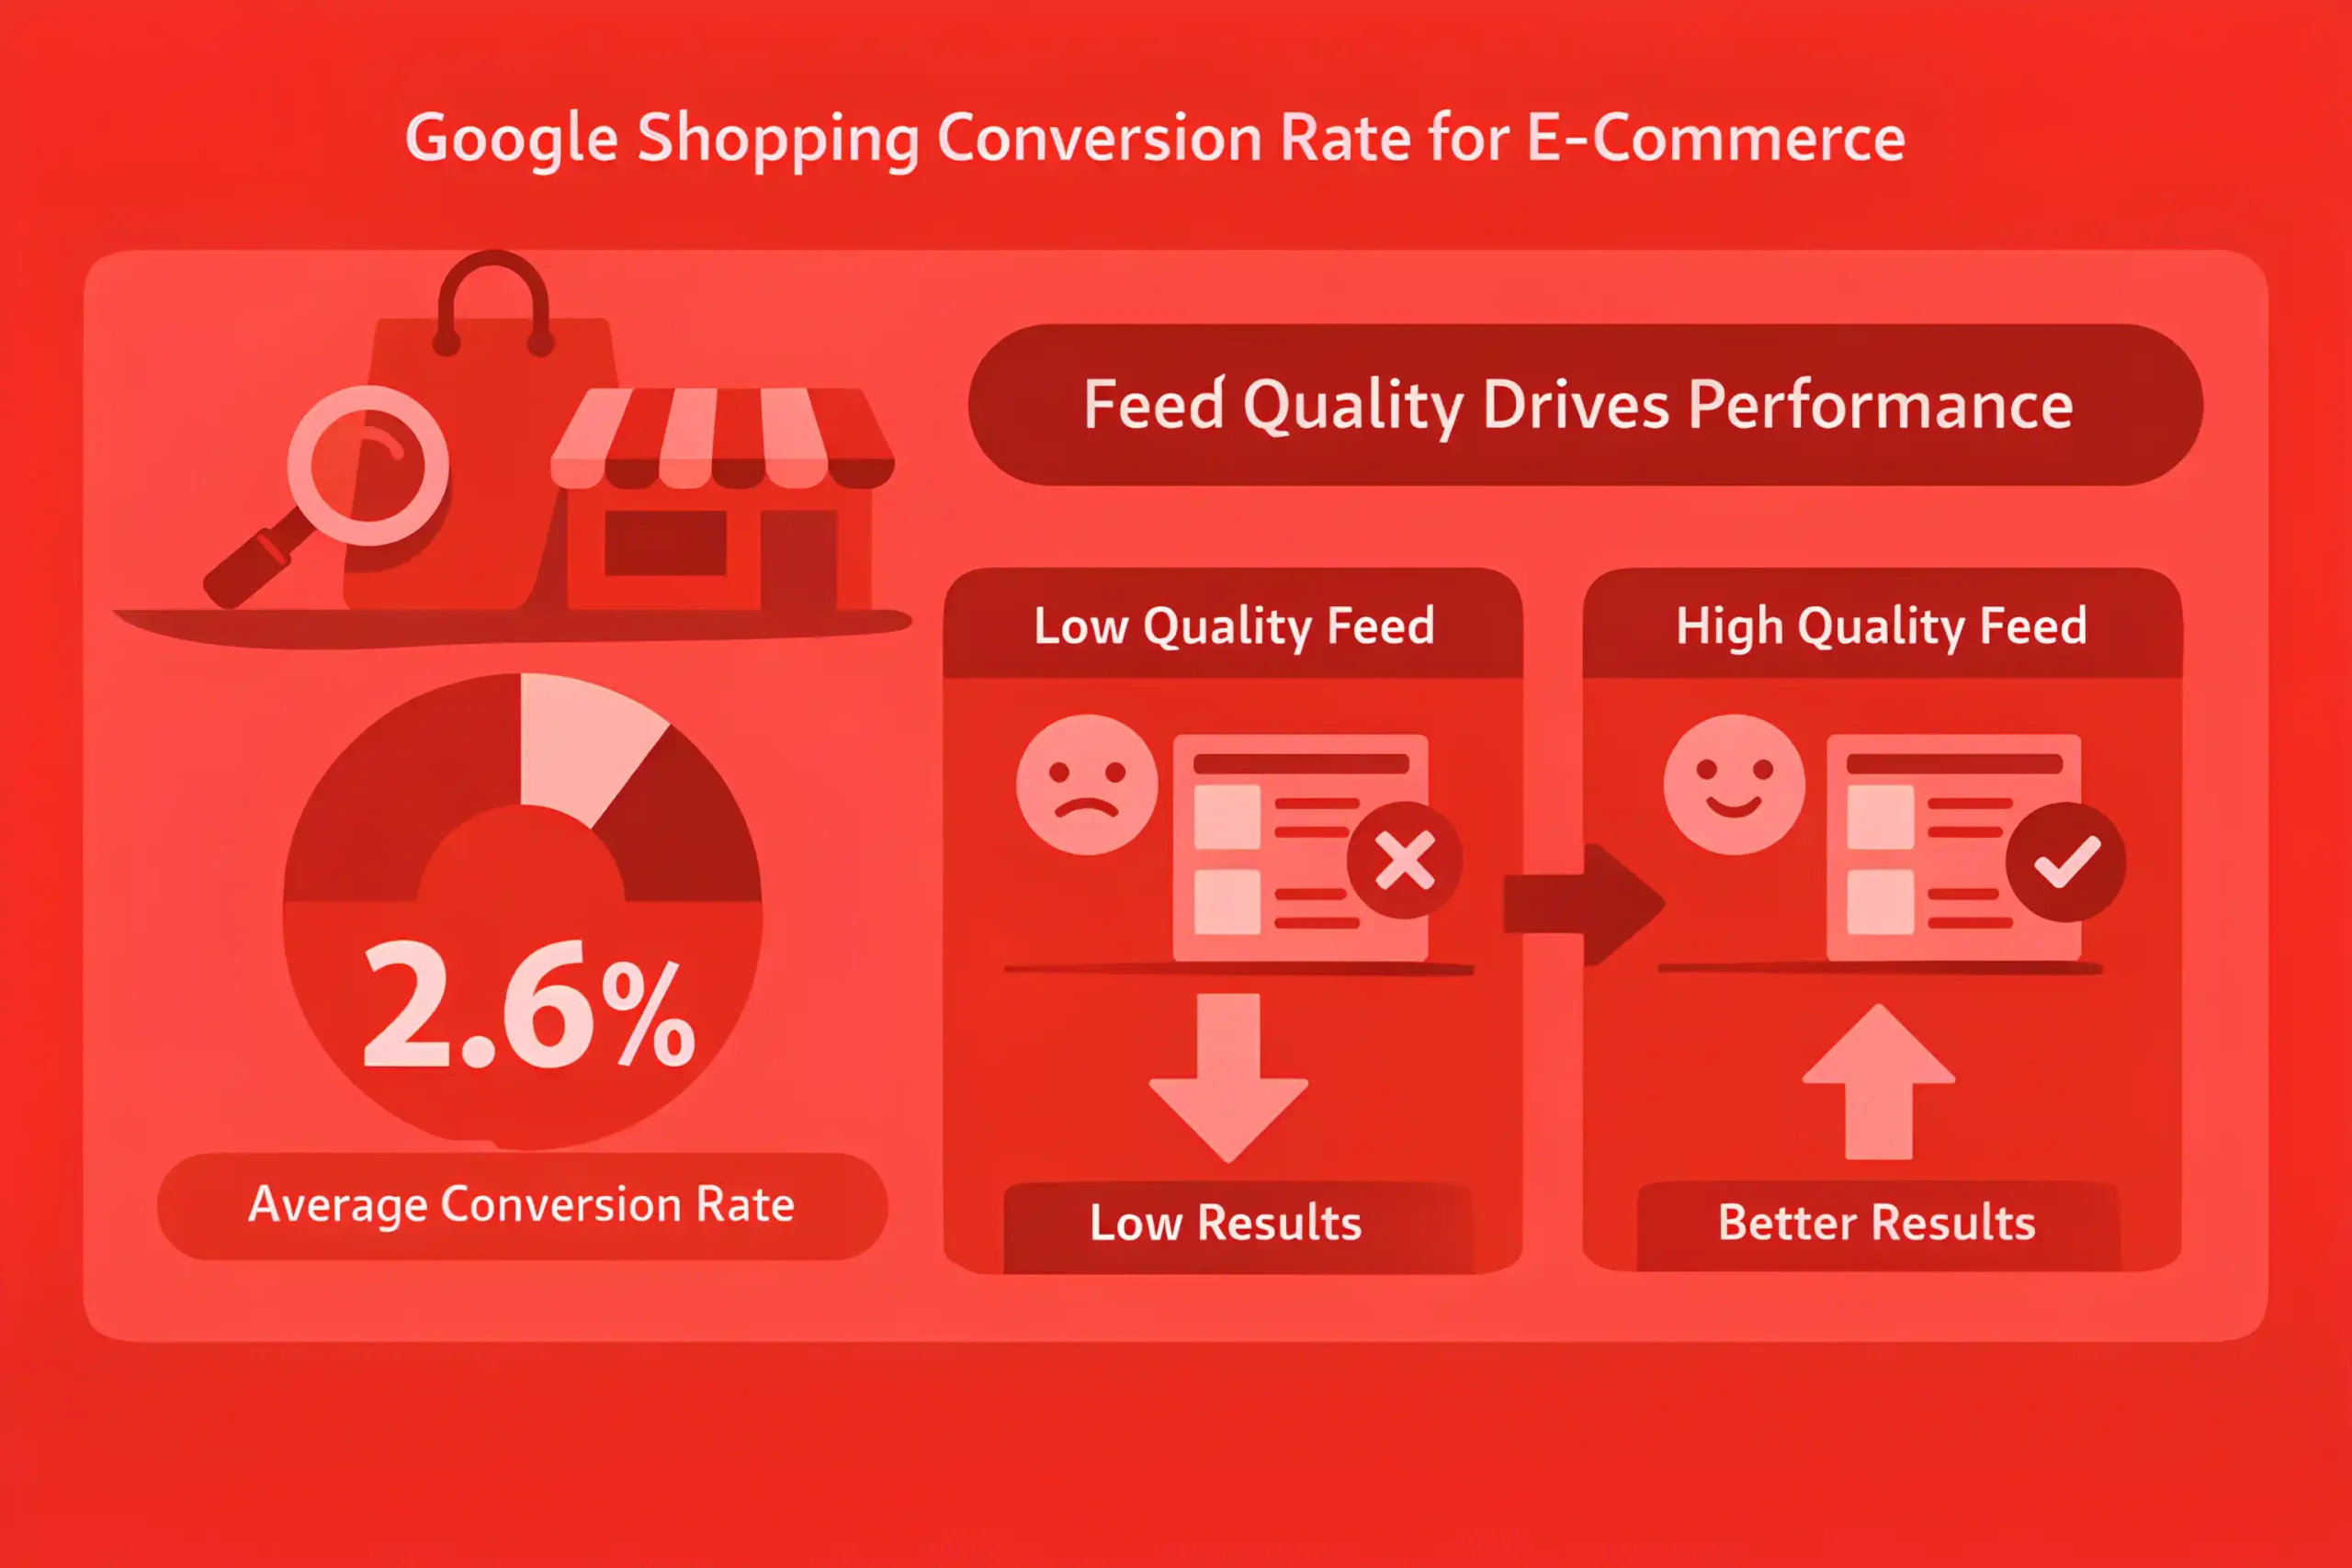
E-commerce Search converts ~3.8% vs Shopping ~2.5%, driven by feed quality and match.
Meta landing page conversion rates average roughly 1.4% to 2.2%, and narrowing the gap with search requires coordination with social media marketing.
Retargeting converts about 3× higher than cold traffic, and mixing them usually drives CPA up.
B2B search CPA typically runs about $72 to $98, and rising acquisition costs have made structured B2B SEO a key complement to paid acquisition.
Meta lead gen CPAs average $28 to $46, where scaling volume often requires integration between paid channels and lifecycle flows through email marketing.
Microsoft Ads often run 12 to 15% cheaper CPAs than comparable Google campaigns, pulling incremental budget their way.
YouTube TrueView conversion rates average ~1.1 to 1.4%, and perform best when followed by sequential retargeting.
PPC-triggered email remarketing converts around 5.7%, often beating paid traffic alone and improving CPA efficiency.
Average ROAS benchmarks are ~4.5:1 for Search, ~3.2:1 for Social, and ~2.1:1 for Display. Higher-intent channels still lead.
Mobile conversion rates run ~18 to 22% lower than desktop, making mobile UX a major optimization gap even with cheaper CPCs.
Personalized pages with dynamic keyword insertion can lift conversions by ~21% vs static pages, often beating budget increases.
RLSA campaigns often convert about 2× higher than standard search, making them a key lever for efficient scale.
SaaS free-trial ads average ~2.9% conversion rates, and trial experience now drives retention more than sheer volume.
Shopping CPA is ~$9 to $22 in high-margin categories, but often tops $28 in low-margin ones where margins cap what you can pay.
Display averages ~0.68% conversion, but lower CPAs can still make it profitable beyond awareness.
With clean conversion signals, AI bidding can cut Search CPAs by ~14 to 18% versus manual bidding.
Multi-touch attribution can lift ROI measurement accuracy by ~11 to 15% versus last-click, changing how performance gets judged.
Retargeting display converts around ~1.9 to 2.4%, far higher than standard display, because context beats volume.
Full-funnel measurement is linked to ~22% higher long-term ROI by aligning budgets to downstream behavior.
Related article: 100+ Reputation Management Statistics
Google Ads Performance Stats
In 2026, Google Search averages ~4.3% conversion, reflecting strong intent.
Performance Max now captures roughly 30% of mid-sized Google Ads spend, and adoption keeps rising as teams expand automation inside broader performance marketing.
Performance Max with audience signals can lift conversions by ~18%, showing ML wins with strong data inputs.
In 2026, the average Google Ads CPA is ~35% higher than in 2023, driven by tougher auction competition.
Google Shopping averages ~2.6% conversion for e-commerce, and feed quality strongly drives performance.
Automated bidding can cut Search CPA by ~12 to 16% versus manual, especially with clean tracking.
Branded search converts around 15% to 18% compared with roughly 3% to 4% for non-branded queries, reinforcing the importance of branding.
Mobile search converts ~17% lower than desktop with ~20% cheaper CPCs. Cheap clicks don’t guarantee cheap customers.
Improved landing-page UX can lift Google Ads conversion rates by ~22% and increasingly impacts Quality Score.
Median first-page bid estimates are up ~14% since 2023, making competitive search real estate pricier.
Quarterly keyword and match-type audits can cut wasted Google Ads spend by ~14 to 19% per year.
RSAs typically drive ~8 to 10% higher CTR than expanded text ads, thanks to stronger creative variety.
Layering audiences (like in-market + remarketing) can lift Search conversion rates by ~25% by adding context.
Google display remarketing averages ~2.2% conversion, about 3 to 4× standard display.
Shopping ROAS averages ~4.8:1 for mid-tier ecommerce, while top brands hit ~6.5:1. Feed optimization drives the lift.
Call-only extensions can lift Search lead volume by ~9 to 12% in service industries by capturing immediate intent.
Automated budget pacing can cut under/overspend issues by ~27% versus manual adjustments.
Top-of-funnel Google Ads keywords average ~5.1% CTR, and intent still sets the ceiling.
Strong negative keyword hygiene can cut CPA by ~15 to 18%, and it’s still underused.
Smart Bidding plus offline conversion imports can lift measured ROAS to ~22% versus last-click by feeding stronger signals.
Read also: 200+ Social Media Marketing Statistics
Paid Social & Video PPC Stats
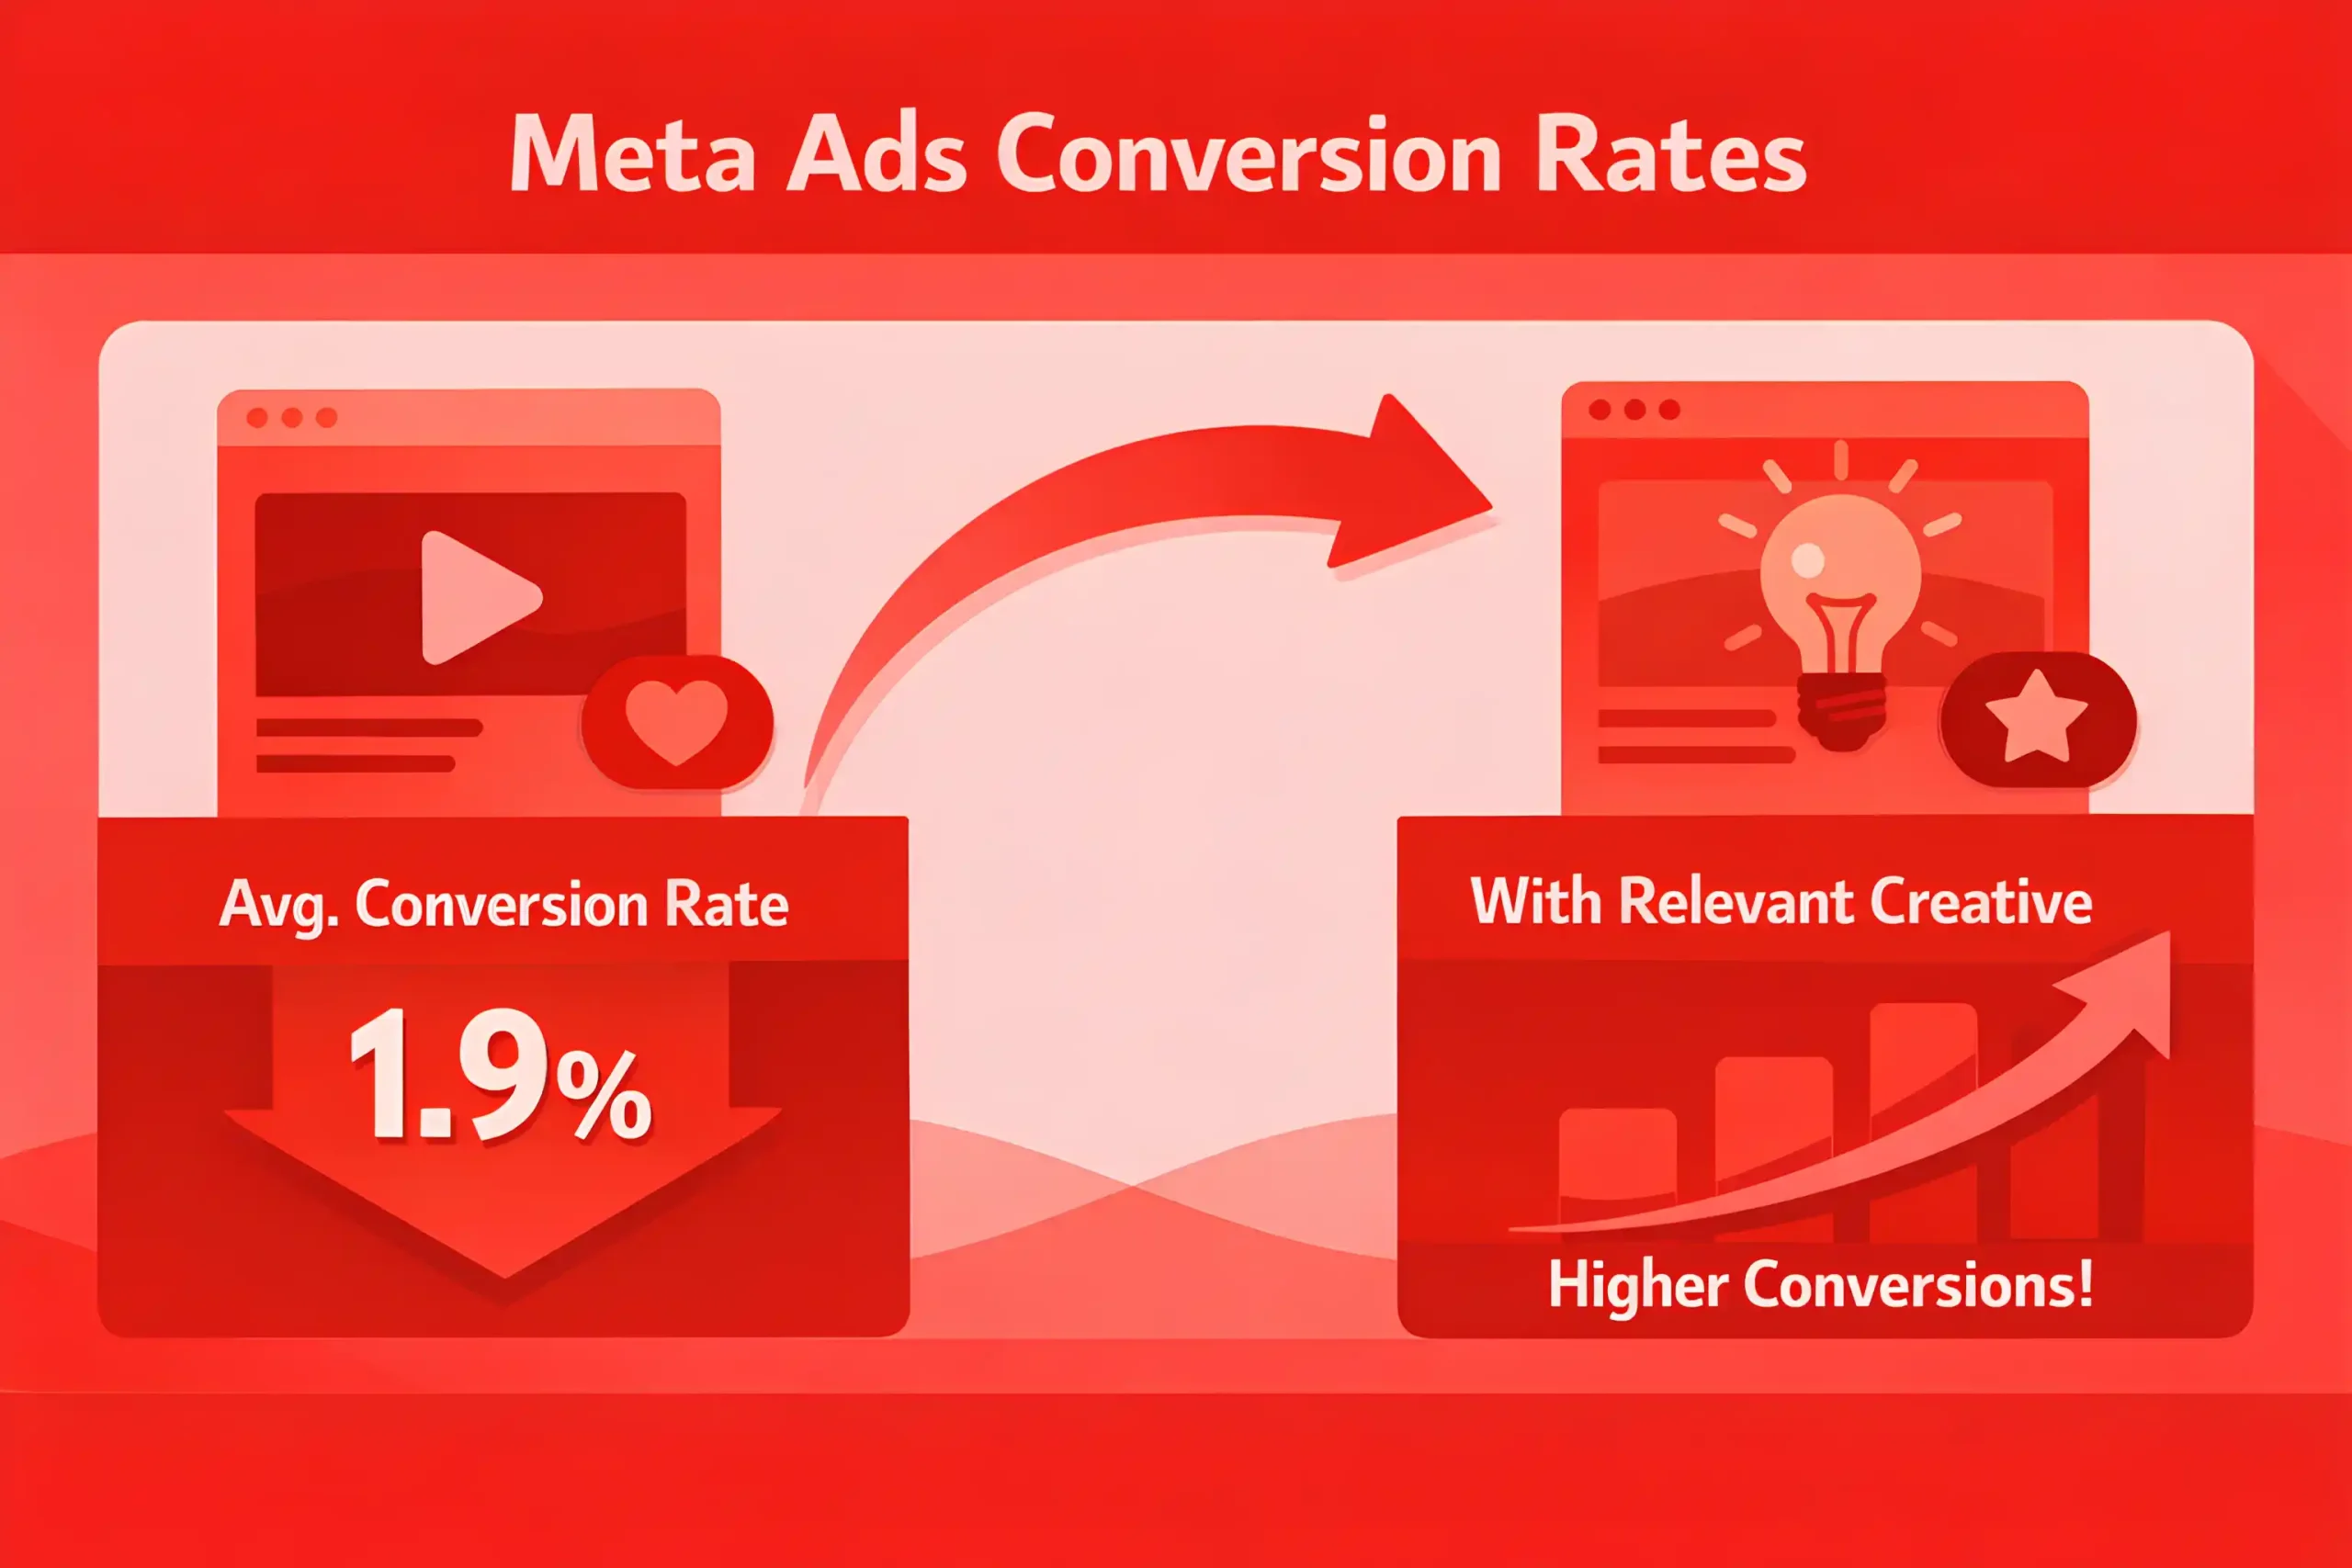
Meta ads average ~1.9% conversion, with creative relevance driving the lift.
LinkedIn CPCs are ~35 to 45% higher than Meta, yet B2B CPA is often ~18 to 25% lower in niche audiences.
TikTok direct-response ads convert ~1.2 to 1.6% on average, and results hinge on offer strength more than virality.
YouTube TrueView and Shorts average ~35 to 48% VTR, with engaging video holding attention longer than static ads.
Video PPC ads drive ~23% higher engagement than image-only creative across platforms.
In 2026, paid social CPA rose ~11 to 14% YoY, so you either optimize harder or spend more to hold volume.
Instagram Reels ads drive ~1.5 to 1.9× higher CTR than feed ads, making short-form the engagement engine.
LinkedIn Sponsored Content converts ~2.9% for mid-to-bottom funnel offers.
Meta dynamic product ads average ~3.3% conversion for e-commerce, beating static catalog ads.
In lifestyle and entertainment niches, TikTok lead gen CPL is ~22 to 28% lower than Facebook.
Paid social retention campaigns convert around ~4.8%, with repeat audiences consistently outperforming new prospects.
Sequenced storytelling on YouTube can drive ~2.3× higher downstream conversions than non-sequenced buys.
Mobile drives about 87% of social video engagement, but desktop converts roughly 28% higher per click, which makes responsive website design critical.
Using lookalikes can cut paid social CPAs by ~17% versus broad interest targeting.
Pinterest ads convert about 1.7% to 2.1% in high-intent categories, and conversion gains typically come from tighter landing paths supported by CRO.
Video PPC brand-lift studies show ~19 to 24% higher ad recall at ~6 to 8 exposures.
Meta retargeting converts ~2.8 to 3.4%, about 2× cold social rates.
E-commerce click-to-checkout rates average ~5.9% across Meta and TikTok, helped by stronger pixel-based tracking.
LinkedIn Message Ads can score ~23% higher lead quality than Sponsored Content by using a more conversational format.
TikTok and YouTube video ads drive ~42 to 55% longer sessions than newsfeed placements, signaling deeper attention.
Related article: 200+ Affiliate Marketing Statistics
The Key Takeaways
PPC is defined by cost pressure and margin compression. CPC inflation outpaces the broader economy, auctions grow more competitive, and standing still means losing share.
Efficiency now scales better than the budget. Conversion rate gains, audience precision, and strong landing pages outperform traffic increases, while automation only works when fueled by clean data and profit-based signals.
Search captures demand, social and video shape it, and retargeting protects it. Profitability belongs to disciplined operators who control data, margins, and measurement, not those who simply spend more.